
Research article · 2025 · Full text
International Journal of Agriculture and NutritionSoil organic matter fractionation and carbon mineralization under long-term manure application
Volume 7(5) · Pages 147–150 · DOI: 10.33545/26646064.2025.v7.i5c.574 ↗
Research areasSoil Carbon and Nitrogen DynamicsAgricultural Science and FertilizationSoil Management and Crop Yield
Abstract
Author-writtenA farmer once remarked that manure is nature’s savings account for soil carbon-but how much of what you deposit actually stays in the bank? This research examined soil organic matter fractionation and carbon mineralization rates under 12 years of continuous cattle manure application at three rates (5, 10, and 20 t ha⁻¹ yr⁻¹) compared with an unfertilized control in a wheat-maize rotation at the Escuela Nacional de Agricultura Tropical, Bucaramanga, Colombia. Soil samples from 0-15 and 15-30 cm depths were fractionated into light fraction, particulate organic matter, mineral-associated organic matter, and humin. Total SOC increased from 14.84 g kg⁻¹ (control) to 25.65 g kg⁻¹ (20 t ha⁻¹) in the 0-15 cm layer. The light fraction showed the largest proportional response (+129.7% at 20 t). Carbon mineralization (56-day incubation) was 38.4% higher under 20 t manure than the control. A carbon balance showed net annual SOC gain of 1,420 kg C ha⁻¹ at the 20 t rate. These results quantify the carbon sequestration potential of long-term manure application in tropical Andean soils.
Summary
Source-checkedPlain-language reading of the full paper, prepared with AI and checked against the text. Each point links to the authors' own words.
Why it matters
- Long-term organic amendments are a reliable way to increase soil organic carbon (SOC) stocks, but how this carbon is distributed among different soil organic matter (SOM) fractions in tropical Andean soils is not well understood. View evidence ↗
- Measuring total bulk SOC shows the amount of carbon accumulated, but it does not reveal the location of the carbon within the soil or its stability. View evidence ↗
- Analyzing the distribution of manure-derived carbon across different fractions is necessary to predict carbon storage efficiency and the risk of carbon loss due to climate or land-use changes. View evidence ↗
The question
- The study aimed to quantify SOC distribution across four physical fractions after 12 years of manure application at three rates, measure carbon mineralization potential, and create a carbon balance for the highest application rate. View evidence ↗
What they did
- The experiment used a wheat-maize rotation in Bucaramanga, Colombia, applying cattle manure at rates of 5, 10, and 20 t ha⁻¹ yr⁻¹ over 12 years, compared to an unfertilized control. View evidence ↗
- Soil samples were collected from 0-15 and 15-30 cm depths using a randomized block design with three replications per treatment (plots of 8 x 6 m). View evidence ↗
- Soil organic matter was separated into four fractions: light fraction (LF) via density flotation, particulate organic matter (POM) and mineral-associated organic matter (MAOM) via wet sieving, and humin via NaOH extraction. View evidence ↗
- Carbon mineralization was measured by tracking CO₂ evolution during a 56-day aerobic incubation at 25 °C and 60% water holding capacity. View evidence ↗
What they found
- In the 0-15 cm soil layer, total SOC increased by 72.8%, rising from 14.84 g kg⁻¹ in the control to 25.65 g kg⁻¹ under the 20 t ha⁻¹ yr⁻¹ manure rate. View evidence ↗
- Carbon mineralization was 38.7% higher in the 20 t manure treatment compared to the control, indicating a larger pool of labile carbon. View evidence ↗
- The 20 t ha⁻¹ yr⁻¹ manure rate resulted in a net annual SOC gain of 1,420 kg C ha⁻¹, which is equivalent to sequestering approximately 5.2 t CO₂-equivalents ha⁻¹ yr⁻¹. View evidence ↗
What it means
- A limitation of the study is that carbon fractions were only measured at a single time point (year 12), rather than at regular intervals to track accumulation trajectories. View evidence ↗
- The 0-15 cm sampling depth may have underestimated carbon changes in deeper soil; the authors suggest future work include deeper profiles and isotopic tracing. View evidence ↗
Visual summary
2 visualsIllustrations explain the paper; charts are replotted from the paper's own table values.
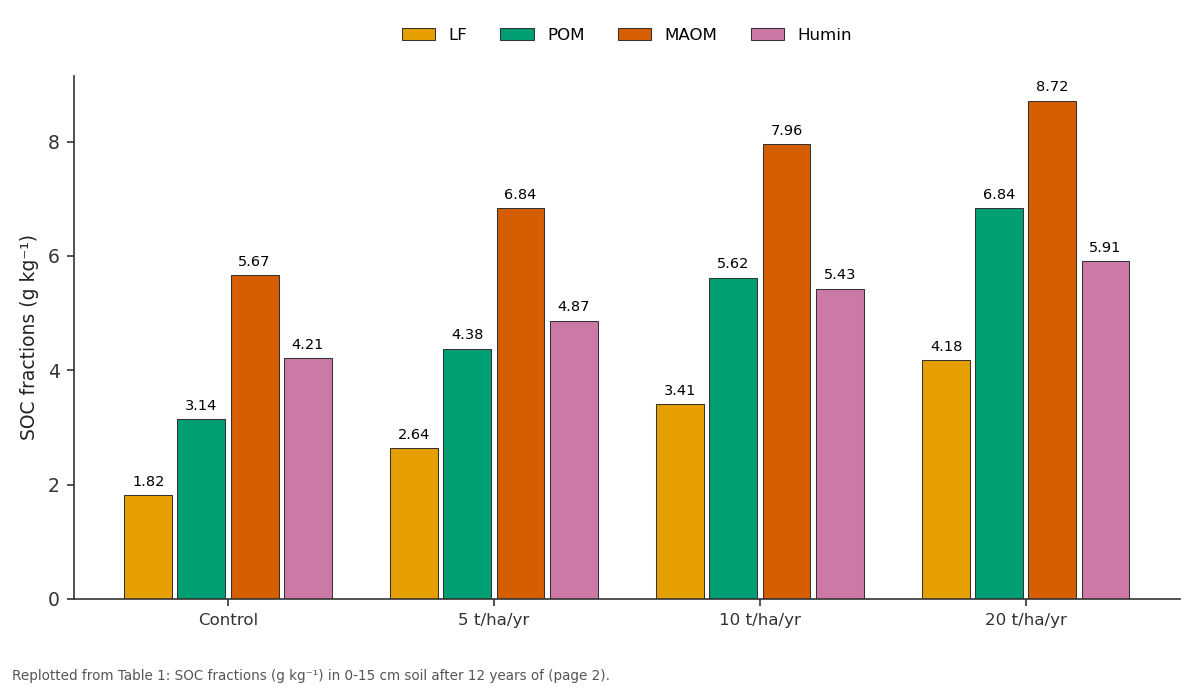
LF and POM and more: Control vs 5 t/ha/yr vs 10 t/ha/yr vs 20 t/ha/yr
Replotted from Table 1 (page 2) of the original paper. Every bar is the paper's own table value.
View source evidence ↗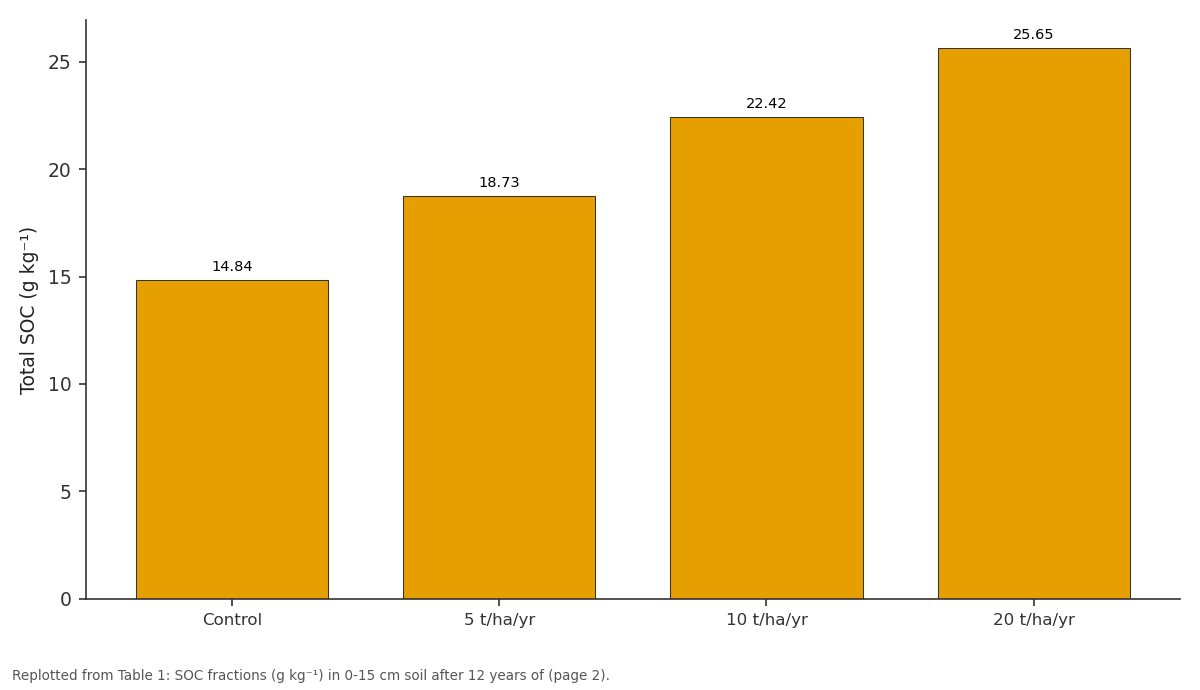
Total SOC: Control vs 5 t/ha/yr vs 10 t/ha/yr vs 20 t/ha/yr
Replotted from Table 1 (page 2) of the original paper. Every bar is the paper's own table value.
View source evidence ↗Figures & tables
From the original paper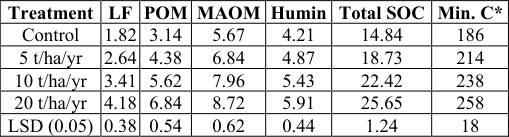 Table 1
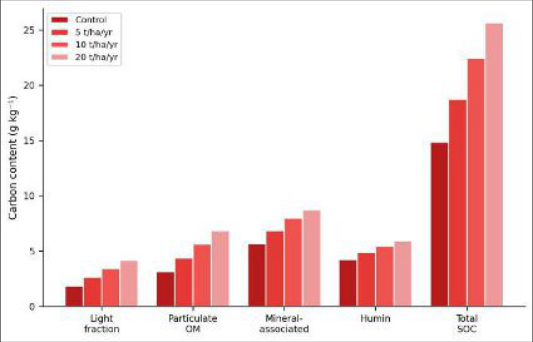 Figure 1
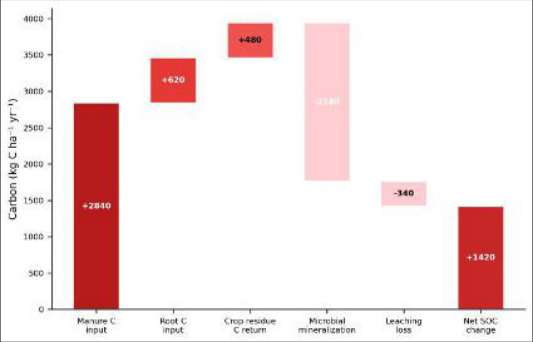 Figure 2
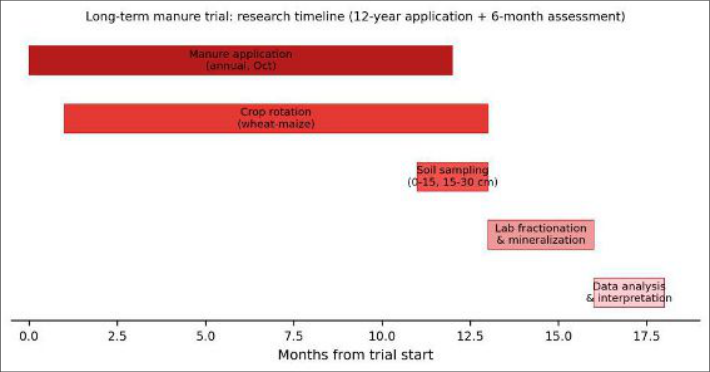 Figure 3
Introduction
Twelve years ago, a small research plot at our institution received its first load of cattle manure-and nobody expected the results to be quite as dramatic as they've turned out. Longterm organic amendments are widely recognized as the most reliable strategy for building soil organic carbon (SOC) stocks, but the fate of applied carbon within different SOM fractions has been poorly characterized for tropical Andean soils [1,2] . Bulk SOC measurements alone tell us how much carbon accumulated, but not where within the soil matrix it resides or how stable it is likely to be [3] . Physical fractionation separates SOM into pools with different turnover rates: the light fraction (LF) consists of partially decomposed plant and manure residues with turnover times of 1-5 years; particulate organic matter (POM) represents intermediate-stability material (5-20 years); and mineral-associated organic matter (MAOM) is the most stable pool, protected by clay mineral surfaces and persisting for decades to centuries [4,5] . Humin-the alkaliinsoluble residue-is operationally the most recalcitrant fraction [6] . Understanding how manure-derived carbon distributes across these fractions helps predict the long-term carbon storage efficiency and the vulnerability of stored carbon to future landuse or climate changes [3,7] . This research aimed to (a) quantify the distribution of SOC across four physical fractions under 12 years of continuous manure application at three rates, (b) measure carbon mineralization potential as an indicator of biologically active carbon, and (c) construct a field-level carbon balance for the highest manure rate.
Baseline Soil Characterisation and Trial History
The long-term manure trial was established in 2010 on a Typic Hapludoll (clay loam, pH 5.8, initial SOC 12.6 g kg⁻¹, CEC 18.4 cmol₂ kg⁻¹) at the research farm of the Escuela Nacional de Agricultura Tropical, Bucaramanga (7°08′N, 73°07′W, 956 m a.s.l.). Mean annual temperature is 23.4 °C and rainfall 1, 180 mm. Cattle manure (C:N 18:1, total C 38.4%, dry basis) has been applied annually in October before wheat sowing. The wheat-maize rotation has run continuously for 12 cycles with no chemical fertilizer applied to any treatment.
Material and Methods
Material and Methods
Material
Composite soil samples (10 cores per plot, 5 cm diameter) were collected from 0-15 and 15-30 cm depths in September 2022, at the end of the 12th cropping cycle. Four treatments in a randomized block design with three replications (plot size 8 × 6 m): T 1 (unfertilized control), T 2 (manure 5 t ha⁻¹ yr⁻¹), T 3 (10 t), T 4 (20 t). Samples were air-dried, passed through a 2 mm sieve, and stored at 4 °C until analysis.
Methods
Physical fractionation followed the method of Six et al. [5] with modifications: 2000). Carbon mineralization was assessed by 56-day aerobic incubation at 25 °C, 60% WHC: CO₂ evolved was trapped in NaOH and titrated with HCl at 7, 14, 28, and 56 days [8] . Carbon balance was calculated as: Net SOC change = C inputs (manure + root + residue) -C losses (mineralization + leaching). Data were analyzed by ANOVA with LSD at p ≤ 0.05 in SAS 9.4.
Carbon Mineralization Kinetics: Mineralization data were fitted to a first-order kinetic model:
where C(t) is cumulative CO₂-C at time t, C₀ is the potentially mineralizable pool, and k is the rate constant.
Half-life of the labile pool was calculated as t½ = ln(2)/k. Model fitting was performed using nonlinear least squares in R v.4.3. Total SOC at 0-15 cm increased by 72.8% under 20 t manure versus the control (Table 1). The light fraction showed the largest proportional response (+129.7%), followed by POM (+117.8%), MAOM (+53.8%), and humin (+40.4%). Mineralization was 38.7% higher under 20 t manure, reflecting a larger labile carbon pool. The potentially mineralizable fraction (C₀) was 4.8% of total SOC in the control and 6.2% under 20 t manure.
| Treatment | LF | POM | MAOM | Humin | Total SOC | Min. C* |
|---|---|---|---|---|---|---|
| Control | 1.82 | 3.14 | 5.67 | 4.21 | 14.84 | 186 |
| 5 t/ha/yr | 2.64 | 4.38 | 6.84 | 4.87 | 18.73 | 214 |
| 10 t/ha/yr | 3.41 | 5.62 | 7.96 | 5.43 | 22.42 | 238 |
| 20 t/ha/yr | 4.18 | 6.84 | 8.72 | 5.91 | 25.65 | 258 |
| LSD (0.05) | 0.38 | 0.54 | 0.62 | 0.44 | 1.24 | 18 |
Table text extracted from the original PDF; superscript letters are shown inline. The original table image is below.
View original table image
Results
Results
Comprehensive Interpretation
The waterfall chart (Figure 2) reveals that only 36% of the annual manure C input was retained as net SOC gain-the rest was mineralized (55.2%) or lost through leaching (8.6%). This 36% retention efficiency is within the range reported for temperate systems (25-45%) and provides a practical conversion factor for predicting SOC change from a given manure application rate.
Discussion
The disproportionately large response of the light fraction (+129.7%) compared with MAOM (+53.8%) is consistent with the understanding that fresh organic inputs first enter the labile pool before being processed by soil microbes and partially transferred to more stable mineral-associated forms [4, 5] . The higher mineralization rate under manure reflects the larger labile pool size and more active microbial community sustained by continuous organic inputs [8] .
The net SOC gain of 1, 420 kg C ha⁻¹ yr⁻¹ at the 20 t rate translates to approximately 5.2 t CO₂-equivalents ha⁻¹ yr⁻¹ sequestered-a meaningful climate benefit if scaled across the Colombian Andean farming landscape [2,7] . However, the relatively low proportion of new carbon entering the stable MAOM fraction (only 28.2% of the SOC increase) suggests that much of the accumulated carbon is potentially vulnerable to loss if manure application were to stop. One limitation is that this research measured carbon fractions at a single time point (year 12). Repeated sampling at intervals would have tracked the trajectory of carbon accumulation in each fraction. Also, the 0-15 cm sampling depth captures the most responsive zone but may underestimate deeper carbon changes. Future work should include deeper profiles and isotopic tracing to quantify the manure-derived proportion in each fraction.
Conclusion
Twelve years of cattle manure application at 20 t ha⁻¹ yr⁻¹ increased total SOC by 72.8% in the 0-15 cm layer of a tropical Andean Hapludoll. The light fraction and particulate organic matter showed the greatest proportional gains, while mineral-associated organic matter increased more modestly. Net annual carbon sequestration was 1, 420 kg C ha⁻¹. About 36% of applied manure carbon was retained as SOC. These findings support the promotion of long-term organic amendment as a carbon sequestration strategy in Colombian Andean farming systems, though the predominance of labile fractions in the carbon gain warrants continued manure application to maintain stocks.
Figures and tables from the paper
References
15 in the original paper- Lal R. Soil carbon sequestration to mitigate climate change. Geoderma. 2004;123(1-2):1-22.
- Amezquita E, Thomas RJ, Rao IM, Molina DL, Hoyos P. Use of deep-rooted tropical pastures to build-up an arable layer through improved soil properties of an Oxisol in the Eastern Plains of Colombia. Agriculture, Ecosystems and Environment. 2004;103(2):269-277.
- von Lutzow M, Kogel-Knabner I, Ekschmitt K, Matzner E, Guggenberger G. Stabilization of organic matter in temperate soils: mechanisms and their relevance. Soil Biology and Biochemistry. 2006;38(5):1011-1025.
- Gregorich EG, Beare MH, McKim UF, Skjemstad JO. Chemical and biological characteristics of physically uncomplexed organic matter. Soil Science Society of America Journal. 2006;70(3):975-985.
- Six J, Conant RT, Paul EA, Paustian K. Stabilization mechanisms of soil organic matter: implications for Csaturation of soils. Plant and Soil. 2002;241(2):155-176.
- Stevenson FJ. Humus chemistry: genesis, composition, reactions. John Wiley and Sons. 1994;2nd edition.
- Paustian K, Lehmann J, Ogle S, Reay D, Robertson GP, Smith P. Climate-smart soils. Nature. 2016;532(7597):49-57.
- Sparling GP. Ratio of microbial biomass carbon to soil organic carbon as a sensitive indicator of changes in soil organic matter. Australian Journal of Soil Research. 1992;30(2):195-207.
- Haynes RJ. Labile organic matter fractions as central components of the quality of agricultural soils: an overview. Advances in Agronomy. 2005;85:221-268.
- Bhogal A, Nicholson FA, Rollett A, Taylor M, Litterick A, Sherwood M. Improvements in the quality of agricultural soils following organic material additions. Applied Soil Ecology. 2018;131:35-44.
- Maillard E, Angers DA. Animal manure application and soil organic carbon stocks: a meta-analysis. Global Change Biology. 2014;20(2):666-679.
- Cambardella CA, Elliott ET. Particulate soil organicmatter changes across a grassland cultivation sequence. International Journal of Agriculture and Nutrition https://www.agriculturejournal.net Soil Science Society of America 1992;56(3):777-783.
- Lehmann J, Kleber M. The contentious nature of soil organic matter. Nature. 2015;528(7580):60-68.
- Bolan NS, Adriano DC, Kunhikrishnan A, James T, McDowell R, Senesi N. Dissolved organic matter: biogeochemistry, dynamics, and environmental significance in soils. Advances in Agronomy. 2011;110:1-75.
- Cotrufo MF, Wallenstein MD, Boot CM, Denef K, Paul E. The microbial efficiency-matrix stabilization framework integrates plant litter decomposition with soil organic matter stabilization. Nature Ecology and Evolution. 2013;1:1-10.