
Research article · 2025 · Full text
International Journal of Agriculture and NutritionPhysiological basis of heat tolerance in late-planted wheat genotypes under terminal heat stress
Volume 7(5) · Pages 110–113 · DOI: 10.33545/26646064.2025.v7.i5b.572 ↗
Research areasPlant Stress Responses and ToleranceGenetics and Plant BreedingWheat and Barley Genetics and Pathology
Abstract
Author-writtenNearly 40% of the global wheat area faces terminal heat stress, yet physiological screening criteria for heat tolerance remain poorly standardized. This research assessed eight wheat genotypes planted late (December 15) at Rajshahi Agricultural University, Bangladesh, during rabi 2022–23 and 2023–24 to identify reliable physiological markers of heat tolerance under field conditions. A randomized complete block design with three replications was used. Membrane stability index (MSI), chlorophyll content index (CCI), canopy temperature depression (CTD), proline accumulation, and grain filling rate (GFR) were measured at anthesis and 15 days post-anthesis. Maximum temperatures during grain filling exceeded 35 °C on 23 days in 2023 and 27 days in 2024. Genotypes DBW-187 and HD-3226 consistently recorded the highest MSI (72.8% and 71.3%), CTD (6.7 and 6.2 °C), and GFR (1.91 and 1.83 mg day⁻¹). MSI showed the strongest correlation (r = 0.89) with grain yield under stress. A composite heat tolerance index combining MSI, CTD, and GFR explained 83.7% of yield variability. These results suggest that MSI-CTD-GFR screening can accelerate identification of heat-tolerant wheat lines for late-sown environments.
Summary
Source-checkedPlain-language reading of the full paper, prepared with AI and checked against the text. Each point links to the authors' own words.
Why it matters
- Terminal heat stress affects nearly 40% of global wheat areas, but there is a lack of standardized physiological criteria to screen for heat tolerance. View evidence ↗
- In susceptible wheat cultivars, terminal heat stress can reduce yields by 15–25% by shortening grain filling, accelerating leaf senescence, and reducing test weight. View evidence ↗
- Current screening protocols often rely on single traits, which may be insufficient because heat tolerance involves multiple genes and mechanisms. View evidence ↗
The question
- The study aimed to quantify how eight wheat genotypes respond physiologically to terminal heat stress in late-planted fields in Bangladesh and to find a combination of traits that best predicts grain yield. View evidence ↗
What they did
- Eight wheat genotypes were tested in a randomized complete block design with three replications at Rajshahi Agricultural University, Bangladesh, during the 2022–23 and 2023–24 rabi seasons, with planting on December 15. View evidence ↗
- The researchers measured five physiological markers: membrane stability index (MSI), chlorophyll content index (CCI), canopy temperature depression (CTD), proline accumulation, and grain filling rate (GFR) at anthesis and 15 days later. View evidence ↗
- A composite heat tolerance index (HTI) was created by summing standardized MSI, CTD, and GFR values, and stepwise regression was used to determine the best trait combination for predicting yield. View evidence ↗
What they found
- Genotype DBW-187 was the most tolerant, showing the highest grain yield (3.61 t ha⁻¹) and the best scores for MSI (72.8%), CCI (44.3 SPAD), CTD (6.7 °C), proline (19.2 µmol g⁻¹), and GFR (1.91 mg day⁻¹). View evidence ↗
- Genotype HUW-838 was identified as the most susceptible, recording the lowest values for all measured parameters and a yield of 2.31 t ha⁻¹. View evidence ↗
- The membrane stability index (MSI) was the strongest single predictor of grain yield, with a correlation of r = 0.89 and an r² of 0.79. View evidence ↗
- A composite index combining MSI, CTD, and GFR explained 83.7% of the variability in grain yield under terminal heat stress. View evidence ↗
- Adding proline accumulation and chlorophyll content index (CCI) to the composite model provided only marginal improvements in predicting yield. View evidence ↗
What it means
- The authors conclude that a composite index of MSI, CTD, and GFR provides a rapid, non-destructive method for screening heat-tolerant wheat in breeding programs. View evidence ↗
- The authors state that the proposed composite index needs further validation across different sowing dates and multiple locations. View evidence ↗
Visual summary
3 visualsIllustrations explain the paper; charts are replotted from the paper's own table values.
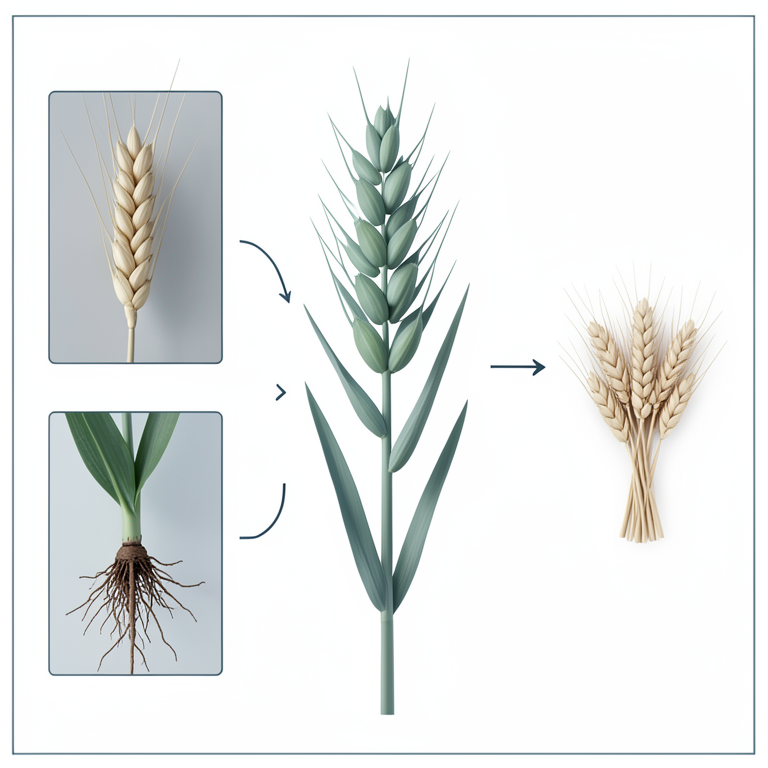
Composite Heat Tolerance Index Components
AI-generated conceptual illustration (wheat plants (Triticum aestivum)). It explains the idea and does not show study data.
View source evidence ↗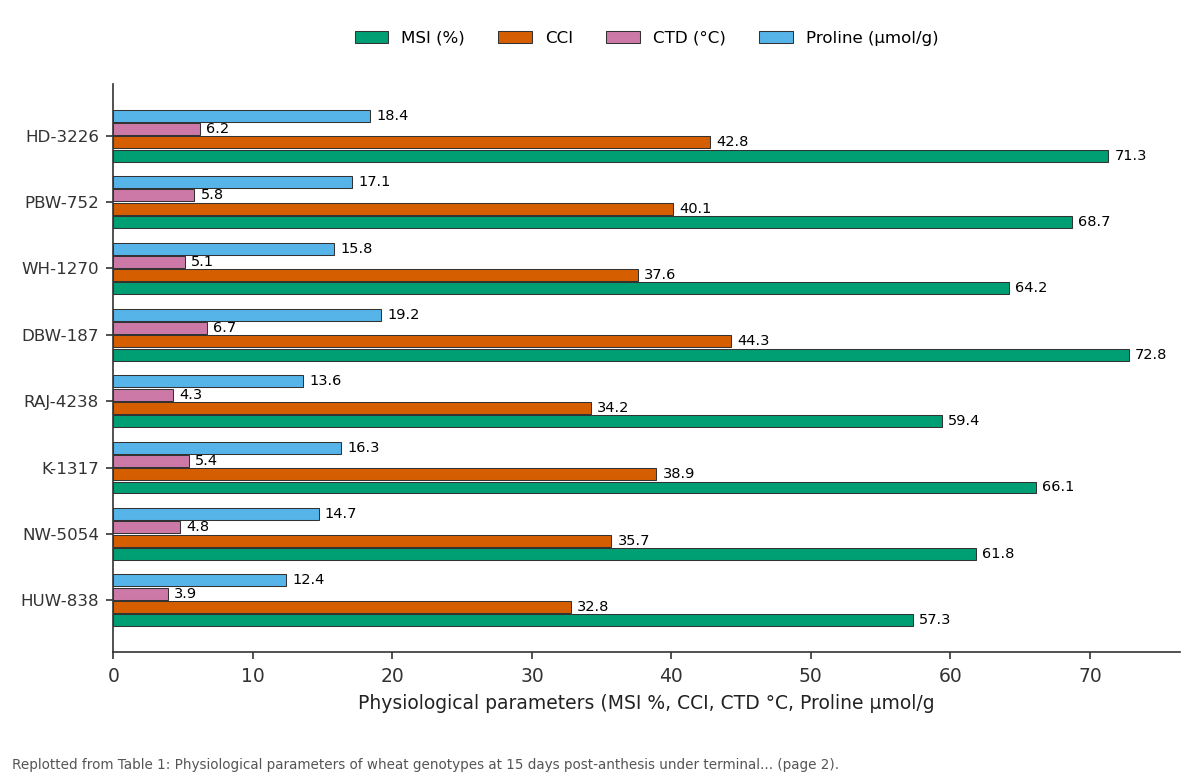
MSI (%) and CCI and more: HD-3226 vs PBW-752 vs WH-1270 vs DBW-187 vs RAJ-4238
Replotted from Table 1 (page 2) of the original paper. Every bar is the paper's own table value.
View source evidence ↗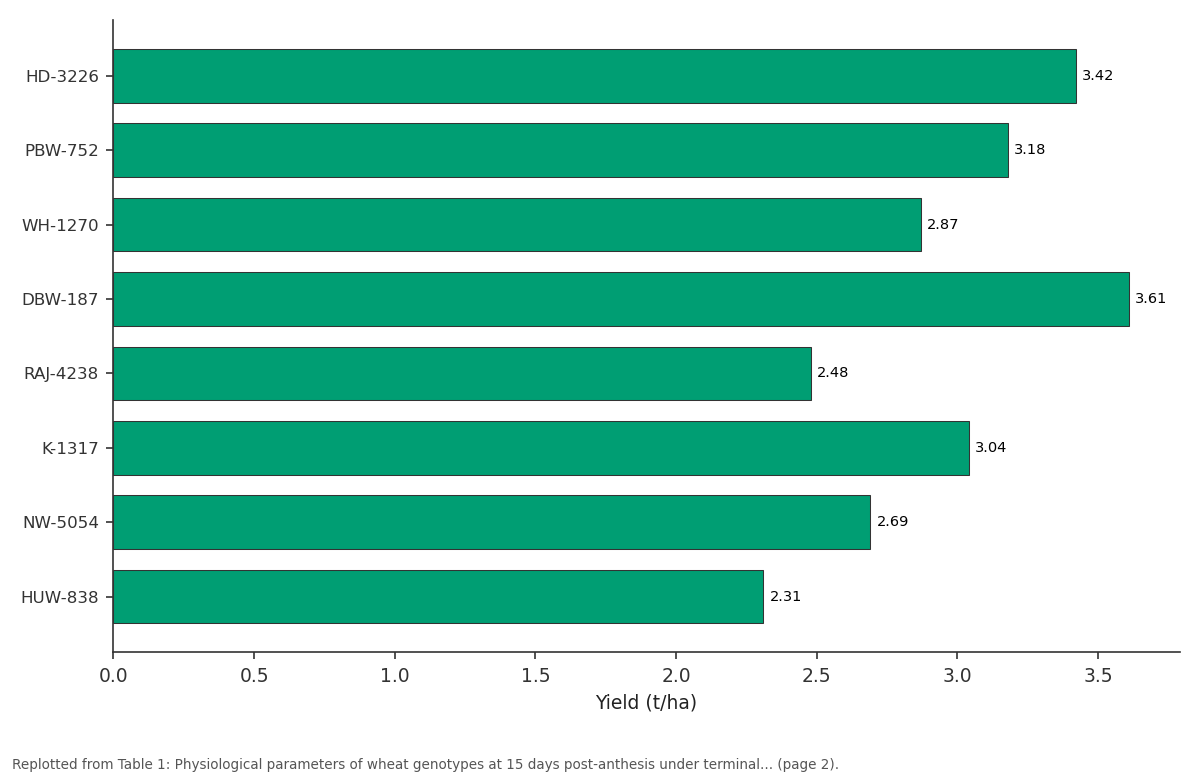
Yield (t/ha): HD-3226 vs PBW-752 vs WH-1270 vs DBW-187 vs RAJ-4238
Replotted from Table 1 (page 2) of the original paper. Every bar is the paper's own table value.
View source evidence ↗Figures & tables
From the original paper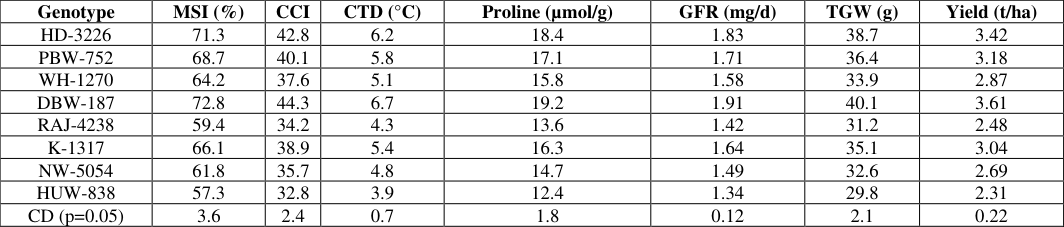 Table 1
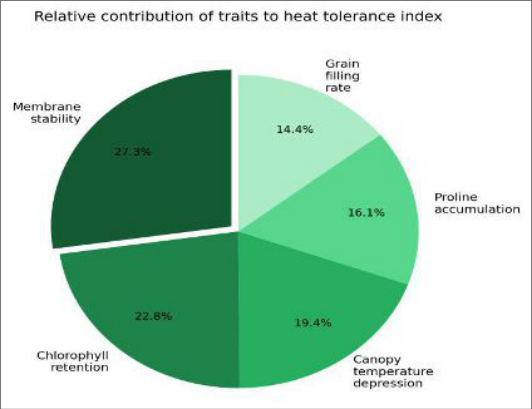 Figure 1
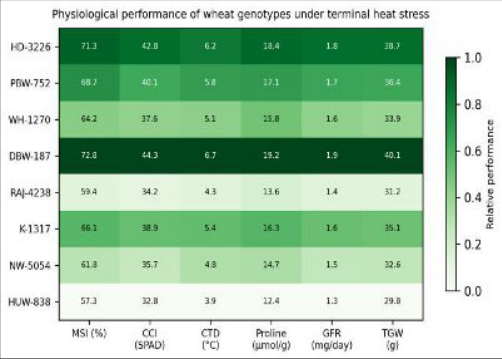 Figure 2
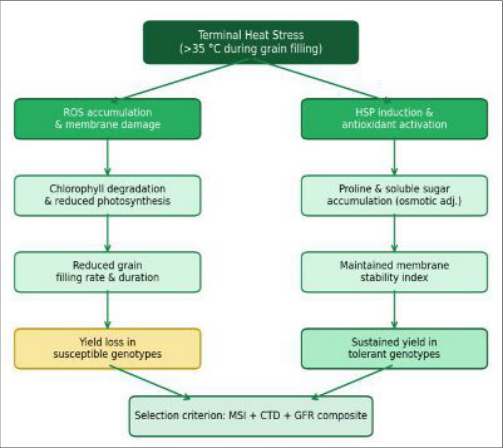 Figure 3
Introduction
About 36% of irrigated wheat in South Asia is planted after the optimal sowing window, exposing the crop to temperatures above 35 °C during grain filling [1] . In Bangladesh, where wheat occupies roughly 0.35 million hectares, delayed planting after harvest of transplanted aman rice is a persistent agronomic constraint [2] . Terminal heat stress shortens the grain filling period, accelerates leaf senescence, and reduces test weight-collectively cutting yields by 15-25% in susceptible cultivars [3,4]. Plants cope with high temperatures through a combination of avoidance and tolerance mechanisms. Canopy temperature depression, driven by transpirational cooling, allows some genotypes to maintain leaf temperatures 4-7 °C below ambient air [5] . Membrane stability, measured as electrolyte leakage under controlled heating, reflects the integrity of cellular membranes and has been linked to stress survival in wheat and rice [6] . Proline accumulates as a compatible osmolyte and protein stabilizer under heat and drought [7] , while sustained chlorophyll content supports continued photosynthesis during grain fill [8] . Despite the availability of individual trait data, few investigations have assessed how well combinations of these physiological parameters predict yield under field-level terminal heat stress, particularly in the Gangetic plain environment. Most screening protocols rely on single traits, yet heat tolerance is polygenic and multi-mechanistic [9,10]. A composite index that weights the most informative traits could accelerate breeding progress and reduce the cost of large-scale germplasm screening [11] . This research aimed to (a) quantify the physiological responses of eight wheat genotypes to terminal heat stress under late-planted field conditions at Rajshahi, Bangladesh, and (b) identify a trait combination with the highest predictive value for grain yield under heat.
Climatic Conditions During the Research
Rajshahi lies in the semi-arid western zone of Bangladesh (24°22′N, 88°36′E, 18 m a.s.l.) with
Materials and Methods
Materials and Methods
Materials
Eight bread wheat (Triticum aestivum L.) genotypes-HD-3226, PBW-752, WH-1270, DBW-187, RAJ-4238, K-1317, NW-5054, and HUW-838-were obtained from the Wheat Research Centre, Rajshahi. These included released varieties and advanced lines representing diverse heat-response backgrounds. Seeds were treated with carbendazim (2 g kg⁻¹) before sowing. Basal fertilizer was applied at 120:60:40 kg N:P₂O₅:K₂O ha⁻¹, with N split in three doses.
Methods
The trial was sown on December 15 in both years at the research farm of Rajshahi Agricultural University in a randomized complete block design with three replications. Plot size was 3 m × 2 m with 20 cm row spacing. Five irrigations were scheduled at crown root initiation, tillering, booting, anthesis, and dough stages. MSI was determined by the dual-temperature electrolyte leakage method [6] at anthesis and 15 days post-anthesis. CCI was measured using a SPAD-502 chlorophyll meter on the flag leaf (mean of 10 readings per plot). CTD was recorded with a handheld infrared thermometer at solar noon on clear days. Proline was quantified by the acid-ninhydrin method [12] . GFR was calculated as the ratio of final grain weight to the duration from anthesis to physiological maturity. A composite heat tolerance index (HTI) was computed as the standardized sum of MSI, CTD, and GFR. Data were analyzed with ANOVA and Pearson correlation (STAR v.2.0.1). Stepwise regression identified the best trait combination for yield prediction.
Crop Growth Stage Documentation
Phenological stages were recorded on the Zadoks decimal scale [13] . Flag leaf emergence (Z37-39) occurred between 58 and 64 DAS, anthesis (Z60-65) between 68 and 76 DAS, and physiological maturity (Z92) between 98 and 112 DAS depending on genotype. The grain filling window (anthesis to maturity) coincided with the peak heat period (late February to mid-March), ensuring that genotypic differences in heat response were expressed under natural field stress.
Results
Table Stepwise regression identified MSI as the strongest single predictor of grain yield (r² = 0.79), followed by CTD and GFR (Figure 1). The three-trait composite index (MSI + CTD + GFR) explained 83.7% of yield variability under terminal heat stress. Proline and CCI added only marginal improvement when included as fourth and fifth variables.
Comprehensive Interpretation
The heatmap (Figure 2) clearly separates the tolerant group (DBW-187, HD-3226, PBW-752) from the susceptible group (HUW-838, RAJ-4238). The pathway diagram (Figure 3) outlines how heat triggers both damage and defense cascades, with tolerant genotypes maintaining membrane integrity and sustaining grain fill while susceptible ones lose yield.
Discussion
The strong correlation between MSI and grain yield (r = 0.89) agrees with reports from the Indo-Gangetic plains where membrane thermostability was the most consistent predictor of heat tolerance in wheat [6,14]. MSI reflects cellular membrane integrity, which directly controls ion homeostasis and enzyme function during heat episodes. The finding that CTD ranked second aligns with the physiological logic that genotypes capable of maintaining transpirational cooling can delay leaf senescence and extend the photosynthetically active period [5] . GFR emerged as the third contributor to the composite index, which makes sense because grain filling is the yieldforming process most sensitive to high temperature [3] . Together, MSI, CTD, and GFR captured 83.7% of yield variation-a level of predictive power that exceeds the 60-70% reported for single-trait models in earlier wheat screening trials [9,10]. This three-trait index could serve as a practical field-level tool, since all three measurements are non-destructive and can be completed within a few hours per genotype.
Proline accumulation was positively correlated with heat tolerance but added little predictive value beyond the threetrait index. This may be because proline serves more as a general stress marker than a direct yield determinant [7] . The relatively low contribution of CCI was unexpected but could reflect compensatory photosynthetic adjustments in some genotypes that maintained yield despite moderate chlorophyll loss. Future work should validate this index across multiple locations and sowing dates.
Conclusion
This research identified DBW-187 and HD-3226 as the most heat-tolerant genotypes among eight wheat lines evaluated under late-sown terminal heat stress at Rajshahi, Bangladesh. Membrane stability index showed the strongest association with grain yield and appears to be the single best physiological screening trait. A composite index combining MSI, CTD, and GFR explained over 83% of yield variation under stress and offers a rapid, non-destructive screening approach for breeding programs. Proline and chlorophyll content, while informative, didn't add meaningful predictive power beyond the three-trait model. These findings can be applied directly in wheat improvement programs targeting late-sown environments across the Indo-Gangetic region.
Acknowledgement
Acknowledgements Funding SourcesThis research was supported by internal funding from Rajshahi Agricultural University for crop physiology research.
Figures and tables from the paper
| Genotype | MSI (%) | CCI | CTD (°C) | Proline (µmol/g) | GFR (mg/d) | TGW (g) | Yield (t/ha) |
|---|---|---|---|---|---|---|---|
| HD-3226 | 71.3 | 42.8 | 6.2 | 18.4 | 1.83 | 38.7 | 3.42 |
| PBW-752 | 68.7 | 40.1 | 5.8 | 17.1 | 1.71 | 36.4 | 3.18 |
| WH-1270 | 64.2 | 37.6 | 5.1 | 15.8 | 1.58 | 33.9 | 2.87 |
| DBW-187 | 72.8 | 44.3 | 6.7 | 19.2 | 1.91 | 40.1 | 3.61 |
| RAJ-4238 | 59.4 | 34.2 | 4.3 | 13.6 | 1.42 | 31.2 | 2.48 |
| K-1317 | 66.1 | 38.9 | 5.4 | 16.3 | 1.64 | 35.1 | 3.04 |
| NW-5054 | 61.8 | 35.7 | 4.8 | 14.7 | 1.49 | 32.6 | 2.69 |
| HUW-838 | 57.3 | 32.8 | 3.9 | 12.4 | 1.34 | 29.8 | 2.31 |
| CD (p=0.05) | 3.6 | 2.4 | 0.7 | 1.8 | 0.12 | 2.1 | 0.22 |
Table text extracted from the original PDF; superscript letters are shown inline. The original table image is below.
View original table image
References
19 in the original paper- Mondal S, Singh RP, Crossa J, Huerta-Espino J, Sharma I. Earliness in wheat: a key to adaptation under terminal heat stress. Field Crops Research. 2013;151:19-26.
- Hossain A, Sarker MAZ, Hakim MA, Islam MT, Ali ME. Effect of late sowing heat stress on yield and yield International Journal of Agriculture and Nutrition https://www.agriculturejournal.net components of wheat varieties. Bangladesh Journal of Agricultural Research. 2013;38(4):671-683.
- Farooq M, Bramley H, Palta JA, Siddique KHM. Heat stress in wheat during reproductive and grain-filling phases. Critical Reviews in Plant Sciences. 2011;30(6):491-507.
- Asseng S, Ewert F, Martre P, Rötter RP. Rising temperatures reduce global wheat production. Nature Climate Change. 2015;5(2):143-147.
- Reynolds MP, Pierre CS, Saad ASI, Vargas M, Condon AG. Evaluating potential genetic gains in wheat associated with stress-adaptive trait expression. Crop Science. 2007;47(S3):S172-S180.
- Blum A, Ebercon A. Cell membrane stability as a measure of drought and heat tolerance in wheat. Crop Science. 1981;21(1):43-47.
- Hayat S, Hayat Q, Alyemeni MN, Wani AS, Pichtel J, Ahmad A. Role of proline under changing environments. Plant Signaling and Behavior. 2012;7(11):1456-1466.
- Ristic Z, Bukovnik U, Prasad PVV. Correlation between heat stability of thylakoid membranes and loss of chlorophyll in winter wheat under heat stress. Crop Science. 2007;47(5):2067-2073.
- Cossani CM, Reynolds MP. Physiological traits for improving heat tolerance in wheat. Plant Physiology. 2012;160(4):1710-1718.
- Pradhan GP, Prasad PVV, Fritz AK, Kirkham MB, Gill BS. Effects of drought and high temperature stress on synthetic hexaploid wheat. Functional Plant Biology. 2012;39(3):190-198.
- Sharma DK, Andersen SB, Ottosen CO, Rosenqvist E. Wheat cultivars selected for high Fv/Fm under heat stress maintain high photosynthesis, total chlorophyll, stomatal conductance, transpiration and dry matter. Physiologia Plantarum. 2015;153(2):284-298.
- Bates LS, Waldren RP, Teare ID. Rapid determination of free proline for water-stress studies. Plant and Soil. 1973;39(1):205-207.
- Zadoks JC, Chang TT, Konzak CF. A decimal code for the growth stages of cereals. Weed Research. 1974;14(6):415-421.
- Fokar M, Nguyen HT, Blum A. Heat tolerance in spring wheat. I. Estimating cellular thermotolerance and its heritability. Euphytica. 1998;104(1):1-8.
- Wahid A, Gelani S, Ashraf M, Foolad MR. Heat tolerance in plants: an overview. Environmental and Experimental Botany. 2007;61(3):199-223.
- Gupta NK, Agarwal S, Agarwal VP, Nathawat NS, Gupta S, Singh G. Effect of short-term heat stress on growth, physiology and antioxidative defence system in wheat seedlings. Acta Physiologiae Plantarum. 2013;35(6):1837-1842.
- Talukder ASMHM, McDonald GK, Gill GS. Effect of short-term heat stress prior to flowering and early grain set on the grain yield of wheat. Field Crops Research. 2014;160:54-63.
- Prasad PVV, Djanaguiraman M. Response of floret fertility and individual grain weight of wheat to high temperature stress: sensitive stages and thresholds for temperature and duration. Functional Plant Biology. 2014;41(12):1261-1269.
- Mishra V, Srivastava S, Tandon PK. Assessment of terminal heat tolerance ability of wheat genotypes based on physiological traits using multivariate analysis. Acta Physiologiae Plantarum. 2019;41(6):93.