
Research article · 2025 · Full text
International Journal of Agriculture and NutritionNematode community structure and its relationship to soil health in vegetable cropping systems
Volume 7(7) · Pages 255–258 · DOI: 10.33545/26646064.2025.v7.i7d.549 ↗
Research areasNematode management and characterization studiesSoil Carbon and Nitrogen DynamicsInsect-Plant Interactions and Control
Abstract
Author-writtenMuch like a physician reads a blood panel to gauge a patient’s internal condition, soil ecologists can read the nematode community to assess what is happening beneath the crop canopy long before visible symptoms emerge. This research characterised nematode assemblages under three vegetable management systems—continuous monoculture, two-year rotation, and rotation with a fallow phase—at 24 field sites near Hawassa, Ethiopia, between April 2022 and October 2023. From 192 composite soil samples collected over eight sampling rounds, a total of 41,260 nematodes were extracted, identified to genus, and assigned to trophic groups. Bacterivores made up 39-48% of total abundance across systems, while plant-parasitic nematodes peaked at 29.4% under monoculture and dropped to 11.8% under fallow rotation. The Maturity Index was 2.14 in monoculture versus 3.91 in fallow rotation. Structure Index followed the same gradient (28.7 vs 74.8). Soil organic carbon correlated most strongly with the Maturity Index (r = 0.84, p
Summary
Source-checkedPlain-language reading of the full paper, prepared with AI and checked against the text. Each point links to the authors' own words.
Why it matters
- Nematodes serve as highly responsive biological indicators of soil health because their community composition changes rapidly in response to environmental stress. View evidence ↗
- In the Hawassa zone of Ethiopia, smallholder farmers typically use continuous cropping for tomato, cabbage, and onion, while organic inputs are decreasing. View evidence ↗
- Despite reports of declining yields and increased pest pressure, there has been a lack of biological data to quantify the impact of cropping intensity on soil organisms in this region. View evidence ↗
The question
- The study aimed to compare nematode community profiles across three different management intensities and determine how these profiles relate to soil properties. View evidence ↗
What they did
- A total of 41,260 nematodes were extracted from 192 composite soil samples across eight sampling rounds and identified to the genus level. View evidence ↗
- Baseline soil characterization included measuring pH, organic carbon, total nitrogen, available phosphorus, and particle size distribution from soil cores at a depth of 0-20 cm. View evidence ↗
What they found
- Soil organic carbon showed a significant gradient, averaging 1.42% in monoculture, 1.93% in rotation, and 2.48% in fallow rotation. View evidence ↗
- Monoculture systems had the lowest Maturity Index (2.14), Structure Index (28.7), and Shannon diversity (1.82), but the highest Enrichment Index (71.3), Channel Index (44.2), and total abundance (496 per 100 g). View evidence ↗
- Fallow rotation resulted in significantly higher Maturity Index (3.91) and Structure Index (74.8) compared to monoculture (2.14 and 28.7, respectively). View evidence ↗
- Plant-parasitic nematodes showed a 3.6-fold seasonal increase, rising from 92 per 100 g in April to 334 in October. View evidence ↗
- Soil organic carbon was the strongest environmental driver of community health, correlating strongly with the Maturity Index (r = 0.84). View evidence ↗
What it means
- The authors recommend promoting crop rotation with periodic fallow to improve soil biological health within two to three seasons. View evidence ↗
- The study concludes that nematode indices are practical and low-cost tools for monitoring soil health in Ethiopian smallholder farming. View evidence ↗
- A limitation of the study was that nematode identification was only performed at the genus level; species-level resolution via DNA metabarcoding would provide more precise diagnostics. View evidence ↗
- The study duration was limited to 18 months, leaving it unclear if the benefits of fallow rotation continue to accumulate or eventually plateau. View evidence ↗
Visual summary
3 visualsIllustrations explain the paper; charts are replotted from the paper's own table values.
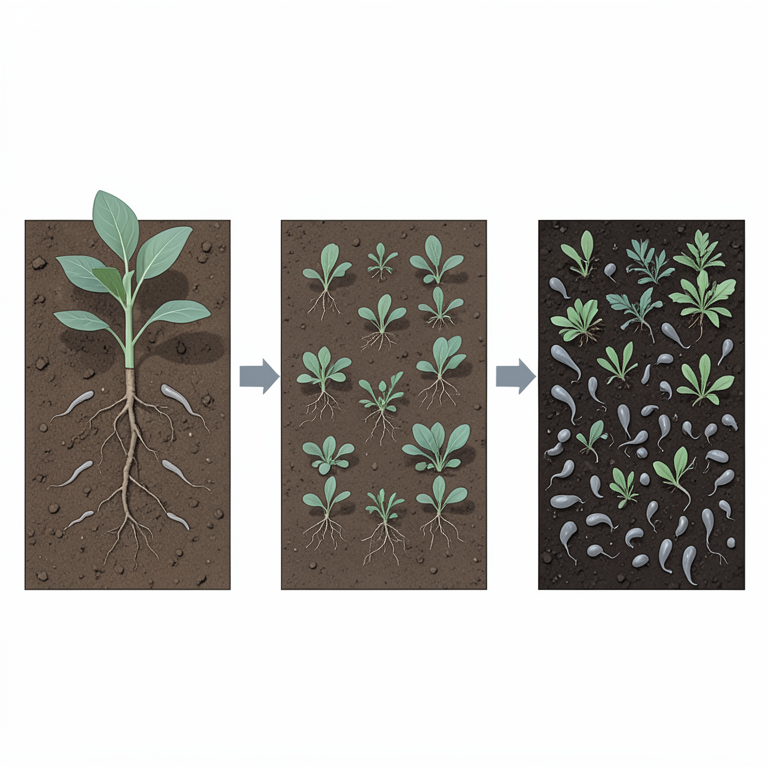
Comparison of Cropping Systems
AI-generated conceptual illustration (Soil profiles with vegetable crops and soil-dwelling nematodes). It explains the idea and does not show study data.
View source evidence ↗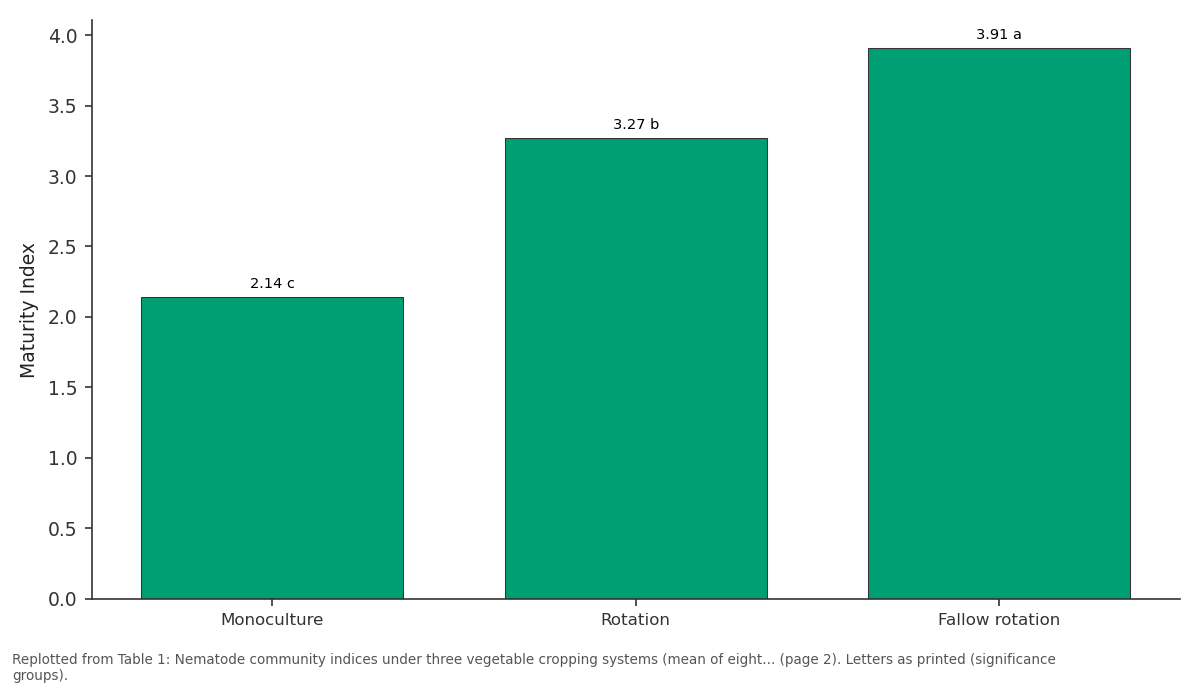
Maturity Index: Monoculture vs Rotation vs Fallow rotation
Replotted from Table 1 (page 2) of the original paper. Every bar is the paper's own table value.
View source evidence ↗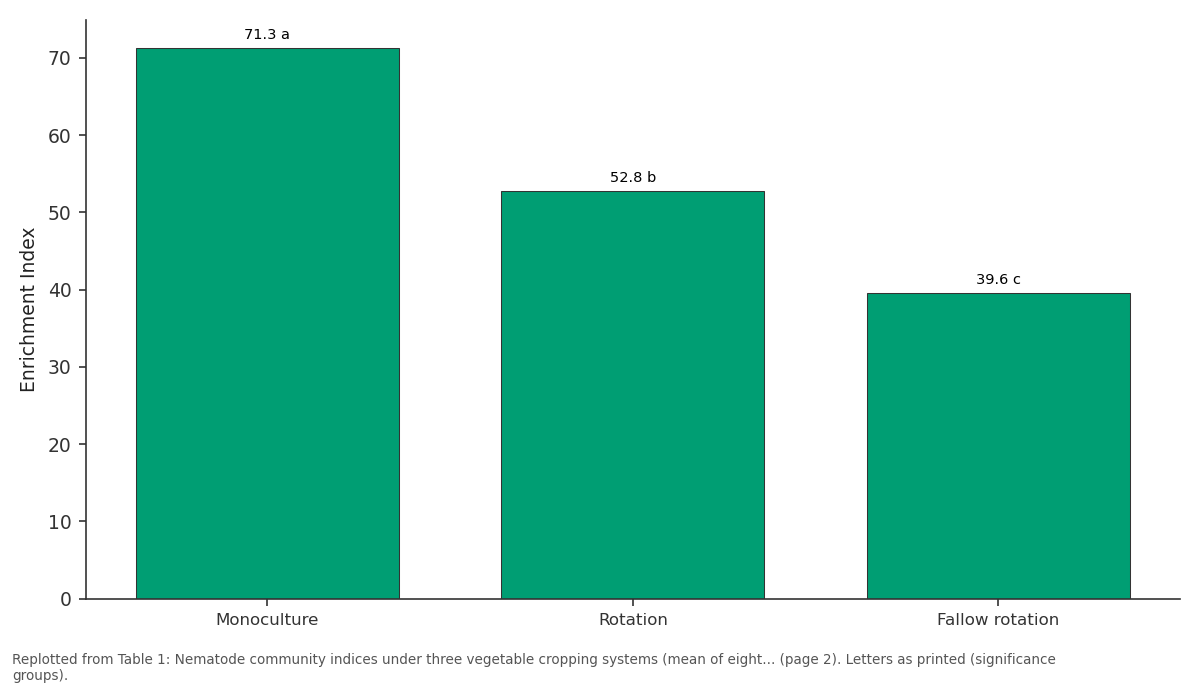
Enrichment Index: Monoculture vs Rotation vs Fallow rotation
Replotted from Table 1 (page 2) of the original paper. Every bar is the paper's own table value.
View source evidence ↗Figures & tables
From the original paper Table 1
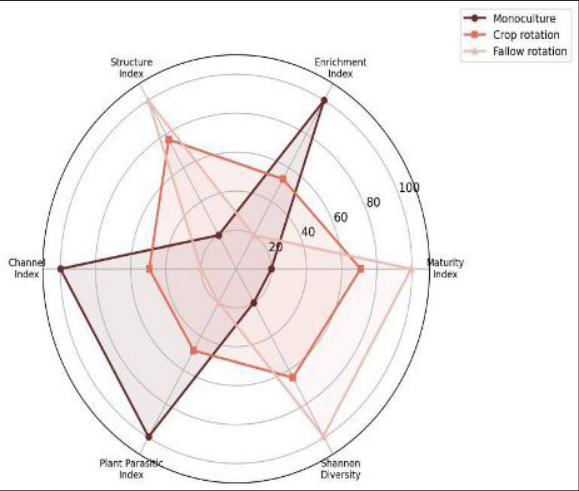 Figure 1
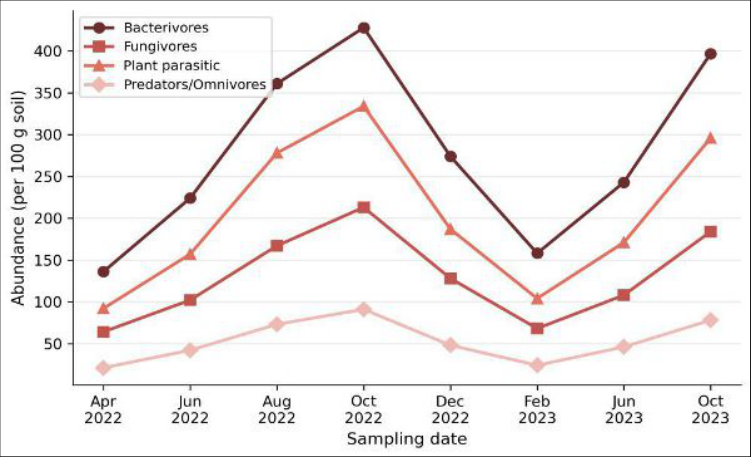 Figure 2
Introduction
An analogy borrowed from medicine fits surprisingly well here: nematodes are to soil what white blood cells are to the human body-their composition shifts quickly in response to stress, making them among the most responsive biological indicators available to field ecologists [1] . Soil nematodes span the entire food web, from bacterivores and fungivores that recycle nutrients through predators that regulate microbial grazers to plant-parasitic species that feed on living roots [2] . The relative proportions of these groups tell a clear story about below-ground health. Bongers introduced the Maturity Index (MI) in 1990 as a single-number summary of community disturbance, assigning each nematode genus a coloniser-persister (c-p) score ranging from 1 (fast-breeding opportunists) to 5 (slow-breeding, disturbance-sensitive taxa) [3] . Ferris and colleagues later added the Enrichment Index and Structure Index, which together locate a soil food web on a two-dimensional map from degraded to healthy [4] . These tools have been tested extensively in European, Asian, and American agriculture but remain almost untested in East African vegetable systems [5] . Ethiopia's Hawassa zone produces tomato, cabbage, and onion year-round on smallholder plots where continuous cropping is the norm and organic inputs are declining [6] . Farmers report falling yields and rising pest pressure, yet no biological monitoring data exist to quantify how cropping intensity affects soil organism communities. This research filled that gap by comparing nematode community profiles across three management intensities and linking them to measured soil properties.
Materials and Methods
Materials and Methods
Biodiversity Assessment
Nematodes were isolated from 200 g soil subsamples by a modified Baermann funnel method (48 h at 25 °C). Recovered specimens were heat-killed in a water bath at 60 °C, preserved in 4% formalin, and mounted on temporary glycerine slides. Genus-level identification was done under an Olympus BX43 compound microscope at 400-1000× following the keys of Bongers (1988) and Luc et al. (2005). Each individual was placed into one of five trophic groups: bacterivores (Ba), fungivores (Fu), plant parasitic (Pp), predators (Pr), and omnivores (Om). Community indices-Maturity Index, Enrichment Index (EI), Structure Index (SI), Channel Index (CI), Plant Parasitic Index (PPI), and Shannon diversity (H′)-were calculated using the NINJA online tool [7,8] .
Baseline Soil Characterisation
At the start of the research, soil cores (0-20 cm) from all 24 sites were analysed for pH (1:2.5 water), organic carbon (Walkley-Black), total nitrogen (Kjeldahl), available phosphorus (Olsen), and particle size distribution (hydrometer). Soils were clay loam to sandy clay loam with pH between 5.4 and 6.9. Organic carbon averaged 1.42% under monoculture, 1.93% under rotation, and 2.48% under fallow rotation-a statistically significant gradient (p<0.05). Total nitrogen followed the same pattern [9] .
Materials
The research was carried out under the Southern Nations Agricultural College, Hawassa, Ethiopia ( Twenty-four vegetable fields were sampled: eight under continuous tomato or cabbage monoculture (≥5 consecutive years), eight in a two-year rotation cycle (tomato-cabbageonion-haricot bean), and eight under rotation with oneseason grass fallow inserted every two years. Plot sizes ranged from 0.10 to 0.52 ha. Composite samples (eight soil cores pooled per field, 0-20 cm depth) were taken every six to eight weeks across eight collection dates spanning the long rains, short rains, and dry seasons [10] .
Methods
Nematode counts were expressed as individuals per 100 g oven-dry soil. Trophic composition was reported as percentage of total community abundance. Differences among the three cropping systems were tested with one-way ANOVA on each sampling date and on the pooled dataset. Pearson correlations linked nematode indices to soil physicochemical variables. A redundancy analysis (RDA) in CANOCO v5.0 ordinated community composition against environmental predictors. Shannon diversity (H′) was calculated as-Σ(pi × ln pi), where pi is the proportion of each genus. Significance was set at p<0.05 throughout [11] .
Results
Results
Comprehensive Interpretation
The radar chart (Figure 1) gives each system a distinct visual fingerprint: monoculture skews sharply toward high enrichment and low structure, while fallow rotation fills the opposite side of the diagram. Crop rotation sits between the two on every axis, suggesting an intermediate disturbance level. Seasonal abundance trends (Figure 2) show that all trophic groups peaked during October, at the close of the main rainy season when soil moisture and microbial biomass are highest. Plant-parasitic nematodes exhibited the steepest seasonal swing, rising from 92 per 100 g in April to 334 in October-a 3.6-fold increase that coincided with active root growth. In the RDA ordination, the first two axes explained 67.3% of variation, with organic carbon (r = 0.84 with MI) and available phosphorus (r = 0.71 with SI) emerging as the strongest environmental drivers.
Discussion
The Maturity Index of 2.14 under monoculture falls squarely in the "disturbed" category defined by Bongers and Ferris (1999), where opportunistic bacterivores dominate and higher-order predators are scarce [1,3] . The 3.91 recorded under fallow rotation is comparable to values from wellmanaged organic farms in the Netherlands and California, suggesting that even a simple one-season grass fallow can push the food web toward a healthier configuration within two to three cycles [4] . The elevated Channel Index in monoculture (44.2 versus 21.1 in fallow) signals a food web driven primarily by bacterial decomposition rather than fungal pathways. Bacterial-dominated webs cycle nutrients fast but build less persistent organic matter, a pattern linked to declining longterm soil resilience [2,4] . That organic carbon correlated so strongly with MI (r = 0.84) reinforces the practical message: building carbon through residue retention, compost, or fallow is the most direct lever for improving biological soil health.
One limitation is that identification stopped at genus level. Species-level resolution, achievable through DNA metabarcoding, would sharpen the diagnostic power of community analyses and potentially reveal cryptic functional differences among morphologically similar genera [5] . The research also covered only 18 months; longer monitoring would show whether the fallow benefit accumulates further or reaches a plateau.
Conclusion
Nematode community profiling clearly separated three vegetable management systems near Hawassa, Ethiopia, with Maturity Index ranging from 2.14 (monoculture) to 3.91 (fallow rotation) and Structure Index from 28.7 to 74.8. Plant-parasitic nematode proportions were 2.5 times higher under continuous cropping than under fallow rotation. Soil organic carbon was the single best predictor of community health (r = 0.84 with MI). These results confirm that nematode indices are practical, low-cost biological indicators suited to Ethiopian smallholder conditions. Extension programmes should consider promoting crop rotation with periodic fallow as a straightforward management change that measurably improves belowground biological condition within two to three seasons.
Figures and tables from the paper
| Index | Monoculture | Rotation | Fallow rotation | F-value | p-value |
|---|---|---|---|---|---|
| Maturity Index | 2.14 c | 3.27 b | 3.91 a | 34.7 | < 0.001 |
| Enrichment Index | 71.3 a | 52.8 b | 39.6 c | 28.3 | < 0.001 |
| Structure Index | 28.7 c | 61.4 b | 74.8 a | 41.2 | < 0.001 |
| Channel Index | 44.2 a | 29.6 b | 21.1 c | 22.8 | < 0.001 |
| Plant Parasitic Index | 3.64 a | 2.18 b | 1.37 c | 19.4 | < 0.001 |
| Shannon diversity (H′) | 1.82 c | 2.41 b | 2.87 a | 26.1 | < 0.001 |
| Total abundance (/100 g) | 496 a | 371 b | 284 c | 18.7 | < 0.01 |
Table text extracted from the original PDF; superscript letters are shown inline. The original table image is below.
View original table image
References
20 in the original paper- Bongers T, Ferris H. Nematode community structure as a bioindicator in environmental monitoring. Trends in Ecology and Evolution. 1999;14(6):224-228.
- Yeates GW, Bongers T, de Goede RGM, Freckman DW, Georgieva SS. Feeding habits in soil nematode families and genera: An outline for soil ecologists. Journal of Nematology. 1993;25(3):315-331.
- Bongers T. The maturity index: An ecological measure of environmental disturbance based on nematode species composition. Oecologia. 1990;83(1):14-19.
- Ferris H, Bongers T, de Goede RGM. A framework for soil food web diagnostics: Extension of the nematode faunal analysis concept. Applied Soil Ecology. 2001;18(1):13-29.
- Neher DA. Role of nematodes in soil health and their use as indicators. Journal of Nematology. 2001;33(4):161-168.
- CSA. Agricultural sample survey: Report on area and production of major crops. Central Statistical Agency, Ethiopia. 2023;1:1-128.
- Bongers T. De nematoden van Nederland. Koninklijke Nederlandse Natuurhistorische Vereniging. 1988;1:1408. International Journal of Agriculture and Nutrition https://www.agriculturejournal.net
- Sieriebriennikov B, Ferris H, de Goede RGM. NINJA: An automated calculation system for nematode-based biological monitoring. European Journal of Soil Biology. 2014;61:90-93.
- Walkley A, Black IA. An examination of the Degtjareff method for determining soil organic matter. Soil Science. 1934;37(1):29-38.
- Barker KR, Carter CC, Sasser JN. An advanced treatise on Meloidogyne: Volume II. Methodology. North Carolina State University. 1985;2:1-223.
- Ter Braak CJF, Smilauer P. Canoco reference manual and user's guide. Microcomputer Power. 2012;5:1-496.
- Luc M, Sikora RA, Bridge J. Plant parasitic nematodes in subtropical and tropical agriculture. CAB International. 2005;2(1):1-871.
- Wasilewska L. Soil invertebrates as bioindicators with special reference to soil-inhabiting nematodes. Russian Journal of Nematology. 1997;5(2):113-126.
- Freckman DW, Ettema CH. Assessing nematode communities in agroecosystems of varying human intervention. Agriculture Ecosystems and Environment. 1993;45(3-4):239-261.
- Berkelmans R, Ferris H, Tenuta M, van Bruggen AHC. Effects of long-term crop management on nematode trophic levels. Applied Soil Ecology. 2003;23(3):223235.
- Ettema CH, Bongers T. Characterization of nematode colonization and succession in disturbed soil using the maturity index. Biology and Fertility of Soils. 1993;16(2):79-85.
- Ingham RE, Trofymow JA, Ingham ER, Coleman DC. Interactions of bacteria, fungi, and their nematode grazers. Ecological Monographs. 1985;55(1):119-140.
- Villenave C, Bongers T, Ekschmitt K, Djigal D, Chotte JL. Changes in nematode communities following cultivation of soils after fallow periods. Applied Soil Ecology. 2001;17(1):43-52.
- Cadet P, Spaull VW. Nematode-sugarcane relationships in southern Africa. Sugar Cane International. 2005;23(3):11-16.
- DuPont ST, Ferris H, Van Horn M. Effects of cover crop quality on nematode-based soil food webs. Applied Soil Ecology. 2009;41(2):157-167.