
Research article · 2025 · Full text
International Journal of Agriculture and NutritionVariability and correlation studies in Ethiopian mustard for yield contributing traits
Volume 7(11) · Pages 123–126 · DOI: 10.33545/26646064.2025.v7.i11b.492 ↗
Research areasGenetics and Plant BreedingAgricultural Practices and Plant GeneticsAgricultural Productivity and Crop Improvement
Abstract
Author-writtenEthiopian mustard (Brassica carinata A. Braun) has drawn increasing interest as a dual-purpose crop for edible oil and industrial biofuel, yet its genetic improvement lags behind other Brassica species because variability patterns and trait relationships in available germplasm are poorly mapped. This research assessed genetic variability, heritability, correlation, and path coefficients for seven yield-related traits in 48 Ethiopian mustard genotypes evaluated at the Instituto de Ciencias Agrícolas de Andalucía, Córdoba, Spain, during rabi 2022-23. Seed yield per plant showed the highest genotypic coefficient of variation (GCV, 24.8%) and genetic advance as percentage of mean (42.8%). Siliquae per plant had the strongest genotypic correlation with seed yield (rg = 0.91) and the highest direct path effect (0.428). Heritability estimates were moderate to high (52.4-74.1%) for all traits except oil content. These findings indicate that selection for siliquae per plant and primary branches would be the most effective indirect route to improving seed yield in Ethiopian mustard breeding programmes.
Summary
Source-checkedPlain-language reading of the full paper, prepared with AI and checked against the text. Each point links to the authors' own words.
Why it matters
- Ethiopian mustard is increasingly valued as a crop that can provide both edible oil and industrial biofuel. View evidence ↗
- Genetic improvement of Ethiopian mustard has been slower than other Brassica species because the relationships between traits and variability patterns are not well understood. View evidence ↗
- The crop is particularly noted for its tolerance to heat and drought, resistance to blackleg disease, and oil suitable for bio-jet fuel. View evidence ↗
The question
- The study aimed to evaluate 48 Ethiopian mustard genotypes to determine which traits are most effective for the indirect selection of improved seed yield. View evidence ↗
What they did
- The experiment used an augmented block design featuring 36 test genotypes with three replications and four check varieties in each block. View evidence ↗
- Seven traits were measured on five random plants per genotype: plant height, primary branches, siliquae per plant, seeds per siliqua, 1000-seed weight, seed yield, and oil content (measured via NMR). View evidence ↗
What they found
- Seed yield exhibited the highest genotypic coefficient of variation (GCV) at 24.8% and the widest range, from 8.4 to 28.6 g/plant. View evidence ↗
- Oil content showed the least genetic variability, with the lowest GCV of 4.2%. View evidence ↗
- The highest genetic advance as a percentage of the mean was found in seed yield (42.8%) and siliquae per plant (38.6%). View evidence ↗
- Siliquae per plant was the strongest predictor of seed yield, showing the highest genotypic correlation (0.91) and the largest direct path effect (0.428). View evidence ↗
- Primary branches had the second-highest correlation with seed yield (0.82), though its direct effect (0.264) was only moderate. View evidence ↗
- There was no significant correlation between oil content and seed yield. View evidence ↗
- The six traits analyzed explained 81.6% of the total variation in seed yield, with a residual effect of 0.184. View evidence ↗
What it means
- The authors conclude that siliquae per plant should be the primary criterion for selection to improve seed yield. View evidence ↗
- The authors recommend including primary branches and 1000-seed weight in a selection index as they contribute indirectly to yield. View evidence ↗
Visual summary
3 visualsIllustrations explain the paper; charts are replotted from the paper's own table values.
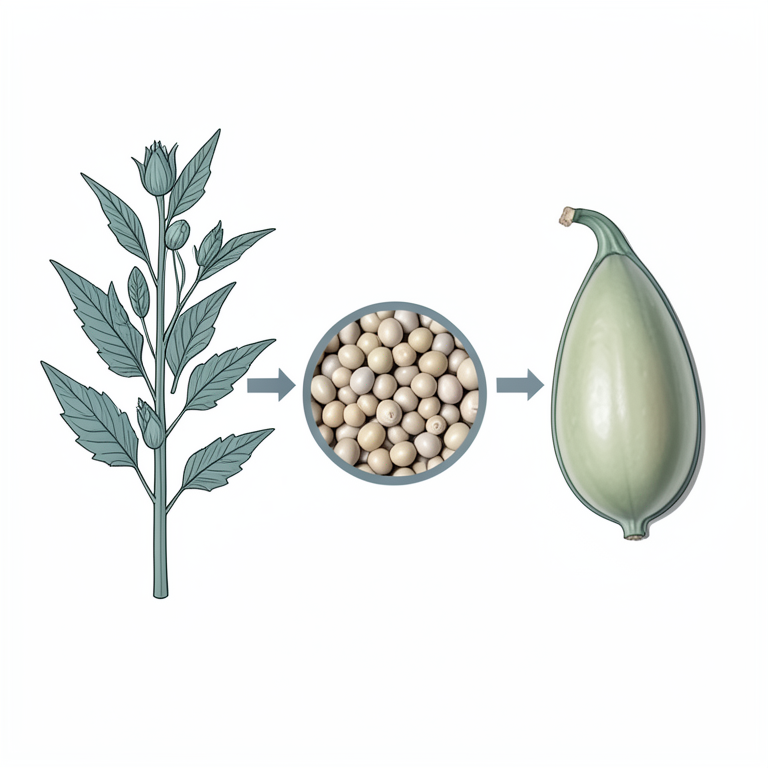
Trait Influence on Seed Yield
AI-generated conceptual illustration (Ethiopian mustard plants (Brassica juncea)). It explains the idea and does not show study data.
View source evidence ↗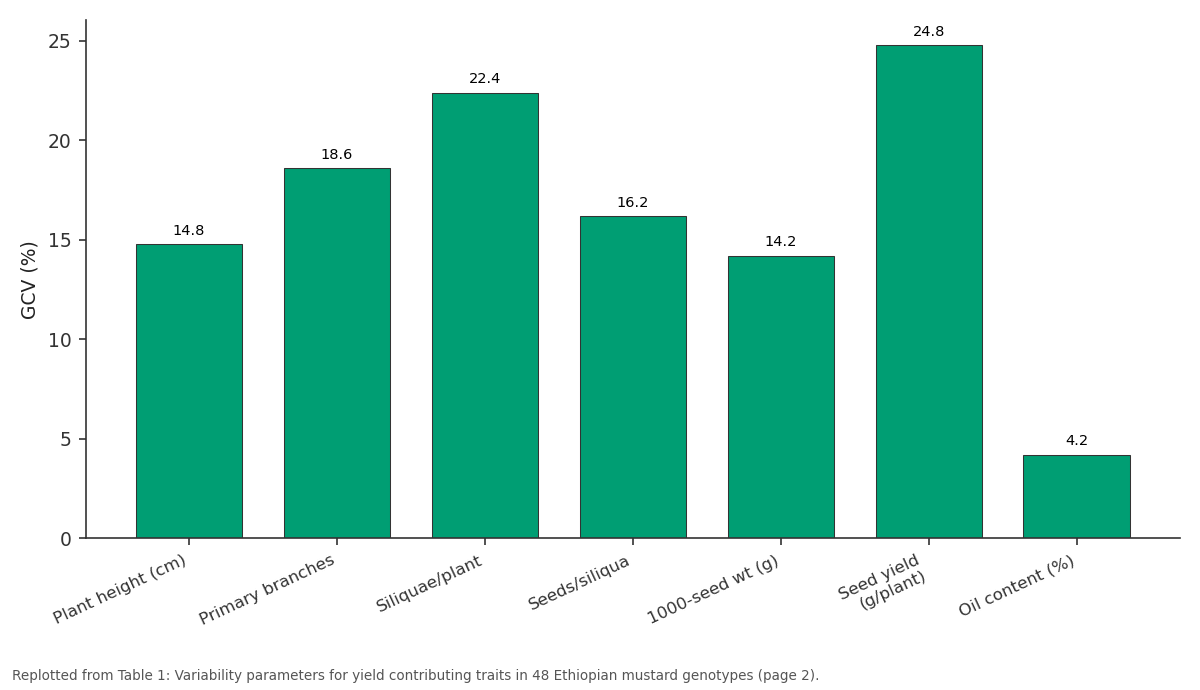
GCV (%): Plant height (cm) vs Primary branches vs Siliquae/plant vs Seeds/siliqua vs 1000-seed wt (g)
Replotted from Table 1 (page 2) of the original paper. Every bar is the paper's own table value.
View source evidence ↗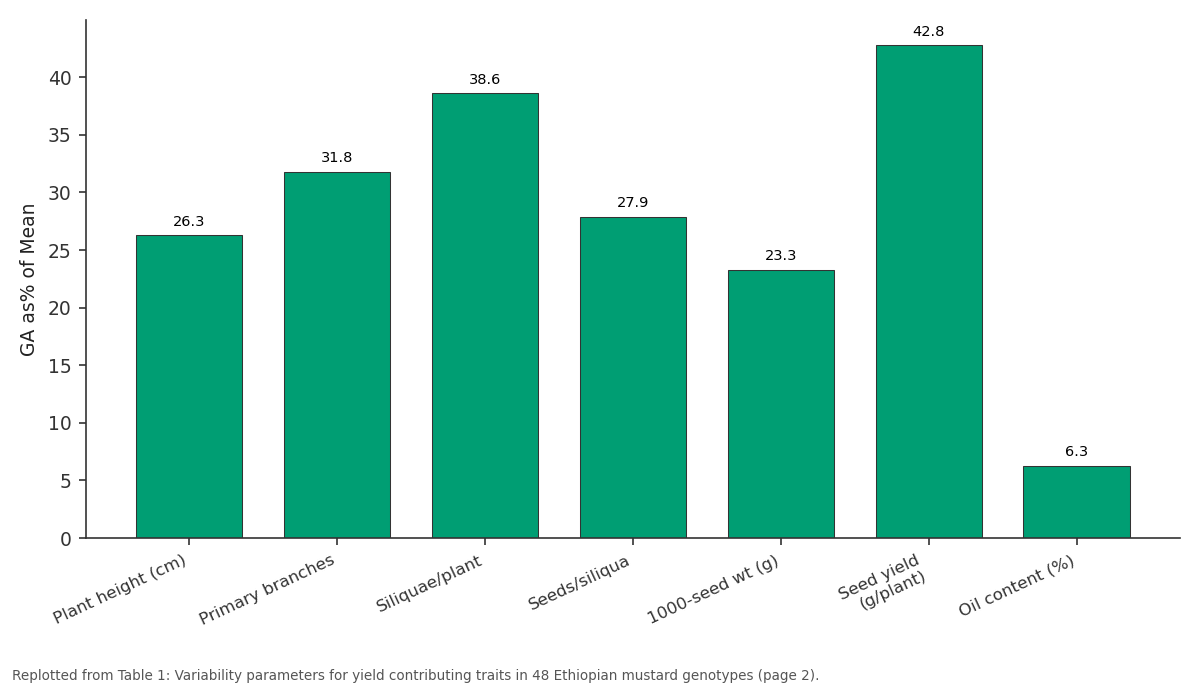
GA as% of Mean: Plant height (cm) vs Primary branches vs Siliquae/plant vs Seeds/siliqua vs 1000-seed wt (g)
Replotted from Table 1 (page 2) of the original paper. Every bar is the paper's own table value.
View source evidence ↗Figures & tables
From the original paper Table 1
 Table 2
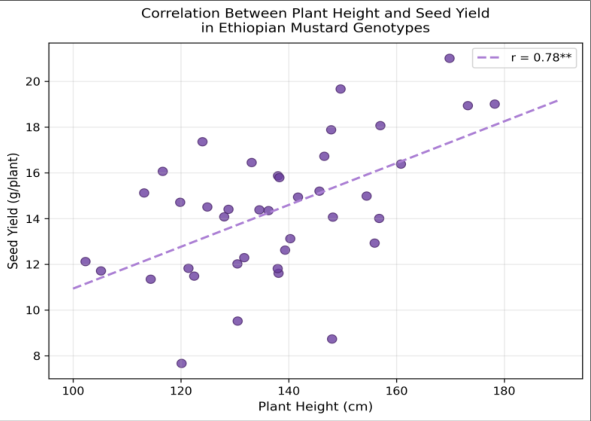 Figure 1
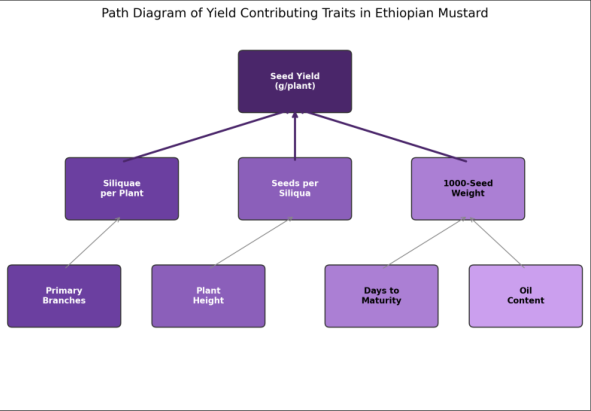 Figure 2
Introduction
Among the six cultivated Brassica species, Ethiopian mustard (B. carinata, 2n = 34, BBCC genome) is a relative latecomer to formal breeding research, despite its origin in the Ethiopian highlands where it has been a staple oilseed crop for centuries [1] . The species has attracted fresh attention because of its natural resistance to blackleg disease (Leptosphaeria maculans), heat and drought tolerance, and seed oil composition suitable for bio-jet fuel production [2] . But compared to rapeseed (B. napus) and Indian mustard (B. juncea), the available germplasm base of B. carinata remains narrowly characterized. Understanding genetic variability is the starting point for any breeding strategy. Parameters such as the genotypic and phenotypic coefficients of variation, heritability, and genetic advance indicate how much of the observed variation is heritable and how much gain can be expected from selection [3] . Correlation analysis reveals the direction and strength of trait associations, while path analysis partitions correlations into direct and indirect effects on yield, thereby guiding the choice of selection criteria [4] . This research aimed to estimate these parameters in a diverse set of 48 Ethiopian mustard genotypes to identify the traits most useful for indirect selection for seed yield improvement.
Theoretical Background
The partitioning of observed phenotypic variance into genotypic and environmental components follows the model Vp = Vg + Ve, where Vp, Vg, and Ve represent phenotypic, genotypic, and environmental variances respectively. Broad-sense heritability (h²) was estimated as h² = Vg/Vp × 100. Genetic advance (GA) under selection at 5% intensity was predicted as GA = k × σp × h², where k is the selection differential (2.06 for 5% selection intensity) and σp is the phenotypic standard deviation [3] . Path coefficient analysis followed the method of Dewey and Lu [5] , which decomposes the genotypic correlation of each trait with seed yield into a direct effect (path coefficient) and the sum of indirect effects through other traits. This framework allows breeders to distinguish traits whose correlation with yield is causal from those that are merely associated through linkage with a third variable.
Material and Methods Material
Forty-eight Ethiopian mustard genotypes sourced from the USDA-ARS germplasm collection, ICRISAT, and local Spanish accessions were evaluated during the rabi 2022-23 season at the experimental farm of Instituto de Ciencias Agrícolas de Andalucía, Córdoba, Spain (37.88° N, 4.77° W, elevation 106 m). The site has a Mediterranean climate with mild winters and hot dry summers. Soil is Vertisol with clay texture and pH 7.8. The trial was laid out in an augmented block design with three replications for 36 test genotypes and four check varieties replicated in each block. Each genotype was sown in three rows of 3 m length at 30 × 10 cm spacing [6] .
Methods
Observations were recorded on five randomly selected competitive plants per genotype per replication for plant height, primary branches per plant, siliquae per plant, seeds per siliqua, 1000-seed weight, seed yield per plant, and oil content (by NMR, Oxford Instruments MQC-5). Genotypic and phenotypic variances, GCV, PCV, heritability, and genetic advance were estimated following Singh and Chaudhary [3] . Genotypic (rg) and phenotypic (rp) correlation coefficients were computed from variancecovariance components. Path analysis was done using seed yield as the dependent variable and remaining traits as independent variables [5] . Statistical computations were carried out in INDOSTAT version 9.2 and R version 4.3.1. Seed yield showed the widest range (8.4-28.6 g/plant) and highest GCV (24.8%), followed by siliquae per plant (22.4%) (Table 1). Oil content had the lowest GCV at 4.2%. Heritability was highest for plant height (74.1%) and lowest for oil content (52.4%). Genetic advance as percentage of mean was greatest for seed yield (42.8%) and siliquae per plant (38.6%). Siliquae per plant had the highest genotypic correlation with seed yield (0.91**) and the largest direct path effect (0.428) (Table 2). Primary branches showed the second-highest correlation (0.82**) but a moderate direct effect (0.264), indicating its influence on yield is partly mediated through siliquae number. Oil content was not significantly correlated with seed yield.
| Trait | Seed Yield (rg) | Seed Yield (rp) | Direct Effect | Indirect Effect |
|---|---|---|---|---|
| Plant height | 0.78** | 0.64** | 0.182 | 0.598 |
| Primary branches | 0.82** | 0.71** | 0.264 | 0.556 |
| Siliquae/plant | 0.91** | 0.84** | 0.428 | 0.482 |
| Seeds/siliqua | 0.74** | 0.62** | 0.186 | 0.554 |
| 1000-seed weight | 0.68** | 0.58** | 0.212 | 0.468 |
| Oil content | 0.24 NS | 0.18 NS | 0.042 | 0.198 |
Table text extracted from the original PDF; superscript letters are shown inline. The original table image is below.
View original table image
| Trait | Range | Mean | GCV (%) | PCV (%) | h² (%) | GA as% of Mean |
|---|---|---|---|---|---|---|
| Plant height (cm) | 108-184 | 142.6 | 14.8 | 17.2 | 74.1 | 26.3 |
| Primary branches | 4.2-9.8 | 6.84 | 18.6 | 22.4 | 68.8 | 31.8 |
| Siliquae/plant | 84-248 | 156.3 | 22.4 | 26.8 | 69.8 | 38.6 |
| Seeds/siliqua | 12-24 | 17.8 | 16.2 | 19.4 | 69.7 | 27.9 |
| 1000-seed wt (g) | 2.8-5.4 | 4.12 | 14.2 | 17.8 | 63.6 | 23.3 |
| Seed yield (g/plant) | 8.4-28.6 | 16.42 | 24.8 | 29.6 | 70.2 | 42.8 |
| Oil content (%) | 38.2-44.6 | 41.3 | 4.2 | 5.8 | 52.4 | 6.3 |
Table text extracted from the original PDF; superscript letters are shown inline. The original table image is below.
View original table image
Results
Results
Comprehensive Interpretation
The combination of high GCV, high heritability, and high genetic advance for seed yield and siliquae per plant indicates that additive gene action governs these traits and that direct phenotypic selection would be effective. The residual effect of the path model was 0.184, meaning the six traits accounted for 81.6% of the total variation in seed yield.
Discussion
The high GCV and heritability observed for seed yield and siliquae per plant are consistent with reports from Ethiopian and Indian germplasm collections of B. carinata and confirm that the species retains ample exploitable variation for improvement [1,6] . The dominance of siliquae per plant in both correlation and path analyses matches findings in related species (B. juncea, B. napus), where reproductive sink capacity is typically the primary yield determinant [4] . That oil content showed low GCV and non-significant correlation with seed yield is a practical advantage, as it implies breeders can select for higher yield without inadvertently reducing oil concentration [2] . The moderate heritability of 1000-seed weight (63.6%) and its positive but indirect contribution to yield suggest that seed size improvement could be a useful secondary selection target, particularly if combined with selection for siliquae number. From a breeding standpoint, index selection incorporating siliquae per plant, primary branches, and 1000-seed weight should deliver the fastest yield gains in this germplasm pool [3] .
Conclusion
Among the 48 Ethiopian mustard genotypes evaluated, seed yield and siliquae per plant exhibited the highest genetic variability, heritability, and genetic advance. Siliquae per plant had the strongest direct effect on yield in path analysis and should be the primary selection criterion. Primary branches and 1000-seed weight contribute indirectly and may be included in a selection index. Oil content appears to be independently controlled and unlikely to change as a correlated response to yield selection. These findings provide a quantitative foundation for trait-based selection in Ethiopian mustard breeding programmes aimed at improving seed yield without compromising oil quality.
Acknowledgement
Acknowledgements Funding SourcesSupported by internal research funds of Instituto de Ciencias Agrícolas de Andalucía. Institutional SupportThe authors thank the Instituto for field and laboratory facilities. Contributions Not Qualifying for AuthorshipTechnicians in the genetics laboratory are acknowledged for NMR oil analysis support.
Figures and tables from the paper
References
15 in the original paper- Getinet A, Rakow G, Raney JP. Agronomic performance and seed quality of Ethiopian mustard in Saskatchewan. Canadian Journal of Plant Science. 1996;76(3):387-392.
- Taylor DC, Falk KC, Palmer CD. Brassica carinata: a new molecular farming platform for delivering bioindustrial oil feedstocks. Biocatalysis and Agricultural Biotechnology. 2010;1:44-56.
- Singh RK, Chaudhary BD. Biometrical methods in quantitative genetic analysis. Kalyani Publishers. 1985;3:1-318.
- Dewey DR, Lu KH. A correlation and path-coefficient analysis of components of crested wheatgrass seed production. Agronomy Journal. 1959;51(9):515-518.
- Wright S. Correlation and causation. Journal of Agricultural Research. 1921;20(7):557-585.
- Warwick SI, Gugel RK, McDonald T. Genetic variation of Ethiopian mustard from Ethiopian gene centres. Genetic Resources and Crop Evolution. 2006;53(3):507-517.
- Lal M, Singh D, Bagati S. Correlation and path analysis in Ethiopian mustard. Journal of Oilseed Brassica. 2017;8(2):168-175.
- Teklewold A, Becker HC. Comparison of phenotypic and molecular distances to predict heterosis and F1 performance. Theoretical and Applied Genetics. 2006;112(4):752-759.
- Yared S, Misteru T, Bulti T. Variability of Ethiopian mustard genotypes for yield related traits. Ethiopian Journal of Science. 2018;41(1):1-14.
- Burton GW, Devane EH. Estimating heritability in tall fescue from replicated clonal material. Agronomy Journal. 1953;45(10):478-481.
- Johnson HW, Robinson HF, Comstock RE. Estimates of genetic and environmental variability in soybeans. Agronomy Journal. 1955;47(7):314-318.
- Cardone M, Mazzoncini M, Menini S. Brassica carinata as an alternative oil crop for the production of biodiesel. Bioresource Technology. 2003;88(1):75-77.
- Falconer DS, Mackay TFC. Introduction to quantitative genetics. Longman Scientific and Technical. 1996;4:1464.
- Panse VG, Sukhatme PV. Statistical methods for agricultural workers. ICAR, New Delhi. 1985;4:1-347.
- Robertson A. The sampling variance of the genetic correlation coefficient. Biometrics. 1959;15(3):469485.