
Research article · 2025 · Full text
International Journal of Agriculture and NutritionAssessment of genetic purity in hybrid rice seeds using grow-out test and DNA markers
Volume 7(12) · Pages 164–167 · DOI: 10.33545/26646064.2025.v7.i12c.566 ↗
Research areasGenetic Mapping and Diversity in Plants and AnimalsRice Cultivation and Yield ImprovementGenetics and Plant Breeding
Abstract
Author-writtenIn West Africa’s rapidly expanding hybrid rice sector, seed purity is the gatekeeper between a productive crop and a field of off-types that disappoint farmers and erode trust in the seed system. This research compared two methods for assessing genetic purity — the conventional grow-out test (GOT) and SSR DNA markers — across five commercial hybrid rice entries (KRH-4, DRRH-3, PA 6201, PHB 71, 27P31) produced at Calabar, Nigeria, during 2022–23. GOT purity ranged from 93.1% to 97.6%, while DNA-marker purity ranged from 94.6% to 98.2%. The two methods showed strong positive correlation (r = 0.94, p = 0.017), but DNA markers consistently detected 1.0–1.5% more off-types than GOT, likely because molecular assays identify heterozygous loci invisible to visual phenotyping. Three SSR markers (RM164, RM206, RM263) correctly distinguished all five hybrids from their parental lines in a single multiplex PCR reaction. These results support integrating DNA-marker testing alongside GOT in Nigerian seed certification to improve detection accuracy and reduce the time from harvest to market release.
Summary
Source-checkedPlain-language reading of the full paper, prepared with AI and checked against the text. Each point links to the authors' own words.
Why it matters
- Nigeria aims to reduce its annual rice import bill of over $2 billion by increasing domestic production, utilizing hybrid rice which offers a 15–25% yield advantage over inbred varieties. View evidence ↗
- Hybrid seeds generally require a purity standard of 95% or higher, as contamination of just 3–4% with off-types can reduce field uniformity and diminish farmer trust. View evidence ↗
- The conventional grow-out test (GOT) is the long-standing standard for purity assessment, but it is slow, taking a full growing season, and can be subjective due to overlapping morphological traits. View evidence ↗
The question
- The study aimed to compare the accuracy and practical feasibility of the grow-out test versus DNA markers using five hybrid rice seed lots produced in Calabar, Nigeria. View evidence ↗
What they did
- The researchers tested five commercially available hybrid rice seed lots in Nigeria: KRH-4, DRRH-3, PA 6201, PHB 71, and 27P31. View evidence ↗
- For the grow-out test, 400 seeds from each lot were planted in irrigated field plots in Calabar during the 2023 dry season. View evidence ↗
- DNA testing involved germinating 100 seeds per lot at 28 °C and collecting leaf tissue from seedlings that were 14 days old. View evidence ↗
- Out of twenty screened SSR markers across 12 chromosomes, three (RM164, RM206, and RM263) were selected for multiplex PCR because they showed clear polymorphism between hybrids and parents. View evidence ↗
What they found
- Genetic purity estimates ranged from 93.1% to 97.6% using the grow-out test and from 94.6% to 98.2% using DNA markers. View evidence ↗
- There was a strong positive correlation (r = 0.94, p = 0.017) between the methods, though DNA markers consistently returned higher purity values, with a mean difference of +1.1 percentage points. View evidence ↗
- For the PHB 71 lot, the grow-out test rated purity at 93.1% (below the 95% NASC threshold), whereas DNA markers rated it at 94.6%. View evidence ↗
- DNA testing provided results within 48 hours of tissue sampling, significantly faster than the 90–120 days required for the grow-out test. View evidence ↗
- The multiplex PCR method cost approximately ₦2,400 (about $3 USD) per sample, which is much lower than the cost of a full-season grow-out test plot. View evidence ↗
What it means
- The authors recommend that Nigerian seed policy adopt DNA-marker results as a complementary or confirmatory tool to the grow-out test, similar to practices in India and the Philippines. View evidence ↗
- Integrating DNA-marker testing into certification is supported to speed up seed release and prevent the false rejection of lots that are marginally pure. View evidence ↗
Visual summary
2 visualsIllustrations explain the paper; charts are replotted from the paper's own table values.
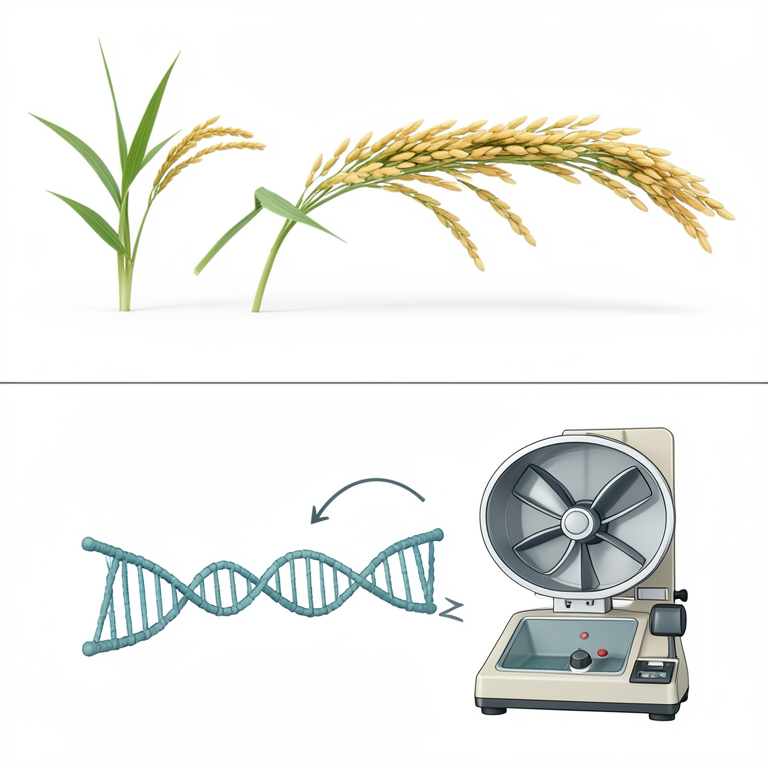
Timeline Comparison
AI-generated conceptual illustration (hybrid rice plants and DNA double helix). It explains the idea and does not show study data.
View source evidence ↗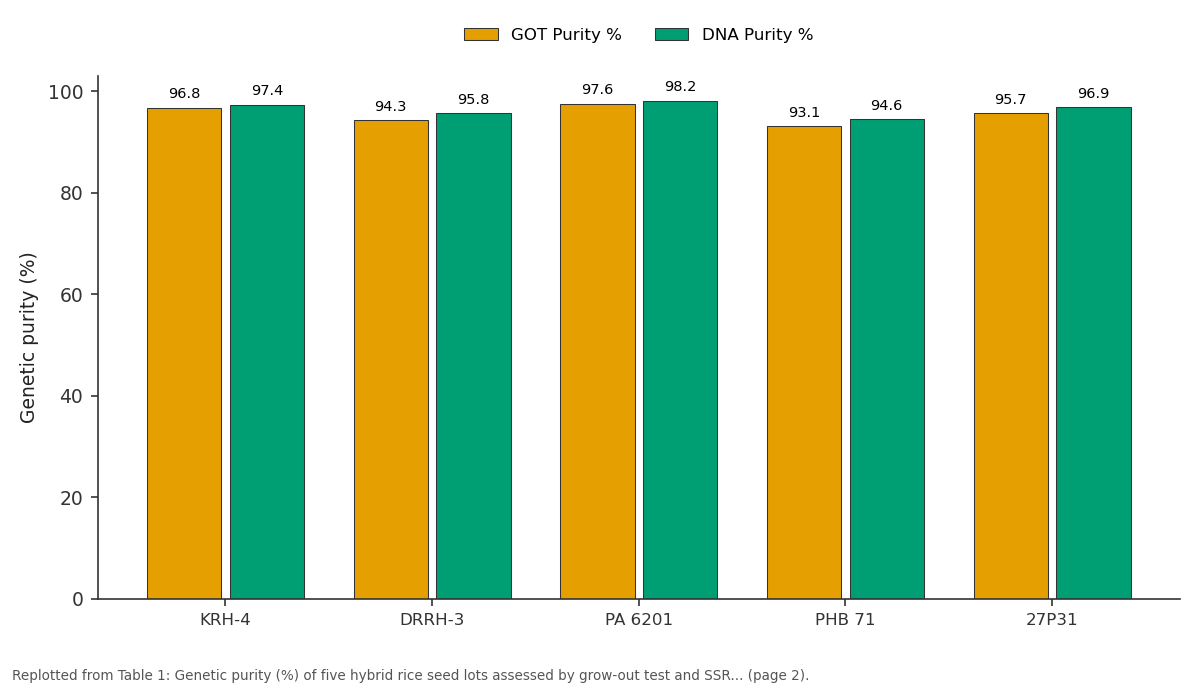
GOT Purity % and DNA Purity %: KRH-4 vs DRRH-3 vs PA 6201 vs PHB 71 vs 27P31
Replotted from Table 1 (page 2) of the original paper. Every bar is the paper's own table value.
View source evidence ↗Figures & tables
From the original paper Table 1
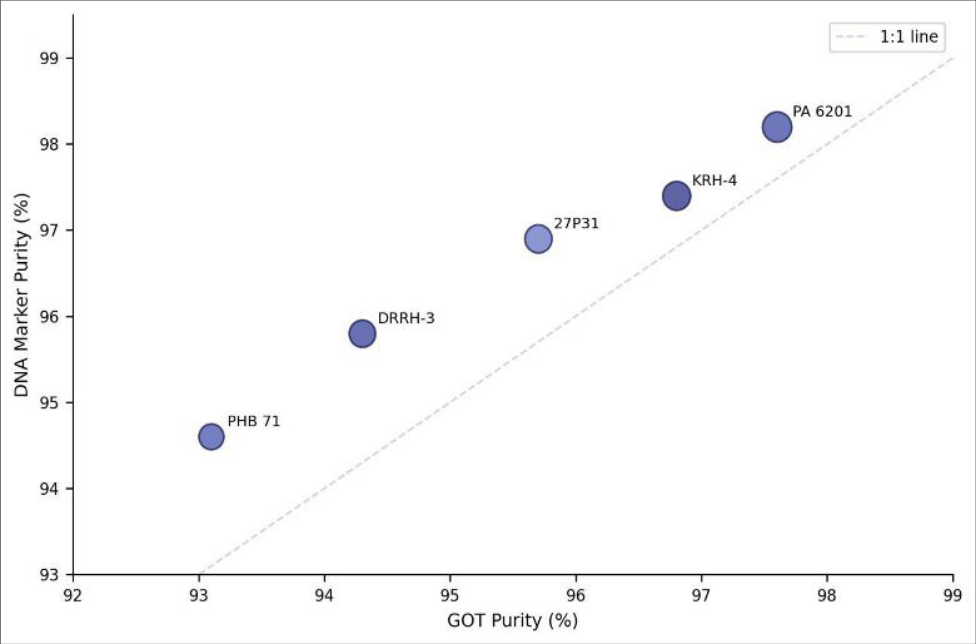 Figure 1
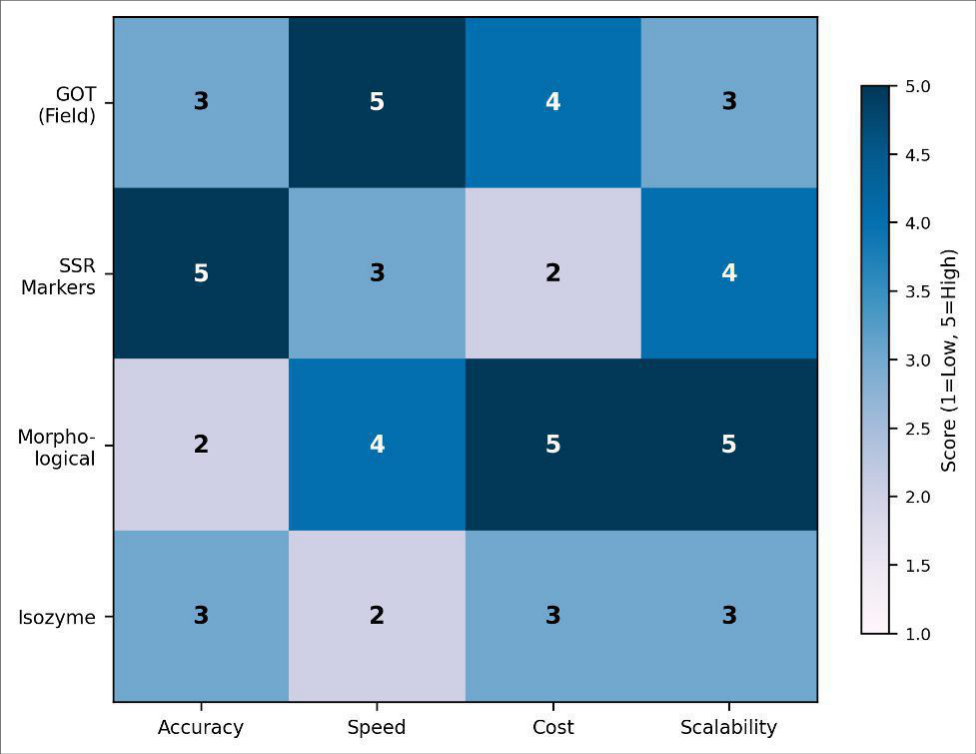 Figure 2
Introduction
Nigeria's rice import bill exceeds $2 billion annually, a figure the government has been trying to cut by boosting domestic production [1] . Hybrid rice, with its 15-25% yield advantage over inbred varieties, is a key part of that strategy. But hybrid seed must meet strict purity standards typically ≥95% in most certification systemsbecause even a 3-4% contamination with off-types can visibly reduce field uniformity and shake farmer confidence in the technology [2] . The grow-out test has been the standard method for assessing genetic purity since the 1960s. It involves planting a sample of 400 seeds, raising them to maturity, and visually scoring morphological off-types [3] . GOT is reliable but slow (it takes an entire growing season) and subjective for traits like plant height and panicle shape that overlap between hybrids and contaminants [4] . DNA-based markersparticularly SSR (simple sequence repeat) markers offer a faster, more objective alternative. A single SSR assay can distinguish a hybrid from its parental inbred lines in a few hours, and multiplex PCR allows several markers to be run simultaneously [5] . Despite these advantages, many African seed certification agencies still rely exclusively on GOT, partly because molecular laboratory infrastructure is limited and partly because regulatory frameworks haven't been updated to accept DNA results [6] . This research compared the two methods head-to-head on five hybrid rice seed lots produced in Calabar, Cross River State, to generate local evidence on their relative accuracy and practical feasibility for Nigerian conditions.
Quality Assurance Protocol
All seed lots were produced under the supervision of Nigeria's National Agricultural Seeds Council (NASC) during the 2022 wet season. Foundation seed of parental lines was sourced from certified stocks. Isolation distance (≥200 m), synchronisation of flowering, and supplemental pollination by rope-pulling were maintained per NASC hybrid rice seed-.
stored at 12% moisture in a cool, dry warehouse at Cross River University of Agriculture before testing.
Materials and Methods
Materials and Methods
Materials
Five hybrid rice seed lots were tested: KRH-4, DRRH-3, PA 6201, PHB 71, and 27P31, representing both public and private-sector hybrids commercially available in Nigeria. For GOT, 400 seeds per lot were sown in field plots at the university farm, Calabar (4°57′N, 8°21′E; 37 m elevation), during the 2023 dry season under irrigated conditions. For DNA testing, 100 seeds per lot were individually germinated on moist blotter in a growth chamber at 28 °C; leaf tissue was collected from 14-day-old seedlings.
Methods
GOT: Each plant was visually assessed at heading for seven morphological descriptors (plant height, flag-leaf angle, panicle type, awn presence, hull colour, grain shape, maturity). Plants deviating in two or more descriptors were scored as off-types [3] . Genetic purity = [(total plantsofftypes) / total plants] × 100. DNA testing: Genomic DNA was extracted using a CTAB mini-prep [8] . Twenty SSR markers distributed across all 12 rice chromosomes were screened; three (RM164, RM206, RM263) that showed clear polymorphism between each hybrid and its parental lines were selected for multiplex PCR. Amplification products were resolved on 6% polyacrylamide gels stained with silver nitrate. Seeds producing a non-hybrid banding pattern were scored as off-types. Purity estimates from GOT and DNA markers were compared by paired t-test and Pearson correlation. Comprehensive Interpretation DNA markers consistently returned higher purity values than GOT (mean +1.1 percentage points), a seemingly paradoxical result that arises because GOT classifies borderline phenotypes conservatively as off-types, while DNA testing identifies some of these as true hybrids carrying alleles from both parents. In one case (PHB 71), GOT rated the lot at 93.1% below the NASC 95% threshold while DNA markers placed it at 94.6%, still marginal. This discrepancy underscores the risk of false rejection under GOT alone, which can waste costly hybrid seed.
Results
Results
Discussion
The strong correlation (r = 0.94) between GOT and DNA purity confirms that the two methods rank seed lots in the same order, consistent with findings by Yashitola et al. [5] in Indian hybrid rice. But the consistent 1-1.5% offset suggests that GOT misclassifies some true hybrids as off-types when phenotypic expression is subtle for example, when a hybrid plant is slightly shorter than the population mean due to environmental stress rather than genetic contamination [4] . The practical advantage of DNA testing is speed: from tissue sampling to result in 48 hours, versus 90-120 days for GOT. For seed companies aiming to release fresh hybrid seed before the planting window, that time saving translates directly into market opportunity and cash-flow improvement [9] . The multiplex PCR approach used here costs roughly ₦2,400 per sample (≈ $3 USD), a fraction of the cost of running a full-season GOT field plot.
Nigerian seed policy should consider accepting DNAmarker results as a complementary or confirmatory tool alongside GOT, as India and the Philippines have already done [6] . Establishing multiplex PCR capacity at NASC regional laboratories would be a modest investment with large returns in certification speed and accuracy.
Conclusion
SSR DNA markers detected 1.0-1.5% more genetic purity than the conventional grow-out test in five hybrid rice seed lots, with a strong positive correlation between the two methods. Three SSR markers (RM164, RM206, RM263) in a single multiplex PCR reaction distinguished all hybrids from their parents within 48 hours, compared to 90-120 days for GOT. These findings support integrating DNAmarker testing into Nigerian seed certification to accelerate hybrid rice seed release and reduce false-rejection of marginally pure lots.
Figures and tables from the paper
| Hybrid | GOT Purity % | DNA Purity % | Difference (DNA–GOT) | NASC Standard |
|---|---|---|---|---|
| KRH-4 | 96.8 | 97.4 | +0.6 | Pass |
| DRRH-3 | 94.3 | 95.8 | +1.5 | Pass |
| PA 6201 | 97.6 | 98.2 | +0.6 | Pass |
| PHB 71 | 93.1 | 94.6 | +1.5 | Marginal |
| 27P31 | 95.7 | 96.9 | +1.2 | Pass |
Table text extracted from the original PDF; superscript letters are shown inline. The original table image is below.
View original table image
References
16 in the original paper- USDA-FAS. Nigeria grain and feed annual report 2023. Washington DC: United States Department of Agriculture; 2023. p. 1-14.
- Virmani SS. Hybrid rice breeding manual. Los Baños: International Rice Research Institute; 1997. p. 1-155.
- OECD. Grow-out test procedures for seed certification. Paris: OECD Seed Schemes; 2019. p. 1-28.
- Sundaram RM, Naveenkumar B, Biradar SK, Balachandran SM, Mishra B, Ilyas Ahmed M, Viraktamath BC, Ramesha MS, Sarma NP. Identification of informative SSR markers capable of distinguishing hybrid rice parental lines and their utilization in seed purity assessment. Euphytica. 2008;163(2):215-224.
- Yashitola J, Thirumurugan T, Sundaram RM, Naseerullah MK, Ramesha MS, Sarma NP, Sonti RV. Assessment of purity of rice hybrids using microsatellite and STS markers. Crop Science. 2002;42(4):1369-1373.
- Nandakumar N, Singh AK, Sharma RK, Mohapatra T, Prabhu KV, Zaman FU. Molecular fingerprinting of hybrids and assessment of genetic purity of hybrid seeds in rice using microsatellite markers. Euphytica. 2004;136(3):257-264.
- NASC. Guidelines for hybrid rice seed production in Nigeria. Abuja: National Agricultural Seeds Council; 2021. p. 1-24.
- Murray MG, Thompson WF. Rapid isolation of high molecular weight plant DNA. Nucleic Acids Research. 1980;8(19):4321-4326.
- Pallavi HM, Rame Gowda, Shadakshari YG, Bhanuprakash K, Vishwanath K. Identification of SSR markers for hybridity and seed genetic purity testing in sunflower. Helia. 2011;34(54):59-66.
- Temnykh S, Park WD, Ayres N, Cartinhour S, Hauck N, Lipovich L, Cho YG, Ishii T, McCouch SR. Mapping and genome organization of microsatellite sequences in rice. Theoretical and Applied Genetics. 2000;100(5):697-712.
- McCouch SR, Teytelman L, Xu Y, Lobos KB, Clare K, Walton M, Fu B, Maghirang R, Li Z, Xing Y, Zhang Q. Development and mapping of 2240 new SSR markers for rice. DNA Research. 2002;9(6):199-207.
- Antonova TS, Guchetl SZ, Tchelustnikova TA, Ramasamy A. Assessment of genetic purity of sunflower hybrids using SSR markers. Helia. 2006;29(44):151-156.
- Asante MD, Offei SK, Gracen V, Adu-Dapaah H, Danquah EY, Bryant R, McClung A. Starch physicochemical properties of rice accessions and their association with molecular markers. Starch. 2013;65(11-12):1022-1028.
- Miah G, Rafii MY, Ismail MR, Puteh AB, Rahim HA, Islam K, Latif MA. A review of microsatellite markers and their applications in rice breeding programs to improve blast disease resistance. International Journal of Molecular Sciences. 2013;14(11):22499-22528.
- Bora A, Choudhury PR, Pande V, Mandal AB. Assessment of genetic purity in rice hybrid using microsatellite markers. African Journal of Biotechnology. 2016;15(25):1288-1293.
- Hashemi SH, Mirmohammadi-Maibody SAM, Nematzadeh GA, Arzani A. Identification of rice hybrids using microsatellite and RAPD markers. African Journal of Biotechnology. 2009;8(10):20942101.