
Research article · 2025 · Full text
International Journal of Agriculture and NutritionEnergy budgeting and carbon footprint of different tillage-based crop production systems
Volume 7(5) · Pages 91–94 · DOI: 10.33545/26646064.2025.v7.i5b.558 ↗
Research areasEnergy, Environment, Agriculture AnalysisSoil Management and Crop YieldSustainable Agricultural Systems Analysis
Abstract
Author-writtenLeading soil scientists have argued that shifting tillage practices could be the single most cost-effective strategy for reducing agriculture’s carbon footprint. This research quantified energy inputs, outputs, and greenhouse gas emissions across four tillage systems—conventional (CT), reduced (RT), minimum (MT), and zero tillage (ZT)—in a rice-wheat rotation at Mahatma Phule Krishi Vidyapeeth, Rahuri, Maharashtra, India, over three years (2021–24). A randomized block design with four treatments and four replications was used. Energy input decreased progressively from CT (18.4 GJ ha⁻¹) to ZT (8.6 GJ ha⁻¹), a 53.3% reduction. Energy use efficiency improved from 2.33 (CT) to 4.43 (ZT). Total carbon footprint declined from 1,271.9 kg CO₂-eq ha⁻¹ (CT) to 735.5 kg CO₂-eq ha⁻¹ (ZT), mainly due to lower diesel consumption and elimination of residue burning. Grain yield under ZT was 6.8% lower than CT in the first year but the gap narrowed to 3.1% by year three. A composite sustainability index combining energy efficiency, carbon footprint, and yield ranked ZT first, followed by MT, RT, and CT.
Summary
Source-checkedPlain-language reading of the full paper, prepared with AI and checked against the text. Each point links to the authors' own words.
Why it matters
- Changing tillage practices is considered by soil scientists to be one of the most cost-effective ways to lower the carbon footprint of agriculture. View evidence ↗
- Conventional farming in India's rice-wheat belt is energy-intensive and produces high carbon emissions due to moldboard plowing, multiple harrowing, and straw burning. View evidence ↗
- There is a lack of documentation regarding the energy and carbon impacts of conservation tillage specifically within the semi-arid conditions of Maharashtra. View evidence ↗
The question
- The study aimed to create energy and carbon budgets for four tillage systems in Maharashtra over three years and develop a composite sustainability index. View evidence ↗
What they did
- The experiment used a randomized block design with four replications, with each plot measuring 10 m by 8 m. View evidence ↗
- Tillage treatments ranged from CT (moldboard plow, harrowing, and residue burning) to ZT (direct sowing with full residue retention). View evidence ↗
- A composite sustainability index (CSI) was calculated using the geometric mean of normalized energy use efficiency, inverse carbon footprint, and grain yield. View evidence ↗
What they found
- Energy input was reduced by 53.3% when moving from conventional tillage (18.4 GJ/ha) to zero tillage (8.6 GJ/ha). View evidence ↗
- Energy use efficiency (EUE) nearly doubled, increasing from 2.33 in the conventional system to 4.43 in the zero tillage system. View evidence ↗
- While conventional tillage had the highest yield (9.84 t/ha), the yield gap between it and zero tillage (9.17 t/ha) decreased from 6.8% in the first year to 3.1% by the third year. View evidence ↗
- The composite sustainability index ranked zero tillage as the most sustainable (0.79), followed by minimum, reduced, and conventional tillage (0.41). View evidence ↗
- Diesel's contribution to total energy input dropped from 31.2% in conventional tillage to 18.4% in zero tillage. View evidence ↗
- Residue burning, which occurred only in the conventional tillage system, added 218.6 kg CO₂-eq per hectare to its carbon footprint. View evidence ↗
What it means
- The authors conclude that zero tillage significantly reduces energy and carbon footprints while maintaining the vast majority of conventional yields. View evidence ↗
- The findings justify the promotion of conservation tillage as a climate-smart strategy for semi-arid rice-wheat systems in peninsular India. View evidence ↗
Visual summary
3 visualsIllustrations explain the paper; charts are replotted from the paper's own table values.
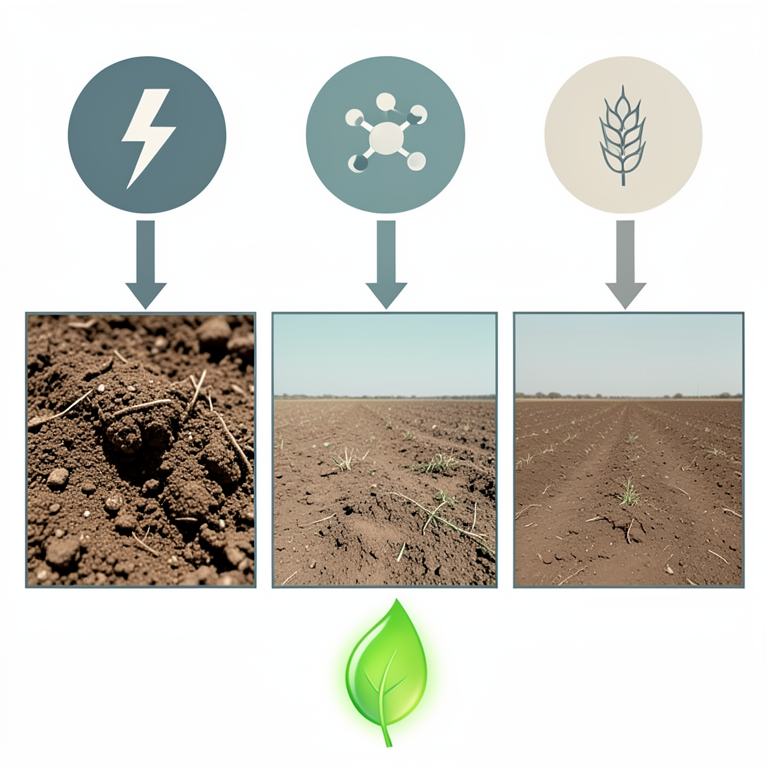
Sustainability Index Framework
AI-generated conceptual illustration (wheat fields under different tillage systems). It explains the idea and does not show study data.
View source evidence ↗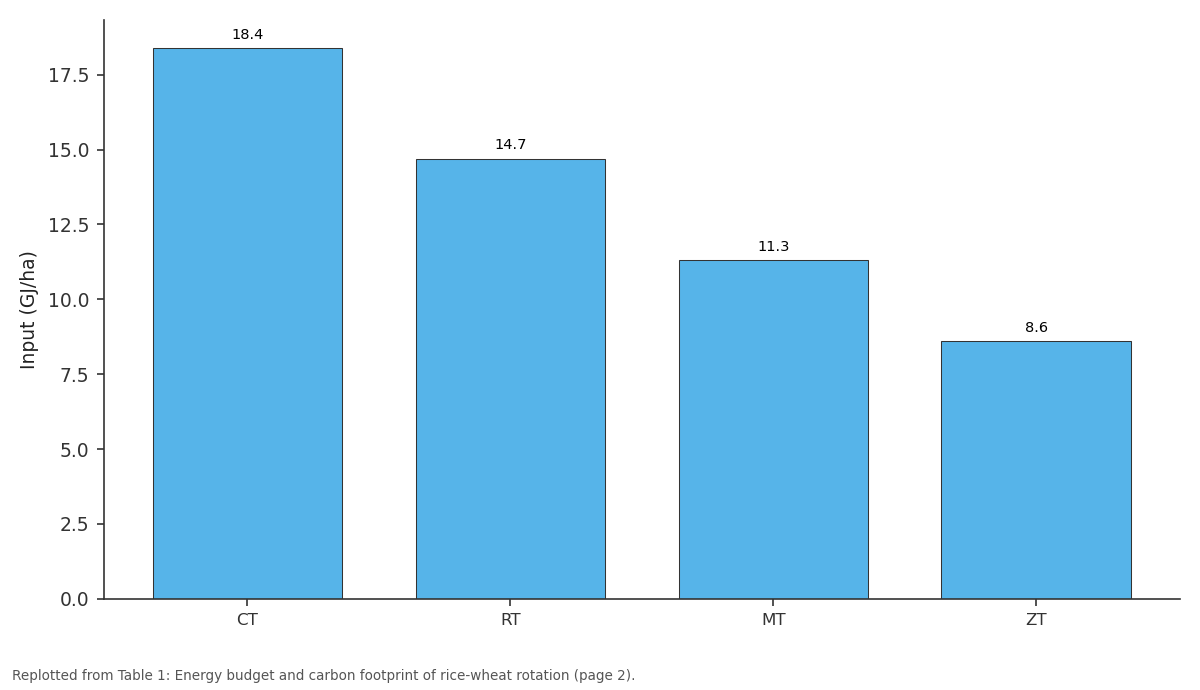
Input (GJ/ha): CT vs RT vs MT vs ZT
Replotted from Table 1 (page 2) of the original paper. Every bar is the paper's own table value.
View source evidence ↗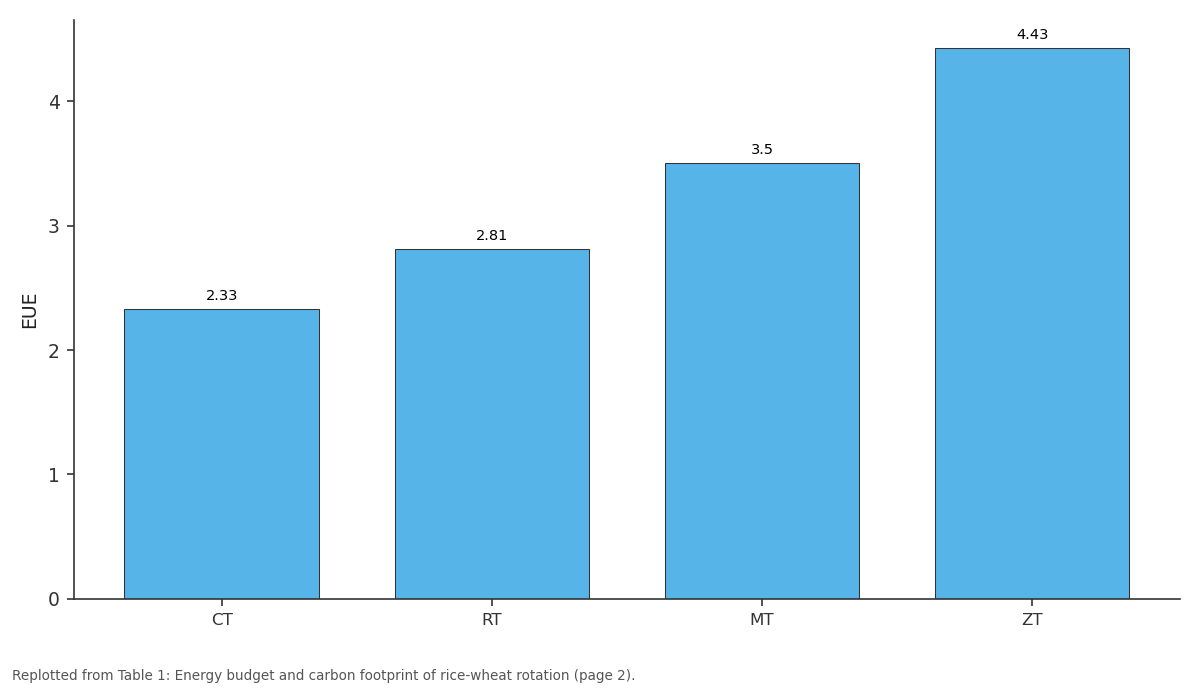
EUE: CT vs RT vs MT vs ZT
Replotted from Table 1 (page 2) of the original paper. Every bar is the paper's own table value.
View source evidence ↗Figures & tables
From the original paper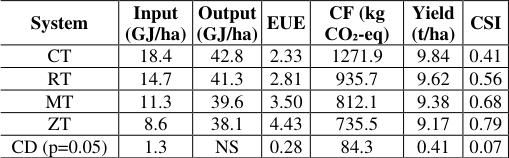 Table 1
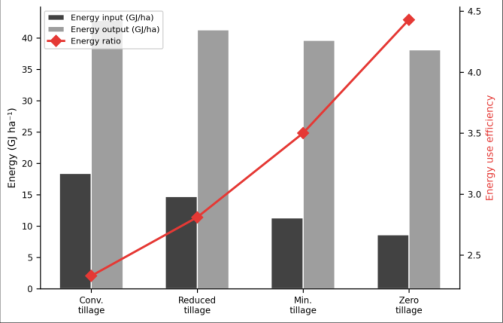 Figure 1
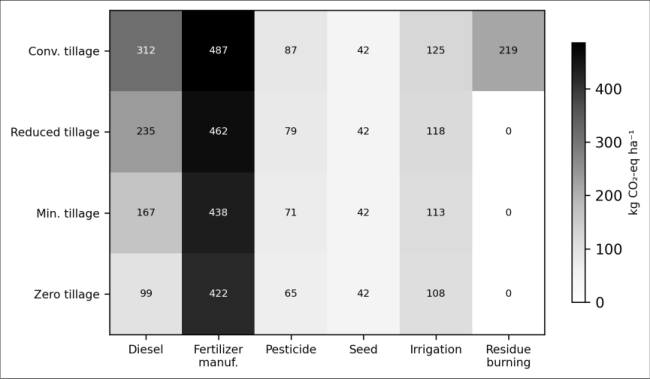 Figure 2
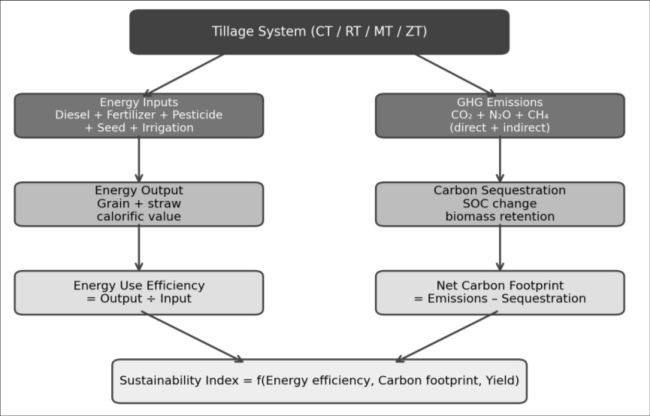 Figure 3
Introduction
As one prominent agronomist recently observed, "we can't keep burning diesel and crop residues and then wonder why agriculture contributes 14% of global greenhouse gas emissions." That blunt assessment captures the urgency behind the global push toward conservation tillage [1] . In India's rice-wheat belt, conventional practice involves moldboard plowing, multiple harrowing passes, and in many areas, burning of rice straw before wheat sowing-a sequence that is both energy-intensive and carbon-heavy [2,3]. Energy budgeting provides a quantitative framework for comparing the total energy consumed (inputs) and produced (outputs) by different cropping systems [4] . Carbon footprinting extends this analysis to greenhouse gas emissions, including both direct (fuel combustion, soil N₂O) and indirect (fertilizer manufacturing, pesticide production) sources [5] . Together, these tools can identify which practices deliver the best environmental outcome per unit of food produced. Zero tillage and minimum tillage have been promoted across the Indo-Gangetic plains primarily for their soil health and water-saving benefits [6,7]. But their energy and carbon credentials under Maharashtra's semi-arid conditions-where the rice-wheat system operates under different moisture and temperature regimes than Punjab or Haryana-haven't been well documented [8] . This research aimed to construct complete energy and carbon budgets for four tillage systems in a rice-wheat rotation at Rahuri, Maharashtra, over three consecutive years, and to develop a composite sustainability index that integrates energy, carbon, and productivity dimensions.
Carbon Footprint Accounting Methodology
The carbon footprint was calculated following IPCC Tier 1 guidelines [5] with India-specific emission factors where available. Direct emissions included diesel combustion (2.67 kg CO₂ L⁻¹), soil N₂O from nitrogen fertilizer application (1% of applied N as N₂O-N, converted using a GWP of 298), and methane from rice paddies (estimated using seasonal emission factors for continuously flooded conditions). Indirect emissions covered fertilizer manufacturing (5.3 kg CO₂-eq kg⁻¹ N for urea), pesticide production (18.7 kg CO₂-eq kg⁻¹ a.i.), and seed production. Residue burning emissions were calculated from the mass of rice straw burned multiplied by the IPCC emission factor of 1.38 kg CO₂-eq kg⁻¹ dry matter. Carbon sequestration credits from residue retention under ZT and MT were estimated based on measured changes in soil organic carbon at 0-15 cm depth over the three-year period.
Materials and Methods
Materials and Methods
Materials
The field experiment was established in June 2021 on a Vertisol (clay 52%, pH 8.1, organic carbon 0.58%) at the research farm of Mahatma Phule Krishi Vidyapeeth, Rahuri, Maharashtra (19°24′N, 74°38′E, 511 m a.s.l.). The rice variety Phule Samruddhi and wheat variety NIAW-34 were used in both seasons. Fertilizers were applied at recommended rates: 120:60:40 kg N:P₂O₅:K₂O ha⁻¹ for rice and 120:60:30 for wheat. A zero-till seed drill (Pantnagar model) was used for ZT plots. Diesel consumption was measured using calibrated fuel meters on all field machinery.
Methods
Four tillage treatments in a rice-wheat rotation were compared in a randomized block design with four replications (plot size 10 m × 8 m): CT (moldboard plow + 2 harrowings + planking + residue burning), RT (disc harrow + planking, residue partially incorporated), MT (one rotavator pass, full residue retention), and ZT (direct sowing into previous stubble, full residue retention). Energy equivalents for all inputs and outputs were calculated using standard coefficients [4] : diesel 56.31 MJ L⁻¹, nitrogen 60.6 MJ kg⁻¹, phosphorus 11.1 MJ kg⁻¹, human labor 1.96 MJ h⁻¹, rice grain 14.7 MJ kg⁻¹, wheat grain 14.7 MJ kg⁻¹. Energy use efficiency (EUE) = energy output / energy input. A composite sustainability index (CSI) was computed as the geometric mean of normalized EUE, inverse carbon footprint, and grain yield equivalent. Data were analyzed using ANOVA with LSD at p ≤ 0.05 in R v.4.3.
Baseline Soil Properties
Pre-experimental soil analysis (June 2021) showed: pH 8.1, EC 0.42 dS m⁻¹, organic carbon 0.58%, available N 186 kg ha⁻¹, available P 18.3 kg ha⁻¹, available K 312 kg ha⁻¹, bulk density 1.34 g cm⁻³, and aggregate stability index 42.7%. No significant differences existed among plots at baseline (p > 0.05), confirming uniform starting conditions.
Results
Results
Comprehensive Interpretation
The heatmap (Figure 2) reveals that diesel and fertilizer manufacturing together accounted for over 60% of the total carbon footprint in every system. Eliminating residue burning alone (as in RT, MT, and ZT) cut emissions by 17.2%. The model diagram (Figure 3) illustrates how the sustainability index integrates energy, carbon, and yield into a single decision metric.
Discussion
The 53.3% reduction in energy input from CT to ZT is consistent with reports from the Indo-Gangetic plains [2,6] and reflects the elimination of multiple tillage passes that each consume 12-15 L diesel ha⁻¹. Diesel accounted for 31.2% of energy input under CT but only 18.4% under ZT, where herbicide energy (for glyphosate-based weed control) partly offset the diesel savings.
The carbon footprint reduction of 42.2% under ZT is driven by three factors: lower diesel combustion, no residue burning, and a modest increase in soil organic carbon (from 0.58% to 0.67% in ZT plots versus no change under CT). The residue burning contribution (218.6 kg CO₂-eq ha⁻¹) to CT's footprint highlights a target that policy already addresses-India banned stubble burning in 2015-but enforcement remains patchy [3] . The initial yield drag under ZT (6.8% in year one) is a commonly reported transitional effect attributed to incomplete residue decomposition and altered weed dynamics [7] . By year three, the gap narrowed to 3.1%, suggesting that the system was stabilizing. Longer-term data (5-10 years) from permanent ZT plots typically show yield convergence or even surpassing of CT [6] . The composite sustainability index offers a practical decision tool for policymakers comparing tillage options across multiple dimensions simultaneously.
Conclusion
Zero tillage in the rice-wheat rotation at Rahuri, Maharashtra, reduced energy input by 53.3% and carbon footprint by 42.2% compared with conventional tillage, while maintaining 93-97% of CT yields. The composite sustainability index clearly favored ZT (0.79) over CT (0.41). Diesel savings and elimination of residue burning were the main drivers of lower energy use and emissions.
The initial yield penalty under ZT diminished over three years, supporting longer-term adoption. These results provide quantitative justification for promoting conservation tillage as a climate-smart strategy in semi-arid rice-wheat systems of peninsular India.
Figures and tables from the paper
| System | Input (GJ/ha) | Output (GJ/ha) | EUE | CF (kg CO₂-eq) | Yield (t/ha) | CSI |
|---|---|---|---|---|---|---|
| CT | 18.4 | 42.8 | 2.33 | 1271.9 | 9.84 | 0.41 |
| RT | 14.7 | 41.3 | 2.81 | 935.7 | 9.62 | 0.56 |
| MT | 11.3 | 39.6 | 3.50 | 812.1 | 9.38 | 0.68 |
| ZT | 8.6 | 38.1 | 4.43 | 735.5 | 9.17 | 0.79 |
| CD (p=0.05) | 1.3 | NS | 0.28 | 84.3 | 0.41 | 0.07 |
Table text extracted from the original PDF; superscript letters are shown inline. The original table image is below.
View original table image
References
14 in the original paper- Smith P, Martino D, Cai Z, Gwary D, Janzen H, Kumar P. Greenhouse gas mitigation in agriculture. Philosophical Transactions of the Royal Society B. 2008;363(1492):789-813.
- Gathala MK, Kumar V, Sharma PC, Saharawat YS, Jat HS, Singh M. Optimizing intensive cereal-based cropping systems addressing current and future drivers of agricultural change in the northwestern IndoGangetic plains. Agriculture, Ecosystems and Environment. 2013;177:85-97.
- Jain N, Bhatia A, Pathak H. Emission of air pollutants from crop residue burning in India. Aerosol and Air Quality Research. 2014;14(1):422-430.
- Mittal VK, Dhawan KC. Research on energy requirement in agriculture sector: a detailed survey. Agricultural Engineering Today. 1988;12(2-3):5-20.
- IPCC. Climate change 2014: mitigation of climate change. Contribution of Working Group III to the Fifth Assessment Report. 2014;Cambridge University Press.
- Jat ML, Gathala MK, Saharawat YS, Tetarwal JP, Gupta R. Double no-till and permanent raised beds in maize-wheat rotation of north-western Indo-Gangetic plains of India. Field Crops Research. 2013;149:291299.
- Hobbs PR, Sayre K, Gupta R. The role of conservation agriculture in sustainable agriculture. Philosophical Transactions of the Royal Society B. 2008;363(1491):543-555.
- Kalhapure AH, Shete BT, Dhonde MB. Integrated nutrient management in maize for increasing production with sustainability. International Journal of Agriculture and Food Science Technology. 2013;4(3):195-206.
- Mandal KG, Saha KP, Ghosh PK, Hati KM, Bandyopadhyay KK. Bioenergy and economic analysis of soybean-based crop production systems in central India. Biomass and Bioenergy. 2002;23(5):337-345. International Journal of Agriculture and Nutrition https://www.agriculturejournal.net
- Lal R. Carbon emission from farm operations. Environment International. 2004;30(7):981-990.
- West TO, Marland G. A synthesis of carbon sequestration, carbon emissions, and net carbon flux in agriculture. Agriculture, Ecosystems and Environment. 2002;91(1-3):217-232.
- Pathak H, Jain N, Bhatia A, Patel J, Aggarwal PK. Carbon footprints of Indian food items. Agriculture, Ecosystems and Environment. 2010;139(1-2):66-73.
- Derpsch R, Friedrich T, Kassam A, Li H. Current status of adoption of no-till farming in the world and some of its main benefits. International Journal of Agricultural and Biological Engineering. 2010;3(1):1-25.
- Saharawat YS, Singh B, Malik RK, Ladha JK, Gathala M, Jat ML. Evaluation of alternative tillage and crop establishment methods in a rice-wheat rotation in northwestern IGP. Field Crops Research. 2010;116(3):260267.