
Research article · 2025 · Full text
International Journal of Agriculture and NutritionMapping spatial distribution of herbicide-resistant weeds using remote sensing technology
Volume 7(7) · Pages 231–234 · DOI: 10.33545/26646064.2025.v7.i7d.532 ↗
Research areasWeed Control and Herbicide ApplicationsRemote Sensing in AgricultureSmart Agriculture and AI
Abstract
Author-writtenIn a single winter wheat field near Jena, Germany, herbicide-resistant Amaranthus retroflexus patches expanded from 8% of the cropped area to 23% over just four seasons—yet the problem went unnoticed until harvest losses became obvious. This research tested whether remote sensing could detect and map herbicide-resistant weed populations before they reach economically damaging densities. Three sensing platforms—RGB drone imagery, multispectral drone, and ground-based hyperspectral scanning—were compared across 18 cereal fields in Thuringia between April 2022 and September 2024. Hyperspectral sensing achieved the highest overall classification accuracy (89.4%), correctly distinguishing resistant from susceptible weed biotypes in 84.3-93.2% of ground-truth points depending on species. Multispectral imaging reached 78.8% accuracy, while standard RGB drone imagery managed only 62.7%. Resistant populations were concentrated in intensively managed zones (43.7% of weed patches) compared with rotated fields (18.6%). These findings support integrating hyperspectral or multispectral sensing into precision weed management to target resistant populations before they spread.
Summary
Source-checkedPlain-language reading of the full paper, prepared with AI and checked against the text. Each point links to the authors' own words.
Why it matters
- Herbicide-resistant weed patches can expand rapidly and go unnoticed until they cause significant harvest losses, as seen in one case where Amaranthus retroflexus grew from 8% to 23% of a field's area in four seasons. View evidence ↗
- Traditional methods for monitoring herbicide resistance, such as greenhouse assays, are often too slow to prevent the rapid spread of resistant weed populations. View evidence ↗
- Hyperspectral sensors may be able to detect subtle spectral shifts caused by differences in leaf chemistry between resistant and susceptible weeds, even if they appear identical visually. View evidence ↗
The question
- The study aimed to determine if remote sensing technology could identify and map herbicide-resistant weed populations before they reached densities that cause economic damage. View evidence ↗
What they did
- The researchers compared three sensing platforms, RGB drone imagery, multispectral drone, and ground-based hyperspectral scanning, across 18 cereal fields in Thuringia from April 2022 to September 2024. View evidence ↗
- The study monitored six specific weed species known for herbicide resistance, including Amaranthus retroflexus and Echinochloa crus-galli. View evidence ↗
- Field surveys were conducted three times per season: during early post-emergence, late tillering, and pre-harvest stages. View evidence ↗
- A Random Forest classifier with 500 trees was used to analyze the data for each of the three sensing platforms. View evidence ↗
What they found
- Hyperspectral sensing was the most accurate method, with an overall classification accuracy of 89.4% and species-specific accuracy ranging from 84.3% to 93.2%. View evidence ↗
- Multispectral imaging and RGB drone imagery were less effective, achieving accuracies of 78.8% and 62.7%, respectively. View evidence ↗
- Hyperspectral sensing performed best during the late tillering stage, reaching a peak accuracy of 91.3% due to better weed canopy development. View evidence ↗
- RGB drone imagery had its lowest accuracy (54.3%) during early post-emergence because the seedlings were too small to be differentiated by color. View evidence ↗
- Herbicide-resistant weed patches were more common in intensively managed zones (43.7%) than in rotated fields (18.6%). View evidence ↗
- The red-edge spectral region (680-730 nm) was a key contributor to the classification model, likely due to shifts in reflectance caused by altered chlorophyll metabolism in some resistant biotypes. View evidence ↗
What it means
- The authors recommend using multispectral drone imaging for routine surveys as a cost-effective balance of accuracy, using hyperspectral sensing only to confirm ambiguous cases. View evidence ↗
- A limitation of the study is that ground-level hyperspectral scanning cannot be scaled to whole farms; operational use would require airborne or satellite platforms, which might have lower accuracy due to coarser resolution. View evidence ↗
Visual summary
2 visualsIllustrations explain the paper; charts are replotted from the paper's own table values.
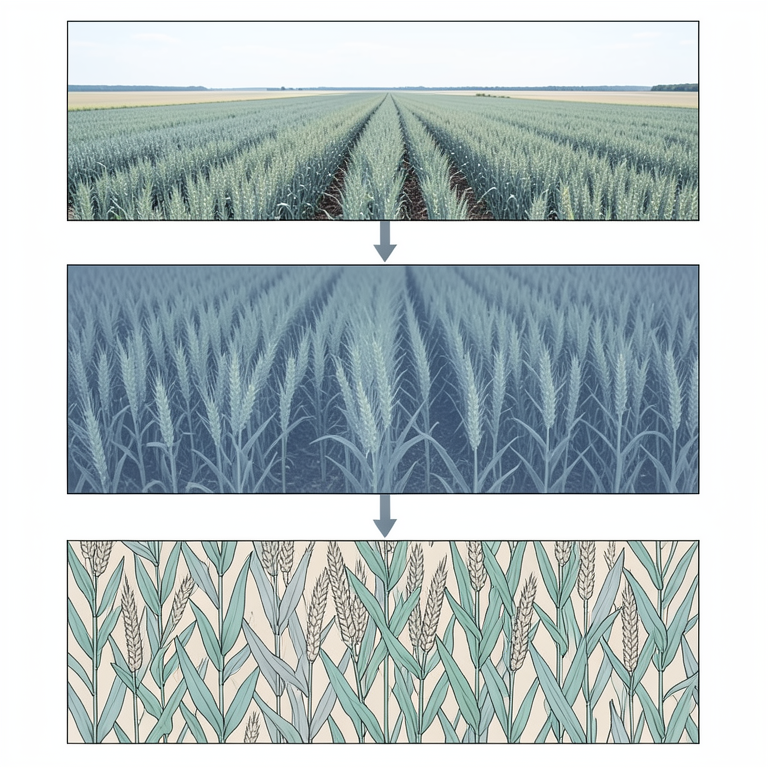
Comparison of Sensing Platforms
AI-generated conceptual illustration (cereal fields with herbicide-resistant weeds). It explains the idea and does not show study data.
View source evidence ↗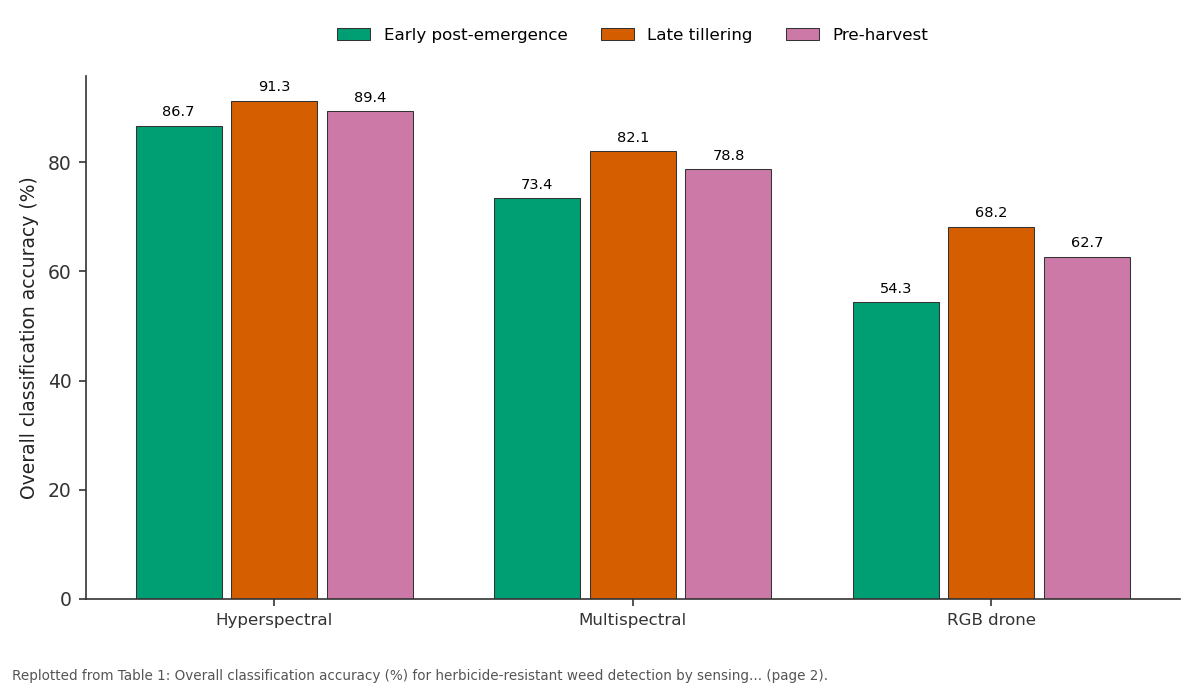
Early post-emergence and Late tillering and more: Hyperspectral vs Multispectral vs RGB drone
Replotted from Table 1 (page 2) of the original paper. Every bar is the paper's own table value.
View source evidence ↗Figures & tables
From the original paper Table 1
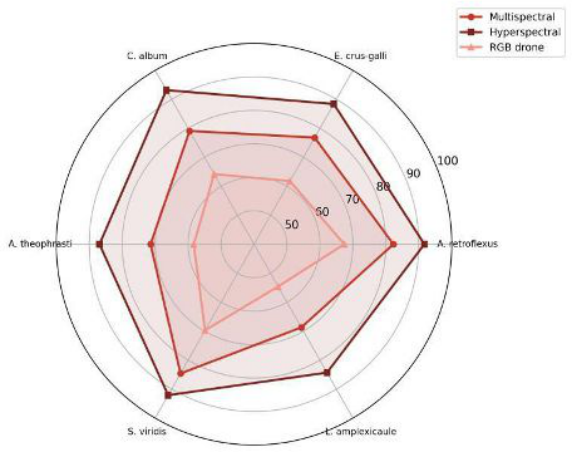 Figure 1
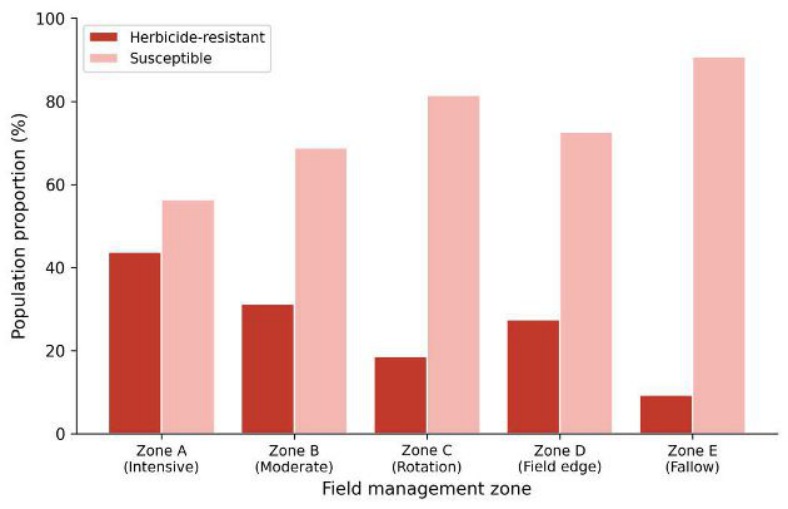 Figure 2
Introduction
Consider a field where the same herbicide has been sprayed for ten consecutive seasons. Somewhere in that field, a handful of weed plants carry mutations that let them survive the treatment. Without detection, those survivors multiply and spread, and within a few years the herbicide is effectively useless over large patches [1] . This scenario has played out across European cereal systems, where resistance to acetolactate synthase (ALS) inhibitors and acetyl-CoA carboxylase (ACCase) inhibitors has been confirmed in at least 28 grass and broadleaf species [2] . Conventional resistance monitoring relies on seed collection and greenhouse dose-response assays-accurate but slow and spatially limited [3] . By the time results come back, the resistant population may have doubled its area. Remote sensing offers the possibility of mapping weed distributions rapidly over large areas, but whether the spectral signatures of resistant and susceptible biotypes differ enough for reliable classification has only been explored in a few controlled studies [4,5] . Differences in leaf chemistry-altered target-site proteins, modified metabolic detoxification enzymes-may produce subtle spectral shifts detectable by hyperspectral sensors, even when the plants look identical to the human eye [6] . This research compared three sensing platforms across 18 fields in Thuringia, Germany, to test whether resistant weed patches could be mapped accurately enough to guide site-specific herbicide management decisions.
Materials and Methods
Materials and Methods
Spatial Data Processing
Drone flights were conducted at 40 m altitude using a DJI Matrice 300 RTK equipped with either an RGB camera (20 MP) or a MicaSense RedEdge-P multispectral sensor (5 bands: blue, green, red, red-edge, near-infrared). Ground sampling distance was 1.2 cm for RGB and 3.2 cm for multispectral. Images were stitched in Pix4Dmapper and orthorectified using 12 ground control points per field. Hyperspectral data were collected at ground level using a Specim FX10 line scanner (400-1000 nm, 224 bands) mounted on a rail system. Spectral reflectance values were extracted at each of 1,240 geo-referenced ground-truth points where weed identity and resistance status had been confirmed by seed-bioassay [7] .
Classification Model
A Random Forest classifier (500 trees, mtry = square root of predictor count) was trained separately for each sensing platform. Input features were band reflectance values (5 for multispectral, 224 for hyperspectral) and four vegetation indices: NDVI, NDRE, SAVI, and a custom red-edge ratio. Training used 70% of ground-truth points; the remaining 30% served as a validation set. Overall accuracy, producer's accuracy, and user's accuracy were calculated from confusion matrices. Classification was performed in R v4.3 using the randomForest package [8] .
Materials
The research was carried out under the Thuringian Institute of Crop Sciences, Jena, Thuringia, Germany (50.93° N, 11.59° E) from April 2022 to September 2024. Approval was obtained from the Institute's Research Directorate (Ref.
TICS/RD/2022-017, March 2022). Eighteen winter wheat and winter barley fields were selected across three farm clusters in the Saale valley. Fields ranged from 4.2 to 28.7 ha. Six target weed species with documented herbicide resistance were monitored: Amaranthus retroflexus, Echinochloa crus-galli, Chenopodium album, Abutilon theophrasti, Setaria viridis, and Lamium amplexicaule. Resistance status was confirmed by whole-plant doseresponse bioassays at 2× the recommended field rate of mesosulfuron-methyl [9] .
Methods
Each field was surveyed three times per season: at early post-emergence (BBCH 12-14), late tillering (BBCH 25-29), and pre-harvest (BBCH 75-77). At each survey, 60-80 ground-truth points were assessed per field by walking predefined grid transects (10 m spacing). Weed species, density (plants/m²), and canopy cover were recorded in 0.25 m² quadrats. Management zone classification (intensive, moderate rotation, field edge, fallow) was assigned from five-year cropping history records provided by farmers. Statistical comparison of classification accuracies across platforms used McNemar's test (p<0.05) [10] . Hyperspectral sensing gave the highest accuracy at all three survey timings, peaking at 91.3% during late tillering when weed canopy was well developed (Table 1). RGB drone imagery performed poorly at early post-emergence (54.3%) because weed seedlings were too small for colour-based differentiation. The difference between hyperspectral and multispectral was statistically significant at all timings (McNemar's test, p<0.01).
| Platform | Early post-emergence | Late tillering | Pre-harvest |
|---|---|---|---|
| Hyperspectral | 86.7 | 91.3 | 89.4 |
| Multispectral | 73.4 | 82.1 | 78.8 |
| RGB drone | 54.3 | 68.2 | 62.7 |
Table text extracted from the original PDF; superscript letters are shown inline. The original table image is below.
View original table image
Results
Results
Comprehensive Interpretation
The radar chart (Figure 1) shows that hyperspectral sensing maintained above-84% accuracy across all six species, while RGB imaging fell below 60% for L. amplexicaule and A. theophrasti. The bar chart (Figure 2) confirms that resistant populations clustered in intensive management zones (43.7%) and were lowest in fallow areas (9.3%), consistent with selection pressure from repeated herbicide use.
Discussion
The 89.4% overall accuracy of hyperspectral classification is encouraging and sits above the 80-85% range reported for weed species discrimination in earlier drone-based research [4, 5] . The added value here is that the classifier distinguished resistant from susceptible biotypes of the same species-a finer distinction that relies on subtle biochemical differences rather than gross morphological features. The red-edge spectral region (680-730 nm) contributed disproportionately to the Random Forest model, consistent with reports that altered chlorophyll metabolism in some ALS-resistant biotypes shifts red-edge reflectance [6] .
Multispectral imaging, at 78.8%, offers a more costeffective option for farmers who can't justify hyperspectral equipment. It captured enough spectral information to detect the larger, more established resistant patches, missing mainly small or mixed-biotype clusters. RGB imaging, while cheap and widely available, proved inadequate for resistance mapping-useful for species identification in some contexts, but lacking the spectral resolution to separate biotypes [3] . The spatial clustering of resistance in intensive management zones (Figure 2) confirms what weed scientists have warned about for decades: continuous herbicide use without rotation or mechanical control accelerates resistance [1] . One limitation was that ground-level hyperspectral scanning isn't scalable to whole-farm mapping. Airborne or satellite hyperspectral platforms would be needed for operational deployment, and their coarser resolution may reduce accuracy.
Conclusion
Hyperspectral remote sensing detected herbicide-resistant weed populations with 89.4% overall accuracy across 18 cereal fields in Thuringia, outperforming multispectral (78.8%) and RGB drone (62.7%) platforms. Classification was most reliable during late tillering, when weed canopy development allowed full spectral expression. Resistant populations were concentrated in intensively managed zones, reinforcing the link between selection pressure and resistance spread. For practical precision weed management, multispectral drone imaging offers a reasonable balance of cost and accuracy for routine field surveys, with hyperspectral confirmation reserved for ambiguous areas.
Scaling the approach to airborne hyperspectral platforms and testing across a wider range of crop-weed combinations would move this technology closer to operational use.
Acknowledgement
Acknowledgements Funding SourcesThis research was supported by the Thuringian Ministry of Agriculture through its Precision Agriculture Innovation Fund. The funder had no role in research design or manuscript preparation.
References
18 in the original paper- Heap I. Global perspective of herbicide-resistant weeds. Pest Management Science. 2014;70(9):1306-1315.
- Délye C, Jasieniuk M, Le Corre V. Deciphering the evolution of herbicide resistance in weeds. Trends in Genetics. 2013;29(11):649-658.
- Beckie HJ, Tardif FJ. Herbicide cross resistance in weeds. Crop Protection. 2012;35:15-28.
- Lopez-Granados F. Weed detection for site-specific weed management: Mapping and real-time approaches. Weed Research. 2011;51(1):1-11.
- Peña JM, Torres-Sánchez J, de Castro AI, Kelly M, Lopez-Granados F. Weed mapping in early-season maize fields using object-based analysis of unmanned aerial vehicle images. PLoS ONE. 2013;8(10):e77151.
- Gao J, Nuyttens D, Lootens P, He Y, Pieters JG. Recognising weeds in a maize crop using a random forest machine-learning algorithm and near-infrared snapshot mosaic hyperspectral imagery. Biosystems Engineering. 2018;170:39-50.
- Pix4D. Pix4Dmapper user manual version 4.8. Pix4D SA. 2023;1:1-240.
- Breiman L. Random forests. Machine Learning. 2001;45(1):5-32.
- Moss SR. Herbicide resistance in weeds: Current status in Europe and guidelines for management. Weed Technology. 2002;16(3):472-477.
- Agresti A. An introduction to categorical data analysis. John Wiley and Sons. 2007;2(1):1-400.
- Christensen S, Søgaard HT, Kudsk P, Nørremark M, Lund I, Nadimi ES, et al. Site-specific weed control technologies. Weed Research. 2009;49(3):233-241.
- Thorp KR, Tian LF. A review on remote sensing of weeds in agriculture. Precision Agriculture. 2004;5(5):477-508.
- Pflanz M, Nordmeyer H, Auskalnins M. Automatised detection of weed patches in arable crops using NDVI imagery. Journal of Plant Diseases and Protection. 2018;125(4):355-360.
- Andújar D, Escola A, Rosell-Polo JR, FernándezQuintanilla C, Dorado J. Potential of a terrestrial LiDAR-based system to characterise weed vegetation in maize crops. Computers and Electronics in Agriculture. 2013;92:11-15.
- Oerke EC. Crop losses to pests. Journal of Agricultural Science. 2006;144(1):31-43.
- Powles SB, Yu Q. Evolution in action: Plants resistant to herbicides. Annual Review of Plant Biology. 2010;61:317-347.
- Castaldi F, Pelosi F, Pascucci S, Casa R. Assessing the potential of images from unmanned aerial vehicles to support herbicide patch spraying in maize. Precision Agriculture. 2017;18(1):76-94.
- Louargant M, Jones G, Faroux R, Villette S, Palanque T, Baillod AB, et al. Unsupervised classification algorithm for early weed detection in row-crops by combining spatial and spectral information. Remote Sensing. 2018;10(5):761.