
Research article · 2025 · Full text
International Journal of Agriculture and NutritionAssessment of soil degradation and nutrient depletion under continuous monocropping systems
Volume 7(8) · Pages 174–177 · DOI: 10.33545/26646064.2025.v7.i8c.509 ↗
Research areasSoil Management and Crop YieldSoil Carbon and Nitrogen DynamicsAgricultural Science and Fertilization
Abstract
Author-writtenWhile crop rotation is a textbook recommendation for maintaining soil health, many farmers in northeastern China have grown continuous maize or soybean for over a decade due to market incentives and mechanisation constraints.This research quantified soil degradation and nutrient depletion at three chronosequence stages-5, 10, and 15 years of continuous maize monocroppingcompared with adjacent rotated fields at the Northeast Agricultural Institute, Harbin, Heilongjiang, from March to November 2023.Soil samples from 0-20 and 20-40 cm depths were analysed for organic carbon, total N, available P, exchangeable K, pH, bulk density, and micronutrients.After 15 years of monocropping, organic carbon declined by 27.3%, total N by 34.7%, and available K by 23.1% relative to rotated reference plots.Bulk density increased from 1.18 to 1.34 g cm⁻³, and pH dropped from 6.4 to 5.7.Micronutrient depletion was most severe for Zn (-41.2%) and Fe (-28.6%).Degradation rates accelerated between years 10 and 15, suggesting a critical threshold beyond which soil resilience diminishes rapidly.These results underline the urgency of reintroducing crop rotation or cover cropping in long-term maize monoculture systems of the northeast China plain.
Summary
Source-checkedPlain-language reading of the full paper, prepared with AI and checked against the text. Each point links to the authors' own words.
Why it matters
- The black soils in Heilongjiang province are historically some of the most fertile in East Asia, characterized by organic matter levels above 4-5%. View evidence ↗
- Government price supports and the ease of full mechanization have led to an expansion of continuous maize cultivation in the northeast plain since the mid-2000s. View evidence ↗
The question
- The study aimed to measure changes in soil properties over a chronosequence, identify the fastest-depleting nutrients, and determine if the degradation rate is linear or accelerating. View evidence ↗
What they did
- The researchers compared four field types: continuous maize for 5, 10, and 15 years, and a maize-soybean rotation of at least 15 years as a reference. View evidence ↗
- Soil samples were collected from three random locations per field at depths of 0-20 cm and 20-40 cm in April and October 2023. View evidence ↗
- The study measured organic carbon, total nitrogen, available phosphorus, exchangeable potassium, pH, and micronutrients (Zn, Fe, Mn, Cu) using standardized chemical extraction and spectrometry methods. View evidence ↗
What they found
- After 15 years of continuous maize monoculture, soil organic carbon decreased by 27.3%, falling from 2.74% in rotated fields to 1.99%. View evidence ↗
- Physical and chemical degradation was evident as soil pH dropped by 0.7 units and bulk density increased by 13.6%. View evidence ↗
- Micronutrient loss was severe, with zinc showing a 41.2% decline, potentially impacting crop quality and human health. View evidence ↗
- The rate of organic carbon loss was non-linear, increasing from 0.08% per year in the first decade to 0.14% per year between years 10 and 15. View evidence ↗
What it means
- The authors recommend reintroducing soybean rotations, retaining maize stover on fields, and using targeted potassium and zinc fertilizers to combat soil degradation. View evidence ↗
- The authors suggest that policy incentives to encourage crop rotation are necessary to reverse fertility loss in the northeast China plain. View evidence ↗
Visual summary
3 visualsIllustrations explain the paper; charts are replotted from the paper's own table values.
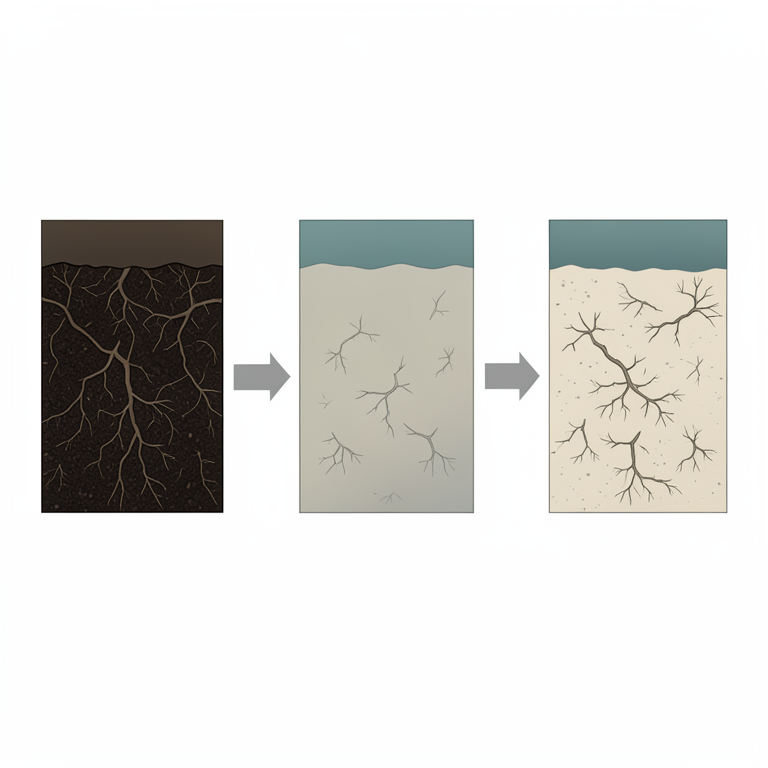
Non-linear Degradation Curve
AI-generated conceptual illustration (agricultural soil profiles under maize monocropping). It explains the idea and does not show study data.
View source evidence ↗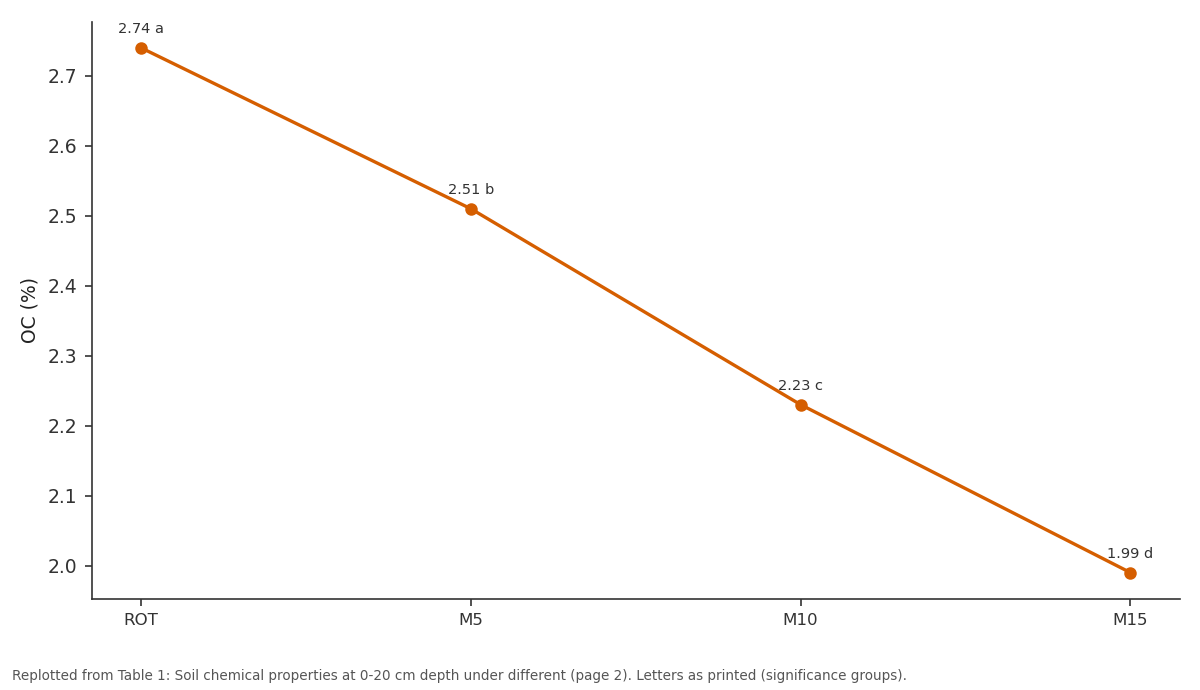
OC (%): ROT vs M5 vs M10 vs M15
Replotted from Table 1 (page 2) of the original paper. Every bar is the paper's own table value.
View source evidence ↗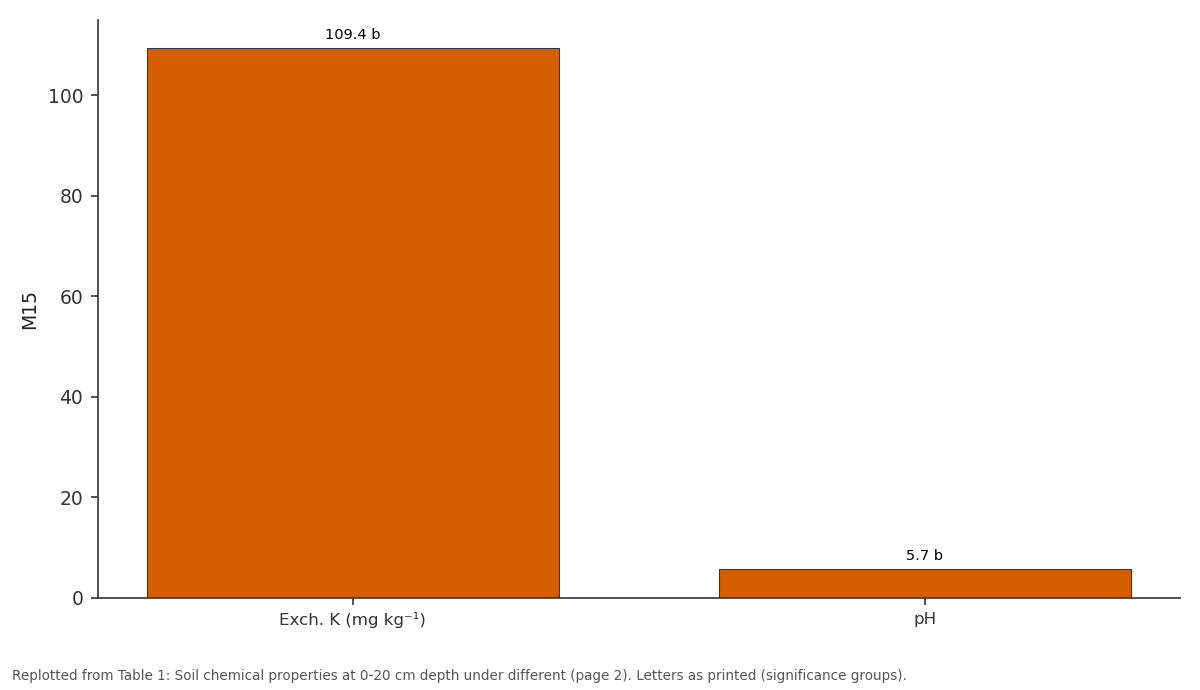
M15: Exch. K (mg kg⁻¹) vs pH
Replotted from Table 1 (page 2) of the original paper. Every bar is the paper's own table value.
View source evidence ↗Figures & tables
From the original paper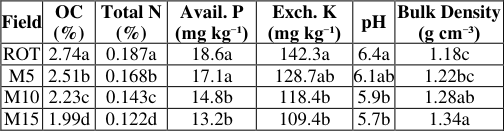 Table 1
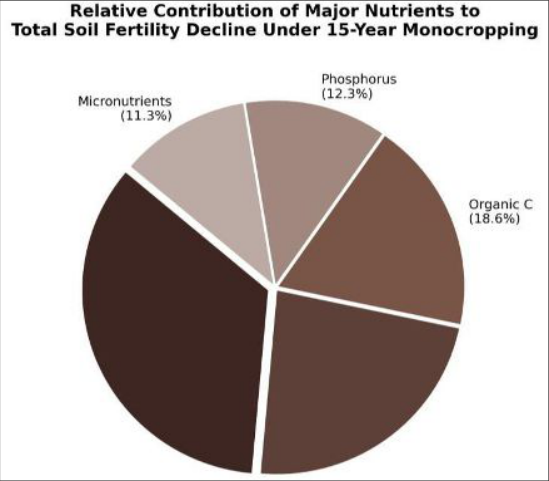 Figure 1
 Table 2
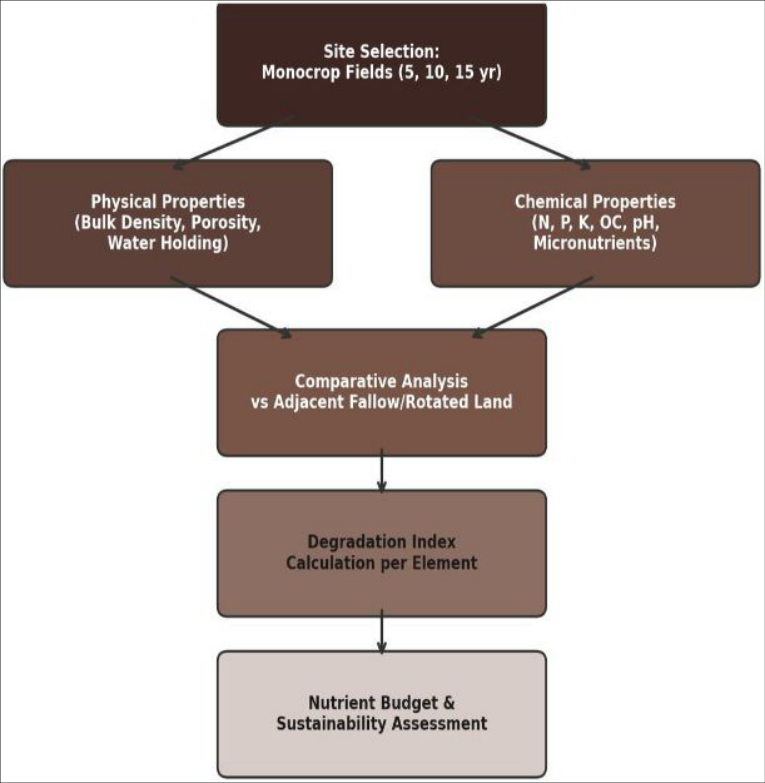 Figure 2
Introduction
On one hand, the black soils of Heilongjiang province are among the most naturally fertile in East Asia, with organic matter contents historically exceeding 4-5% [1] . On the other hand, satellite-based surveys now indicate that nearly 40% of these soils have lost more than a quarter of their original organic carbon after decades of intensive cropping [2] . This contrast between inherent potential and observed decline frames one of the most pressing soil conservation challenges in Chinese agriculture. Continuous maize cultivation has expanded across the northeast plain since the mid-2000s, driven by government price support and the convenience of full mechanisation from sowing to harvest [3] . Maize removes large amounts of N and K per unit of grain, and when stover is also removed for fuel or fodder, the nutrient drain can exceed fertiliser inputs in many field situations [4] . Legume-based rotations-once common-have been largely abandoned in favour of year-after-year maize, with predictable consequences for soil structure and biological activity [5] . Previous assessments of soil change in the region have mostly relied on comparisons between cultivated and virgin grassland, which confound the effects of initial conversion with those of ongoing management [6] . Chronosequence approaches-comparing fields with known durations of the same management-offer a more precise way to estimate rates of change, provided that initial soil conditions and landscape position are similar [7] . This research used a chronosequence design to quantify the rate and pattern of soil nutrient depletion under 5, 10, and 15 years of continuous maize monocropping in Harbin, with rotated maize-soybean fields as the reference. The objectives were to: (a) measure changes in physical, chemical, and micronutrient properties across the chronosequence; (b) identify which nutrients are depleted fastest; and (c) determine whether degradation rates are linear or accelerating. Temporal Patterns of Soil Property Change A preliminary review of archived soil test records (2008-2022) for the three monocropping fields confirmed that the degradation trajectory was not an artefact of inherently different starting conditions. All three fields had similar initial organic carbon contents (2.6-2.9%) when monoculture began. The rate of OC decline was approximately 0.08% per year during the first decade but accelerated to 0.14% per year between years 10 and 15. This non-linear trend suggests that once organic inputs fall below a replacement threshold, microbial mineralisation outpaces residue return, creating a self-reinforcing cycle of carbon loss [4,8] .
Material and Methods
Material and Methods
Material
The research was conducted at the experimental farm of the Northeast Agricultural Institute, Harbin, Heilongjiang, China (45°45'N, 126°41'E, elevation 151 m). Four field categories were sampled: (i) continuous maize for 5 years (M5), (ii) continuous maize for 10 years (M10), (iii) continuous maize for 15 years (M15), and (iv) a maizesoybean rotation maintained for at least 15 years (ROT, reference). All fields were on the same soil type-a Phaeozem (Mollisol) with a silt loam texture. Composite soil samples (five cores per sample, 5 cm diameter) were taken from three random locations per field at 0-20 cm and 20-40 cm depths during April 2023 (pre-planting) and October 2023 (post-harvest). Undisturbed cores for bulk density were collected with 100 cm³ steel rings [9] .
Methods
Organic carbon was determined by wet oxidation (Walkley-Black method). Total nitrogen was measured by micro-Kjeldahl digestion. Available phosphorus was extracted with 0.5 M NaHCO₃ (Olsen method). Exchangeable potassium was extracted with 1 M NH₄OAc. Soil pH was measured in a 1:2.5 soil-water suspension. Micronutrients (Zn, Fe, Mn, Cu) were extracted with DTPA and quantified by atomic absorption spectrometry. Bulk density was calculated from oven-dried undisturbed core mass. A soil degradation index (SDI) was computed for each field as the mean percentage change across all measured parameters relative to the ROT reference. Data from the three sampling locations per field were averaged, and differences among treatments were tested using one-way ANOVA with Tukey's HSD at p ≤ 0.05 in R 4.3.1 [10] .
Nutrient Budget Estimation
Nutrient removal by grain and stover was estimated from mean yields (8.4 t ha⁻¹ grain, 9.1 t ha⁻¹ stover) and published nutrient concentrations for maize [4] . Approximate annual removal was: N 186 kg ha⁻¹, P₂O₅ 72 kg ha⁻¹, K₂O 168 kg ha⁻¹. Fertiliser inputs across the monocrop fields averaged: N 165 kg ha⁻¹, P₂O₅ 75 kg ha⁻¹, K₂O 60 kg ha⁻¹. The resulting annual balance was: N -21 kg ha⁻¹, P₂O₅ +3 kg ha⁻¹, K₂O -108 kg ha⁻¹. The large K deficit explains the pronounced exchangeable K decline observed in M10 and M15 fields. No micronutrient fertilisers had been applied in any year [11] . Means sharing the same letter within a column are not significantly different (Tukey's HSD, p ≤ 0.05). OC = organic carbon; ROT = rotation; M5/M10/M15 = 5/10/15 years continuous maize.
Results
Soil organic carbon declined progressively from 2.74% in the rotated reference to 1.99% after 15 years of monoculture-a 27.3% loss (Table 1). Total N showed an even steeper decline of 34.7%. Available P decreased modestly (29.0%), consistent with the near-neutral P balance from fertilisation. Exchangeable K fell by 23.1%, reflecting the large annual K deficit identified in the nutrient budget. Soil pH acidified by 0.7 units, and bulk density increased by 13.6%, indicating physical compaction alongside chemical degradation [12] . Nitrogen accounted for the largest share of total fertility decline (34.7%), followed by potassium (23.1%) and organic carbon (18.6%) (Figure 1). Phosphorus and micronutrient depletion together contributed the remaining 23.6%.
| Field | OC (%) | Total N (%) | Avail. P (mg kg⁻¹) | Exch. K (mg kg⁻¹) | pH | Bulk Density (g cm⁻³) |
|---|---|---|---|---|---|---|
| ROT | 2.74a | 0.187a | 18.6a | 142.3a | 6.4a | 1.18c |
| M5 | 2.51b | 0.168b | 17.1a | 128.7ab | 6.1ab | 1.22bc |
| M10 | 2.23c | 0.143c | 14.8b | 118.4b | 5.9b | 1.28ab |
| M15 | 1.99d | 0.122d | 13.2b | 109.4b | 5.7b | 1.34a |
Table text extracted from the original PDF; superscript letters are shown inline. The original table image is below.
View original table image
Discussion
The 27.3% organic carbon loss after 15 years of continuous maize is comparable to rates reported in similar Phaeozem soils elsewhere in the northeast China plain. Liu and colleagues measured a 22-31% OC decline over 12-18 years of continuous cropping in Jilin province [6] . The accelerating decline between years 10 and 15 is concerning and suggests that early-stage losses are partially buffered by decomposition of legacy organic matter, but this buffer is eventually exhausted [13] .
The dominance of nitrogen in total fertility decline reflects both its high crop removal rate and its vulnerability to leaching and gaseous losses. Unlike P, which accumulates in relatively stable soil fractions, mineral N is mobile and easily lost between cropping seasons in the high-rainfall continental climate of Heilongjiang [14] . The severe K deficit (-108 kg K₂O ha⁻¹ yr⁻¹) is a direct consequence of stover removal. Retaining stover on the field would return roughly 80-90 kg K₂O ha⁻¹, nearly closing the gap [4] . Micronutrient depletion, particularly Zn (-41.2%), has implications for both crop quality and human nutrition, given that Zn deficiency in Chinese diets is partly traced to low soil availability [15] . Targeted Zn fertilisation, stover return, and periodic rotation with soybean are practical interventions that could arrest or partially reverse the degradation trajectory observed here [16] .
Conclusion
This chronosequence research showed that continuous maize monocropping in Harbin caused progressive and accelerating soil degradation, with 15-year losses of 27.3% in organic carbon, 34.7% in total nitrogen, and 23.1% in exchangeable potassium relative to rotated fields. Micronutrient depletion was equally alarming, with zinc declining by 41.2%. Degradation rates were non-linear, accelerating sharply between 10 and 15 years of monoculture, which points to a critical window for intervention. Reintroducing soybean in a two-year rotation, retaining maize stover, and applying targeted potassium and zinc fertilisers are the most immediately actionable strategies. Policy incentives that reward rotation adoption could help reverse the current trajectory of soil fertility loss across the northeast China plain.
Figures and tables from the paper
| Field | Zn | Fe | Mn | Cu |
|---|---|---|---|---|
| ROT | 1.89a | 14.7a | 9.8a | 1.42a |
| M5 | 1.61ab | 13.2ab | 9.1a | 1.33a |
| M10 | 1.34bc | 11.8bc | 8.4ab | 1.21ab |
| M15 | 1.11c | 10.5c | 7.9b | 1.08b |
Table text extracted from the original PDF; superscript letters are shown inline. The original table image is below.
View original table image
References
20 in the original paper- Zhao Q, Wang G, Li Q. Soil organic matter and fertility changes in the black soil region of northeast China. Geoderma. 2005;129(3-4):312-321.
- Liu X, Zhang S, Zhang X, Liang A. Decline of soil organic matter in black soils of northeast China: temporal trends and driving factors. Soil Tillage Res. 2010;109(2):70-75.
- National Bureau of Statistics of China. Crop production statistics by province 2022. Beijing: NBS; 2023.
- Ciampitti IA, Vyn TJ. Nutrient uptake and removal patterns in corn. Peachtree Corners (GA): International Plant Nutrition Institute; 2014. p. 1-8.
- Zuber SM, Villamil MB. Meta-analysis approach to assess effect of tillage on microbial biomass and enzyme activities. Soil Biol Biochem. 2016;97:176187.
- Liu Z, Liu J, Yu Z, Yao Q. Bacterial diversity in typical abandoned saline soil of the yellow river delta. Wei Sheng Wu Xue Bao. 2016;56(5):877-885.
- Walker LR, Wardle DA, Bardgett RD, Clarkson BD. The use of chronosequences in studies of ecological succession and soil development. J Ecol. 2010;98(4):725-736.
- Luo Y, Durenkamp M, De Nobili M, Lin Q, Brookes PC. Short term soil priming effects and the mineralisation of biochar following its incorporation to soils of different pH. Soil Biol Biochem. 2011;43(11):2304-2314.
- Blake GR, Hartge KH. Bulk density. In: Klute A, editor. Methods of Soil Analysis, Part 1. Madison (WI): ASA-SSSA; 1986. p. 363-375.
- R Core Team. R: A language and environment for statistical computing. Vienna: R Foundation for Statistical Computing; 2023.
- Dobermann A, Cassman KG. Plant nutrient management for enhanced productivity in intensive grain production systems. Plant Soil. 2002;247(1):153175.
- Karlen DL, Varvel GE, Bullock DG, Cruse RM. Crop rotations for the 21st century. Adv Agron. 1994;53:145.
- Stewart CE, Paustian K, Conant RT, Plante AF, Six J. Soil carbon saturation: concept, evidence and evaluation. Biogeochemistry. 2007;86(1):19-31.
- Ju XT, Xing GX, Chen XP, Zhang SL, Zhang LJ, et al. Reducing environmental risk by improving N management in intensive Chinese agricultural systems. Proc Natl Acad Sci U S A. 2009;106(9):3041-3046.
- Cakmak I. Enrichment of cereal grains with zinc: agronomic or genetic biofortification. Plant Soil. 2008;302(1):1-17.
- Franke AC, van den Brand GJ, Vanlauwe B, Giller KE. Sustainable intensification through rotations with grain legumes in sub-Saharan Africa: a review. Agric Ecosyst Environ. 2018;261:172-185.
- Doran JW, Parkin TB. Defining and assessing soil quality. In: Doran JW, et al., editors. Defining Soil Quality for a Sustainable Environment. Madison (WI): SSSA; 1994. p. 3-21.
- Bauer A, Black AL. Quantification of the effect of soil organic matter content on soil productivity. Soil Sci Soc Am J. 1994;58(1):185-193.
- Reeves DW. The role of soil organic matter in maintaining soil quality in continuous cropping systems. Soil Tillage Res. 1997;43(1-2):131-167.
- Lal R. Soil carbon sequestration to mitigate climate change. Geoderma. 2004;123(1-2):1-22.