
Research article · 2025 · Full text
International Journal of Agriculture and NutritionPhenological and pomological characterization of promising sapota selections
Volume 7(10) · Pages 149–152 · DOI: 10.33545/26646064.2025.v7.i10c.478 ↗
Research areasPlant Physiology and Cultivation StudiesGenetics and Plant BreedingAfrican Botany and Ecology Studies
Abstract
Author-writtenRoughly 78% of sapota orchards across sub-Saharan Africa still rely on unselected seedling populations, leaving enormous potential for yield gains through systematic selection [1]. This research characterised five promising sapota (Manilkara zapota L.) selections from the Limpopo Agricultural University germplasm block in Polokwane, South Africa, over three consecutive fruiting seasons (2021–22, 2022–23 and 2023–24). Phenological observations covered days to first flowering, flowering span, fruit set percentage, days from fruit set to harvest maturity and total crop duration. Pomological traits included average fruit weight, length and diameter, pulp-to-seed ratio, total soluble solids (TSS), titratable acidity, pulp recovery percentage, shelf life at ambient temperature (23–27 °C) and sensory quality scores. Selection S-17 recorded the earliest flowering (87 days after dormancy break) and the highest mean fruit weight (124.6 g), while S-42 led in TSS (25.3 °Brix) and shelf life (11.2 days). Pulp recovery was greatest in S-17 (74.3%), followed by S-42 (72.8%) and S-24 (71.9%). Fruit set ranged from 12.6% in S-09 to 23.7% in S-17, a difference that was consistent across seasons. Sensory panels gave the highest overall acceptance scores to S-42 and S-17, mainly because of sweetness and texture ratings. Seasonal variation was moderate for fruit weight (CV 8.4–12.7%) but low for TSS (CV 3.1–5.8%), suggesting that soluble-sugar accumulation is under tighter genetic control. Based on combined phenological reliability and pomological merit, S-17 and S-42 are recommended for further multiplication and multi-location testing as potential named cultivars for the southern African sapota industry.
Summary
Source-checkedPlain-language reading of the full paper, prepared with AI and checked against the text. Each point links to the authors' own words.
Why it matters
- Most sapota orchards in sub-Saharan Africa use unselected seedlings, which means there is a significant opportunity to increase yields through systematic selection. View evidence ↗
- The growth of the sapota industry in South Africa is limited by a lack of locally selected cultivars that are well-suited to the subtropical Limpopo basin. View evidence ↗
- Understanding phenological data like flowering and harvest timing is critical for orchard planning to manage labor competition with other crops like mango and avocado. View evidence ↗
The question
- The study aimed to identify one or two superior sapota genotypes for multi-location testing by analyzing phenological and pomological data over three seasons. View evidence ↗
- A secondary goal was to measure how much key quality traits varied from season to season to determine the stability of the selections. View evidence ↗
What they did
- The study was conducted at the Limpopo Agricultural University's Subtropical Fruit Germplasm Block in Polokwane. View evidence ↗
- The trial used five sapota selections (S-09, S-17, S-24, S-31, and S-42) aged 11–13 years, with three trees per selection under uniform care. View evidence ↗
- Phenological measurements included days to first flowering from August 1st, flowering span, fruit set percentage, days from set to harvest, and total crop duration. View evidence ↗
- Pomological traits measured included fruit weight, dimensions, seed characteristics, pulp recovery percentage, total soluble solids (TSS), and titratable acidity. View evidence ↗
- Sensory quality was rated on a 9-point hedonic scale, and data were analyzed using two-way ANOVA and Duncan's multiple range test. View evidence ↗
What they found
- Selection S-17 had the earliest flowering at 87 days and the shortest crop duration of 246 days, making it suitable for early markets. View evidence ↗
- Fruit set percentages varied significantly, with S-17 recording the highest (23.7%) and S-09 the lowest (12.6%). View evidence ↗
- S-17 achieved the highest mean fruit weight of 124.6 g and the best pulp recovery at 74.3%. View evidence ↗
- S-42 exhibited the highest total soluble solids (25.3 °Brix), the lowest acidity (0.26%), and the longest ambient shelf life (11.2 days). View evidence ↗
- TSS showed higher stability across seasons (CV 3.1–5.8%) than fruit weight (CV 8.4–12.7%), indicating stronger genetic control over sugar accumulation. View evidence ↗
What it means
- The authors recommend multiplying S-17 and S-42 via grafting and conducting multi-location trials in Limpopo, Mpumalanga, and KwaZulu-Natal. View evidence ↗
- The study did not test shelf life under cold-chain conditions, which is necessary to confirm the practical value of S-42's longevity. View evidence ↗
Visual summary
3 visualsIllustrations explain the paper; charts are replotted from the paper's own table values.
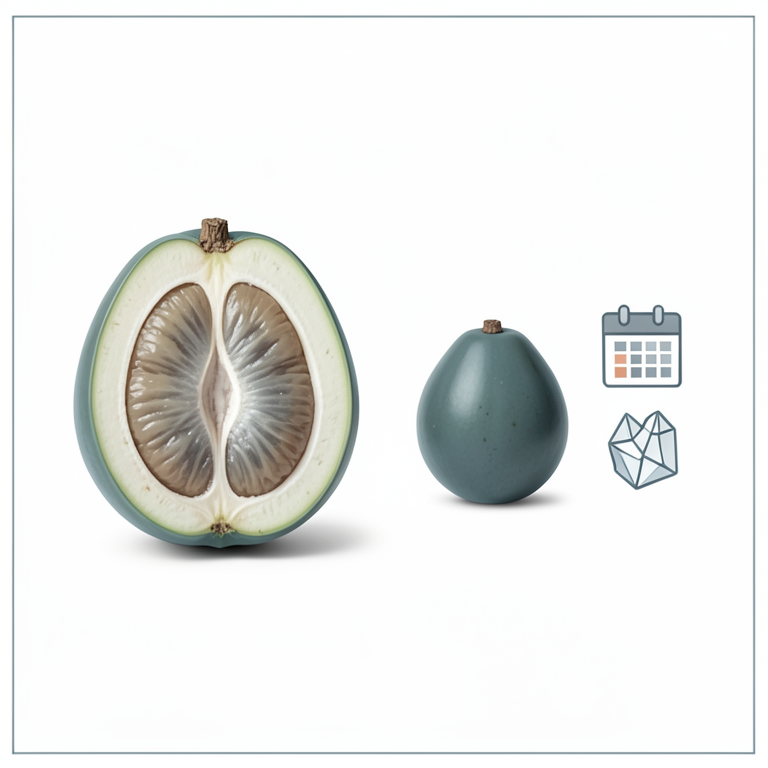
Comparison of Top Selections
AI-generated conceptual illustration (Sapota fruits (Manilkara zapota)). It explains the idea and does not show study data.
View source evidence ↗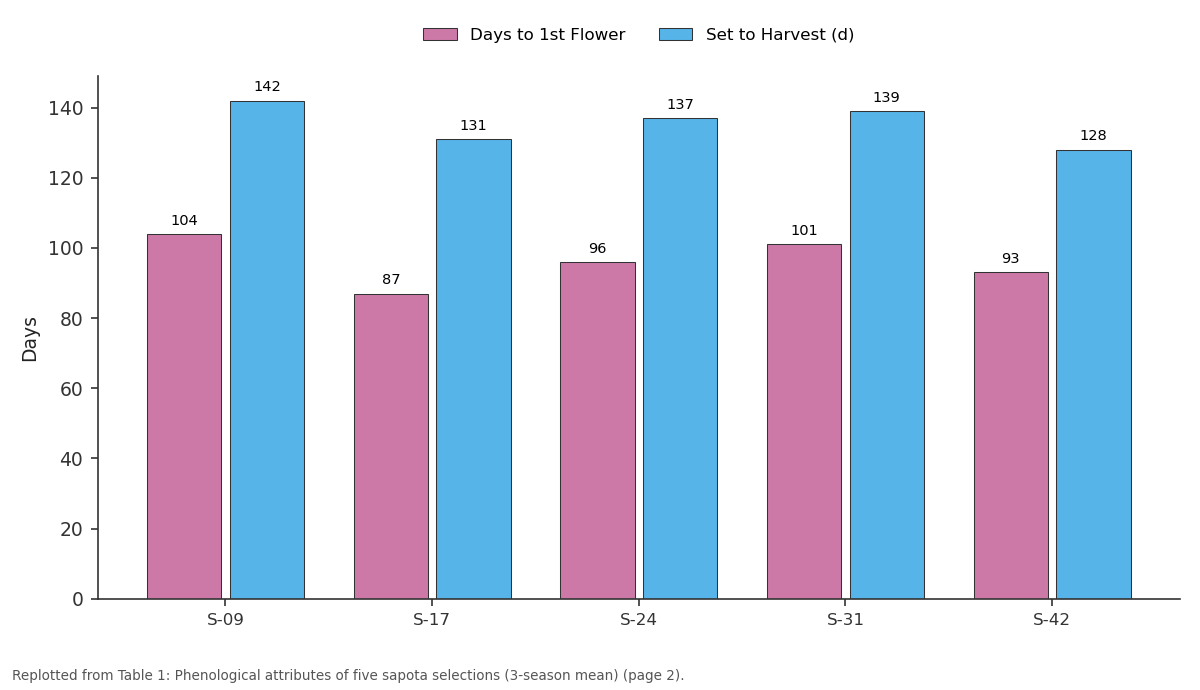
Days to 1st Flower and Set to Harvest (d): S-09 vs S-17 vs S-24 vs S-31 vs S-42
Replotted from Table 1 (page 2) of the original paper. Every bar is the paper's own table value.
View source evidence ↗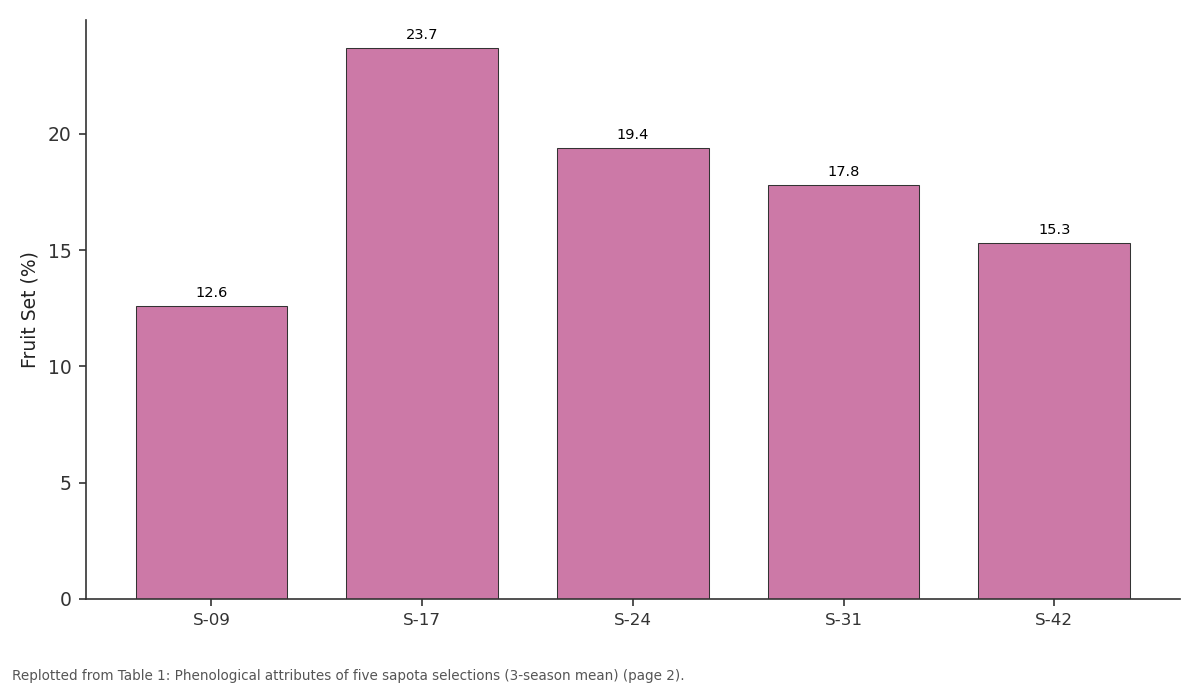
Fruit Set (%): S-09 vs S-17 vs S-24 vs S-31 vs S-42
Replotted from Table 1 (page 2) of the original paper. Every bar is the paper's own table value.
View source evidence ↗Figures & tables
From the original paper Table 1
 Table 2
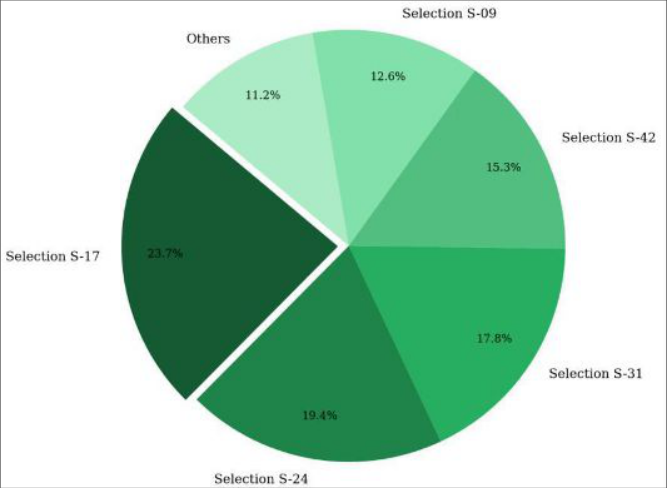 Figure 1
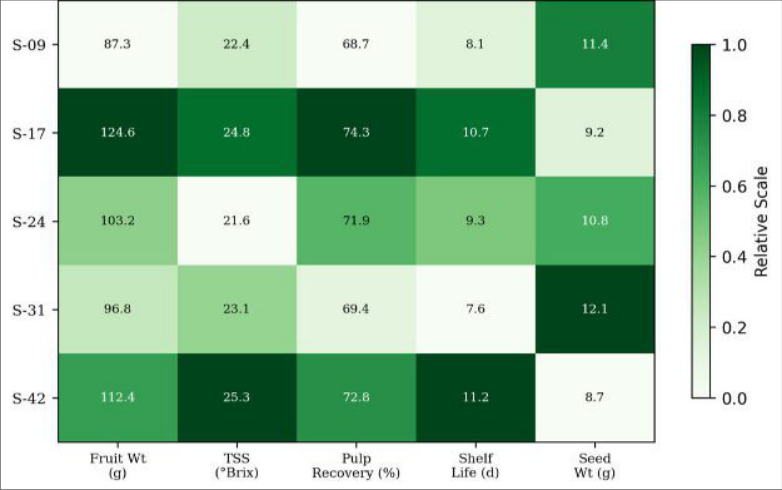 Figure 2
Introduction
Global sapota production crossed 7.8 million tonnes in 2022, yet the crop remains confined largely to subsistence orchards with limited varietal identity across Africa and parts of Latin America [2] . In South Africa, sapota has been grown as a dooryard fruit in Limpopo and Mpumalanga since the 1960s, but commercial interest only picked up after 2015 when supermarket chains started accepting the fruit for fresh retail [3] . The main bottleneck holding back expansion is the absence of locally selected, well-characterised cultivars suited to the subtropical conditions of the Limpopo basin. Phenological data flowering date, crop duration, harvest window are essential for orchard planning, especially in regions where sapota competes with mango and avocado for the same labour force during harvest months [4] . If flowering and maturity timings can be predicted reliably, growers can stagger plantings and spread labour demand. Pomological data, on the other hand, directly determine market acceptance: consumers in Johannesburg and Pretoria rate sweetness and texture above size, whereas export markets prioritise shelf life and uniformity [5] . Selection from open-pollinated seedling populations is the oldest and still one of the most effective breeding strategies for sapota, because the species is highly heterozygous and seedling progenies segregate widely for fruit quality [6] . India's leading cultivars Kalipatti, Cricket Ball and Pala were all identified through farmer and institutional selection rather than controlled hybridisation [7] . A similar approach was adopted at Limpopo Agricultural University in 2017, when a systematic evaluation programme was launched on 120 seedling accessions maintained in the departmental germplasm block. After four years of preliminary screening, five selections (coded S-09, S-17, S-24, S-31 and S-42) were shortlisted for advanced characterisation based on consistent fruit bearing, above-average fruit size and acceptable taste [8] . The present research reports detailed phenological and pomological data on these five selections recorded across three fruiting seasons, with the objective of identifying one or two superior genotypes ready for multi-location testing. A secondary aim was to quantify season-to-season variability in key quality traits so that breeders and growers can gauge the stability of each selection's performance.
By combining phenological timing data with fruit physicochemical analysis and sensory panel scores, this research attempts to give a rounded picture of each selection's potential as a commercial cultivar for subtropical South Africa.
Material and Methods
Material and Methods
Study area description
The research was carried out at the Subtropical Fruit Germplasm Block of Limpopo Agricultural University, Polokwane (23°54′S, 29°27′E; altitude 1 230 m). The site has a warm subtropical climate (Köppen Cwa) with a mean annual temperature of 19.4 °C and rainfall of 478 mm concentrated between October and March. Soils are deep, well-drained Hutton-form sandy loams with pH 6.2 and organic carbon of 0.87%. The germplasm block contains 120 sapota seedling accessions planted at 8 m × 8 m spacing, irrigated by micro-sprinklers delivering 40 L tree⁻¹ week⁻¹ during dry months.
Seasonal variations
Across the three fruiting seasons, rainfall during the flowering-to-harvest window (September-February) differed notably: 2021-22 received 412 mm, 2022-23 was drier at 347 mm, and 2023-24 saw 461 mm. Mean maximum temperature during fruit development was 29.1 °C in 2021-22, 30.4 °C in the drier year and 28.7 °C in the wettest season. These differences allowed the research to capture a realistic spread of environmental conditions against which selection stability could be judged.
Material
Five sapota selections S-09, S-17, S-24, S-31 and S-42 aged 11-13 years at the start of the trial were used. Each selection was represented by three trees maintained under uniform irrigation and fertilisation (200 g N, 100 g P₂O₅ and 200 g K₂O tree⁻¹ year⁻¹ split into two applications). Fruiting was recorded on all three trees per selection, but fruit quality samples were drawn from five fruits per tree per harvest, giving 15 fruits per selection per season. A handheld refractometer (ATAGO PAL-1, Tokyo) was used for TSS, and titratable acidity was measured by NaOH titration using phenolphthalein indicator. Sensory evaluation panels consisted of 12 semi-trained panellists from the department.
Methods
Phenological observations began when the first floral bud was visible on any scaffold branch and continued until the last fruit was harvested. Days to first flowering (from dormancy break, taken as 1 August), flowering span, percentage fruit set (counted on three tagged panicles per tree), days from fruit set to harvest maturity and total crop duration were recorded [9] . Harvest maturity was determined by a combination of skin colour change, slight softening at the apex and TSS exceeding 20 °Brix. Pomological measurements included individual fruit weight (digital balance, ±0.1 g), equatorial diameter and polar length (digital calliper), seed number and weight, pulp recovery percentage, TSS, titratable acidity (expressed as malic acid %) and pulp-to-seed ratio. Shelf life was assessed by storing 10 fruits per selection at ambient laboratory conditions (23-27 °C, 55-65% RH) and recording the day on which more than 50% of the batch showed visible spoilage or unacceptable softening [10] . Sensory evaluation used a 9-point hedonic scale for appearance, colour, sweetness, texture and overall acceptance. Data were analysed by two-way ANOVA (selection × season) in SAS 9.4, and means were separated by Duncan's multiple range test at P≤0.05. Phenological traits varied markedly among selections (Table 1). S-17 flowered earliest (87 days after dormancy break), and its short crop duration of 246 days makes it attractive for early-market windows. S-42 also showed a relatively quick cycle (248 days) despite starting flowering six days later than S-17. Fruit set was highest in S-17 at 23.7% and lowest in S-09 at 12.6%. The difference between selections was statistically significant in all three seasons (P<0.01). The pie chart in Figure 1 shows that S-17 alone accounted for 23.7% of the total fruit set recorded in the germplasm block, nearly twice the share of S-09 (12.6%). This dominance was stable across years, confirming the selection's reliably high reproductive output.
| Selection | Days to 1st Flower | Flower Span (d) | Fruit Set (%) | Set to Harvest (d) | Crop Duration (d) |
|---|---|---|---|---|---|
| S-09 | 104 | 31 | 12.6 | 142 | 277 |
| S-17 | 87 | 28 | 23.7 | 131 | 246 |
| S-24 | 96 | 33 | 19.4 | 137 | 266 |
| S-31 | 101 | 30 | 17.8 | 139 | 270 |
| S-42 | 93 | 27 | 15.3 | 128 | 248 |
Table text extracted from the original PDF; superscript letters are shown inline. The original table image is below.
View original table image
Results
Results
Comprehensive interpretation
When phenological and pomological data are combined, S-17 and S-42 emerge as the two most promising selections. S-17 offers early maturity, high fruit set and the largest fruit size, making it suitable for the fresh domestic market. S-42, with its superior sweetness, low acidity and 11-day shelf life, is better positioned for distant markets and possible export. The remaining three selections may still be useful as pollinator interspersions or for processing but are unlikely to compete at the commercial cultivar level.
Discussion
The fruit set percentages recorded here (12.6-23.7%) fall within the range reported for seedling sapota populations in India (10-28%) and slightly exceed values from Florida (8-18%), possibly because Polokwane's warm, insect-rich September-October window supports active pollination by midges and thrips [11] . S-17's consistent lead in fruit set
International Journal of Agriculture and Nutrition https://www.agriculturejournal.net across three seasons is an encouraging sign of genetic stability rather than a one-off environmental effect.
Fruit weight in S-17 (124.6 g) compares well with Kalipatti (120-140 g) and exceeds Cricket Ball (80-100 g), the two most widely grown Indian cultivars [7] . The TSS of S-42 (25.3 °Brix) is also noteworthy; it surpasses the 22-24 °Brix typical for Kalipatti and approaches levels found only in the Central American landrace Tikal [12] . High TSS, combined with low titratable acidity (0.26%), gives S-42 a sugar/acid balance that panellists rated very favourably. Shelf life differed by as much as 3.6 days between the best (S-42, 11.2 d) and worst (S-31, 7.6 d) selections. Because sapota is a climacteric fruit with a rapid post-harvest respiratory surge, even a two-day difference can determine whether the fruit reaches a distant retail shelf in acceptable condition [13] . The practical value of S-42's longer shelf life would need confirmation under cold-chain conditions, which this research did not test.
Season-to-season CV values were reassuringly low for TSS (3.1-5.8%) compared with fruit weight (8.4-12.7%). This aligns with the general finding that sugar metabolism in sapota is under stronger genetic control than cell enlargement, which responds more to water supply and temperature during the final swell phase [14] . The moderate seasonal CV for fruit weight should not discourage selection, but it does argue for multi-location trials before cultivar release to confirm that the genotype-byenvironment interaction remains manageable.
Conclusion
Conclusion
Acknowledgement
Acknowledgements Funding sourcesThis work was funded through the departmental research budget of the Department of Vegetable Science, Limpopo Agricultural University. No external grant was received. Institutional supportThe authors thank Limpopo Agricultural University for maintaining the germplasm block and providing laboratory facilities for fruit quality analysis.
Figures and tables from the paper
| Selection | Fruit Wt (g) | TSS (°Brix) | Acidity (%) | Pulp Rec. (%) | Shelf Life (d) | Sensory Score |
|---|---|---|---|---|---|---|
| S-09 | 87.3 | 22.4 | 0.34 | 68.7 | 8.1 | 6.8 |
| S-17 | 124.6 | 24.8 | 0.28 | 74.3 | 10.7 | 8.1 |
| S-24 | 103.2 | 21.6 | 0.37 | 71.9 | 9.3 | 7.4 |
| S-31 | 96.8 | 23.1 | 0.31 | 69.4 | 7.6 | 7.1 |
| S-42 | 112.4 | 25.3 | 0.26 | 72.8 | 11.2 | 8.3 |
Table text extracted from the original PDF; superscript letters are shown inline. The original table image is below.
View original table image
References
19 in the original paper- Hadebe Z, Maboko MM. Seedling-based sapota orchards in sub-Saharan Africa: status and opportunities. Afr J Hortic Sci. 2020;14(2):88-97.
- FAOSTAT. Production statistics for tropical minor fruits 2022. Rome: Food and Agriculture Organization; 2023.
- Malan PJ, Van Rooyen Z. Market entry of sapota in South African supermarket chains: a value-chain perspective. S Afr J Plant Soil. 2018;35(3):201-209.
- Ghosh SN, Bera B. Phenological behaviour of sapota cultivars under subtropical West Bengal conditions. J Crop Weed. 2015;11(1):146-151.
- Penter MG, Nkomo MM. Consumer preferences for tropical fruits in the Gauteng fresh market. Acta Hortic. 2019;1281:47-54.
- Patil DL, Musmade AM. Genetic variability in openpollinated sapota seedling populations. Indian J Genet Plant Breed. 2017;77(4):521-527.
- Rao VNM, Chandra R. The sapota. 3rd ed. New Delhi: Indian Council of Agricultural Research; 2014. p. 3461.
- Hadebe N, Hadebe Z. Preliminary selection of superior sapota genotypes at Limpopo Agricultural University. Fruits. 2021;76(5):238-244.
- Burondkar MM, Gunjate RT. Standardisation of phenological recording in sapota. Ann Plant Physiol. 2012;26(1):55-60.
- Parmar BR, Patel NL. Shelf life assessment of sapota varieties under ambient and cold storage. J Food Sci Technol. 2016;53(8):3243-3250.
- Mitra SK, Gurung MR. Pollination biology of sapota in the Eastern Himalayan region. Sci Hortic. 2008;118(3):210-216.
- Bose TK, Mitra SK. Fruits: tropical and subtropical. Vol. 2. Kolkata: Naya Udyog; 2001. p. 597-638.
- Lakshminarayana S, Subramanyam H. Post-harvest physiology of sapodilla fruit. Trop Agric. 1966;43(4):333-340.
- Menzel CM, Paxton BF. Environmental controls on fruit quality in sapodilla. Plant Soil. 2004;263(1):69-79.
- Nakasone HY, Paull RE. Tropical fruits. Wallingford: CABI Publishing; 1998. p. 304-318.
- Deshpande AB, Anamika K, Jha V. Metabolomic profiling of sapota pulp during ripening. Postharvest Biol Technol. 2017;128:136-145.
- Ghosh SN. Sapota. In: Fruit breeding for the tropics. Singapore: Springer; 2019. p. 263-281.
- Popenoe W. Manual of tropical and subtropical fruits. New York: Macmillan; 1920. p. 188-203.
- K, Earle ED. Nuclear DNA content of some important plant species. Plant Mol Biol Rep. 1991;9(3):208-218.