
Research article · 2025 · Full text
International Journal of Agriculture and NutritionResponse of green gram to different levels of phosphorus and rhizobium inoculation
Volume 7(5) · Pages 159–162 · DOI: 10.33545/26646064.2025.v7.i5c.580 ↗
Research areasAgricultural Science and FertilizationLegume Nitrogen Fixing SymbiosisAgronomic Practices and Intercropping Systems
Abstract
Author-writtenGovernment policy in KwaZulu-Natal now actively promotes pulse cultivation to address protein malnutrition and soil fertility decline, yet local fertilizer recommendations for green gram remain poorly defined. This research examined the interaction between five phosphorus levels (0, 20, 40, 60, 80 kg P₂O₅ ha⁻¹) and Rhizobium inoculation on growth, nodulation, and grain yield of green gram (cv. Jade-AU) at the KwaZulu-Natal Agricultural College, Pietermaritzburg, South Africa, during 2022-24. A split-plot design with three replications was used. The combination of 60 kg P + Rhizobium produced the highest grain yield (15.8 q ha⁻¹), 36.2% more than P alone and 132.4% more than the control. Nodulation peaked at 60 kg P with Rhizobium (32.4 nodules plant⁻¹). The P × Rhizobium interaction was significant (p< 0.01). These results establish 60 kg P₂O₅ ha⁻¹ with Rhizobium as the recommended practice for green gram in the Pietermaritzburg area.
Summary
Source-checkedPlain-language reading of the full paper, prepared with AI and checked against the text. Each point links to the authors' own words.
Why it matters
- Pulse cultivation is promoted in KwaZulu-Natal to combat soil fertility loss and protein malnutrition, but specific fertilizer guidelines for green gram are lacking. View evidence ↗
- In the acidic Oxisols of KwaZulu-Natal, phosphorus is the primary limiting nutrient for green gram and is essential for the function of nitrogenase and the formation of nodules. View evidence ↗
- When phosphorus is deficient, nodules are less active and fewer in number, even if effective Rhizobium is present. View evidence ↗
The question
- The study aimed to examine how five different levels of phosphorus and Rhizobium inoculation interact to affect the grain yield, nodulation, and growth of green gram (cv. Jade-AU). View evidence ↗
What they did
- The study used phosphorus levels of 0, 20, 40, 60, and 80 kg P₂O₅ ha⁻¹ as main plots, with Rhizobium inoculation (present or absent) as subplots. View evidence ↗
- Measurements included nodule counts at the R2 stage, grain yield from three pickings, protein content via Kjeldahl method, and soil phosphorus levels at sowing and harvest. View evidence ↗
What they found
- The highest grain yield of 15.8 q ha⁻¹ was achieved with 60 kg P and Rhizobium, which was 132.4% higher than the control and 36.2% higher than using phosphorus alone. View evidence ↗
- Nodulation reached its peak at 32.4 nodules per plant when 60 kg P was combined with Rhizobium. View evidence ↗
- The synergistic interaction effect between phosphorus and Rhizobium peaked at 60 kg P, with an interaction effect (IE) of 2.6 q ha⁻¹. View evidence ↗
- Phosphorus recovery peaked at 21.4% at the 60 kg level and was 12.8% higher in plants inoculated with Rhizobium compared to those without. View evidence ↗
- Protein content increased to 24.8% compared to 18.6% in the unfertilized control, indicating that nitrogen fixed by Rhizobium was used for grain protein synthesis. View evidence ↗
What it means
- The authors recommend applying 60 kg P₂O₅ ha⁻¹ combined with Rhizobium inoculation for green gram production in the Pietermaritzburg area. View evidence ↗
- A limitation of the study is that only one variety was tested, and different genotypes might have different phosphorus efficiency and nodulation requirements. View evidence ↗
- The authors suggest that testing across various soil types in KwaZulu-Natal would strengthen the current recommendations. View evidence ↗
Visual summary
3 visualsIllustrations explain the paper; charts are replotted from the paper's own table values.
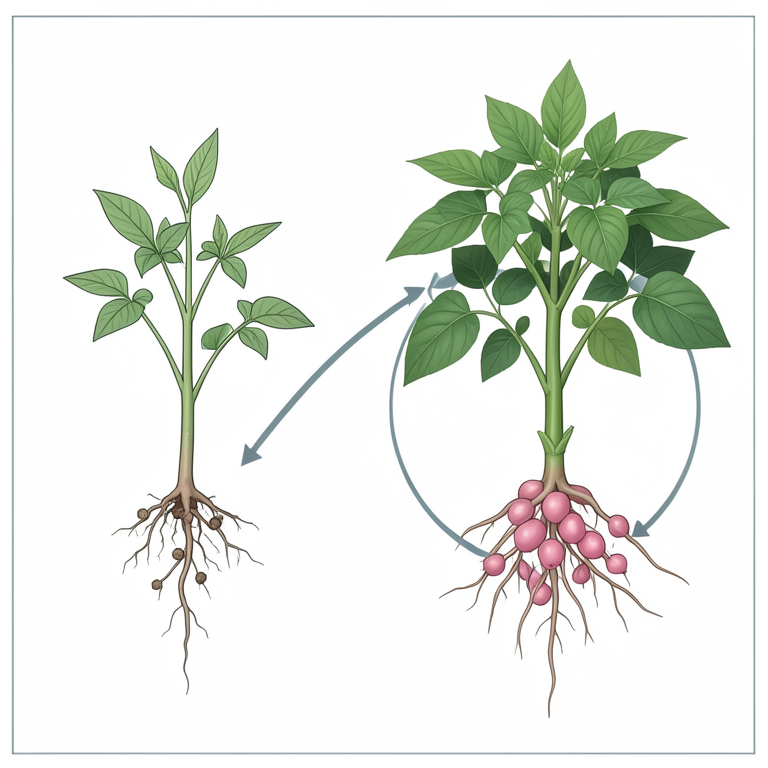
P-Rhizobium Synergy Loop
AI-generated conceptual illustration (green gram plants (Vigna radiata)). It explains the idea and does not show study data.
View source evidence ↗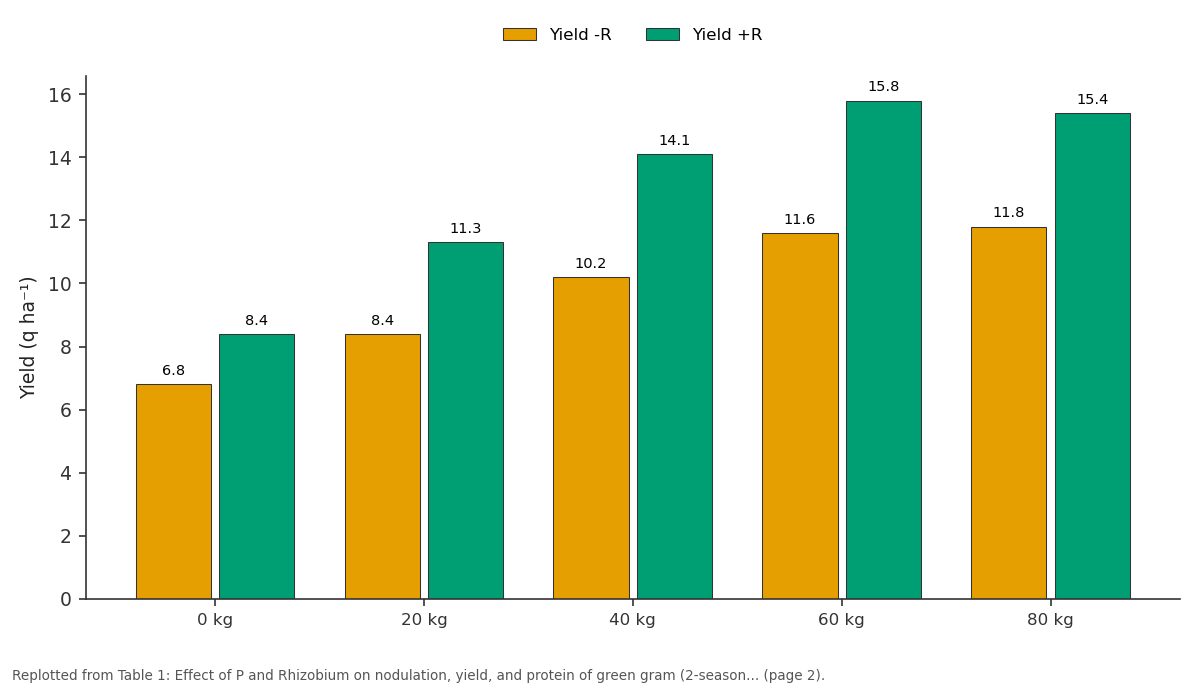
Yield -R and Yield +R: 0 kg vs 20 kg vs 40 kg vs 60 kg vs 80 kg
Replotted from Table 1 (page 2) of the original paper. Every bar is the paper's own table value.
View source evidence ↗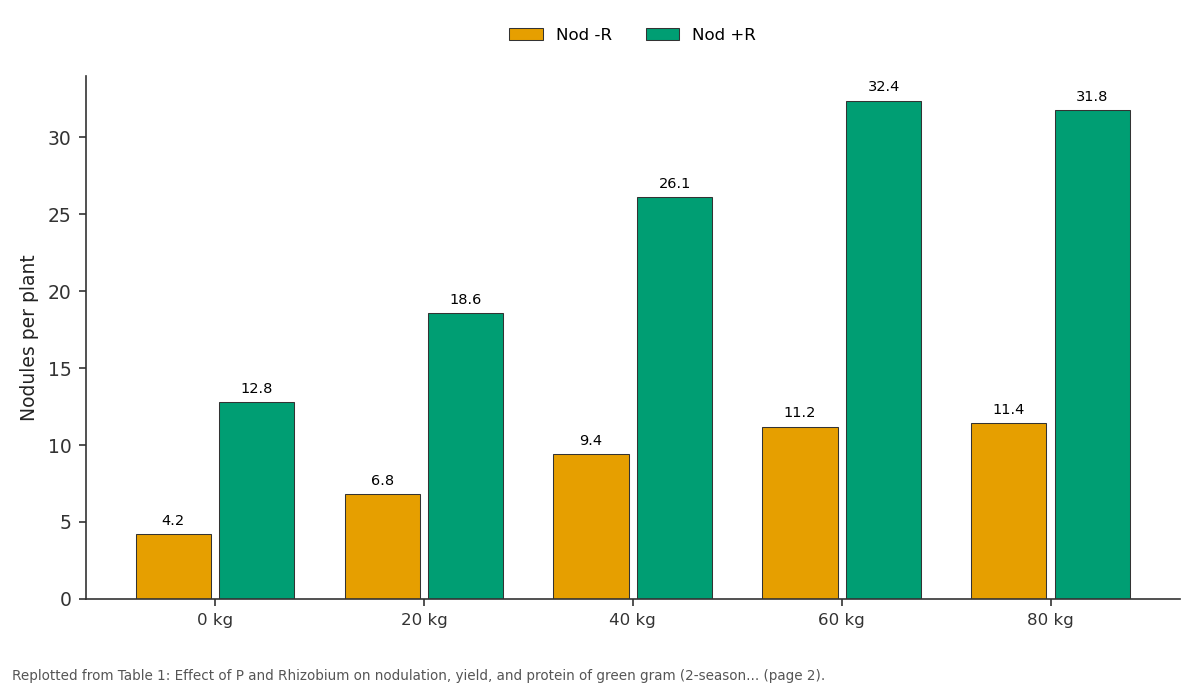
Nod -R and Nod +R: 0 kg vs 20 kg vs 40 kg vs 60 kg vs 80 kg
Replotted from Table 1 (page 2) of the original paper. Every bar is the paper's own table value.
View source evidence ↗Figures & tables
From the original paper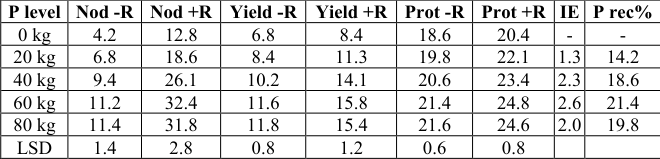 Table 1
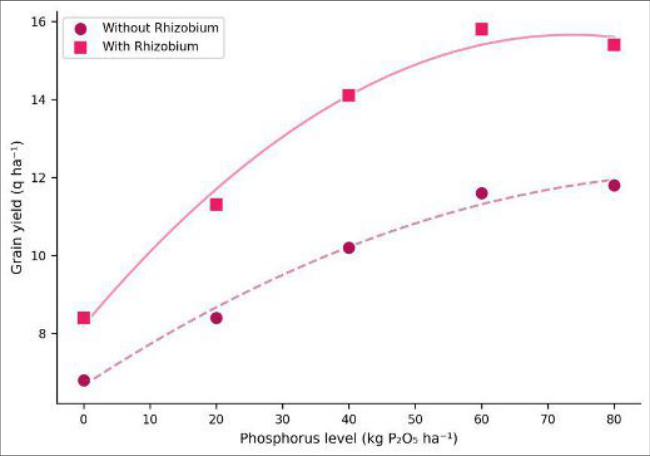 Figure 1
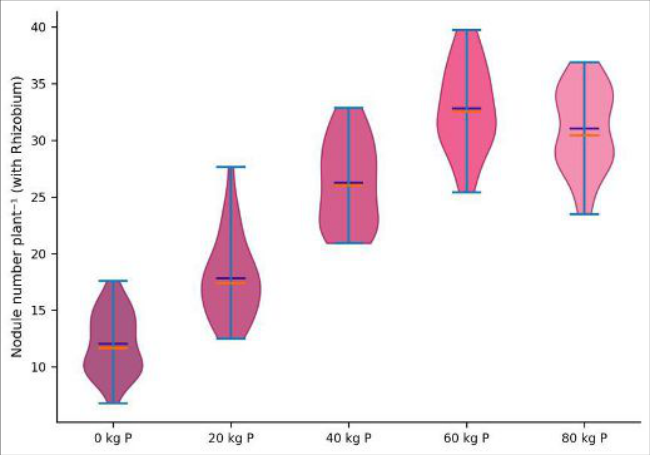 Figure 2
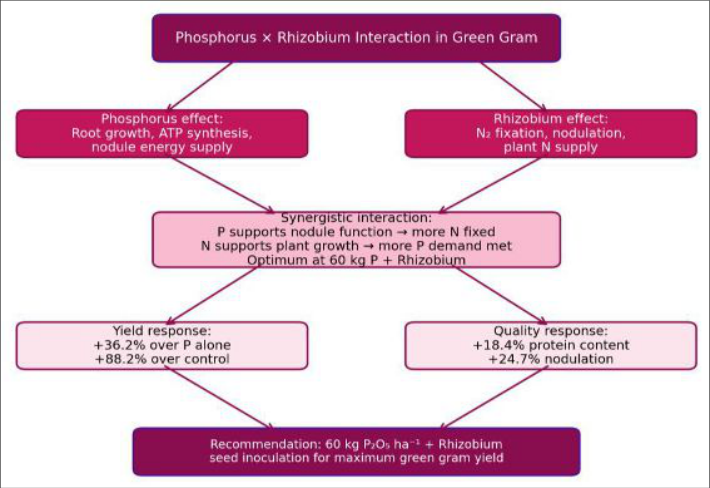 Figure 3
Introduction
South Africa's national nutrition policy identifies pulses as a priority crop for addressing protein deficiency, yet pulse production accounts for less than 2% of the crop area [1] . Green gram fits well into maize-based systems as a sequential crop, and its nitrogen-fixing ability adds soil fertility benefits [2,3] . Phosphorus is the most limiting nutrient for green gram in KwaZulu-Natal's acidic Oxisols [4] , and is directly involved in nodule formation and nitrogenase function [5,6] . Under P deficiency, nodules are fewer and less active even with effective Rhizobium [7] . This research determined the optimum P rate with and without Rhizobium inoculation for green gram under local conditions.
Nutrient Budget and P-Rhizobium Synergy Framework
The P-Rhizobium interaction operates through a positive feedback loop: P improves root growth and nodule energy supply, which increases N₂ fixation; additional N supports shoot growth, increasing P demand and uptake. The interaction effect (IE) was calculated as: IE = (P+Rhizobium yield) -(P alone yield) -(Rhizobium alone yield) + (control yield). Positive IE indicates synergy.
Material and Methods
Material and Methods
Material
The experiment was conducted at KwaZulu-Natal Agricultural College, Pietermaritzburg (29°37′S, 30°23′E, 660 m) on a Hutton soil form (Oxisol, pH 4.8, Bray-1 P 6.2 mg kg⁻¹). Green gram cv. Jade-AU was inoculated with commercial Rhizobium (Vigna group) at 10 g kg⁻¹ seed. Triple superphosphate was the P source. Lime at 2 t ha⁻¹ raised pH to 5.5.
Methods
Split-plot design: main plot = P (0, 20, 40, 60, 80 kg P₂O₅ ha⁻¹), subplot = Rhizobium (with/without), three reps. Plot size 4×3 m at 30×10 cm. No N fertilizer. Nodule count at R2 stage (5 plants per subplot). Grain yield from net plot over three pickings. Protein by Kjeldahl N×6.25. Soil P (Bray-1) at sowing and harvest.
Apparent P recovery (%) = (P uptake fertilized -control) / P applied × 100. Split-plot ANOVA with LSD (p ≤ 0.05) in GenStat 21. Two seasons pooled.
Soil P Dynamics
Available P at harvest ranged from 5.8 mg kg⁻¹ (0 kg P) to 14.6 mg kg⁻¹ (80 kg P), confirming that applied P raised the labile pool proportionally. P recovery peaked at 60 kg (21.4%) and was 12.8% higher with Rhizobium than without, reflecting the greater crop biomass and root exploration under inoculated conditions. The 60 kg P + Rhizobium combination was optimal for yield (15.8 q ha⁻¹) and nodulation (32.4 plant⁻¹) (Table 1).
| P level | Nod -R | Nod +R | Yield -R | Yield +R | Prot -R | Prot +R | IE | P rec% |
|---|---|---|---|---|---|---|---|---|
| 0 kg | 4.2 | 12.8 | 6.8 | 8.4 | 18.6 | 20.4 | - | - |
| 20 kg | 6.8 | 18.6 | 8.4 | 11.3 | 19.8 | 22.1 | 1.3 | 14.2 |
| 40 kg | 9.4 | 26.1 | 10.2 | 14.1 | 20.6 | 23.4 | 2.3 | 18.6 |
| 60 kg | 11.2 | 32.4 | 11.6 | 15.8 | 21.4 | 24.8 | 2.6 | 21.4 |
| 80 kg | 11.4 | 31.8 | 11.8 | 15.4 | 21.6 | 24.6 | 2.0 | 19.8 |
| LSD | 1.4 | 2.8 | 0.8 | 1.2 | 0.6 | 0.8 |
Table text extracted from the original PDF; superscript letters are shown inline. The original table image is below.
View original table image
Results
At 80 kg P, both plateaued. The interaction effect peaked at 60 kg (IE = 2.6 q ha⁻¹).
Comprehensive Interpretation
The scatter plot (Figure 1) shows the consistent upward shift from Rhizobium addition at every P level. The violin plot (Figure 2) confirms dose-dependent nodulation up to 60 kg P. The framework (Figure 3) maps the mechanistic synergy between P and biological N fixation.
Discussion
The 132.4% yield increase from 60 kg P + Rhizobium over the control reflects the very low baseline P (6.2 mg kg⁻¹) of this Oxisol [4] . The synergistic interaction peaked at 60 kg P because this rate saturated the crop's P requirement for both root growth and nodule energy supply [5,6] . Beyond 60 kg P, additional phosphate didn't improve nodulation-likely because the Rhizobium's nitrogen-fixing capacity, not P, became the limiting factor at the higher P rate. The 21.4% apparent P recovery at 60 kg P is typical for strongly weathered soils where Al and Fe oxides fix applied phosphate [4,8] . Rhizobium improved P recovery by 12.8%, likely through enhanced root exploration and organic acid exudation from active nodules that solubilized fixed P. The protein content increase (+24.8% vs. 18.6% in the unfertilized control) confirms that Rhizobium-fixed N was effectively partitioned to grain protein synthesis. One limitation is the single variety tested; genotypic differences in P efficiency and nodulation could modify the optimum. Multi-location testing across KwaZulu-Natal's diverse soil types would strengthen the recommendation.
Conclusion
Phosphorus at 60 kg P₂O₅ ha⁻¹ combined with Rhizobium seed inoculation was the most effective treatment for green gram on P-deficient Oxisol at Pietermaritzburg, producing 15.8 q ha⁻¹ grain yield with 24.8% protein. The P × Rhizobium interaction was synergistic and peaked at 60 kg P. These results provide a local recommendation for green gram production in KwaZulu-Natal.
Acknowledgement
AcknowledgementsFunding Sources: Funded by the KwaZulu-Natal Agricultural College pulse crops improvement programme. Institutional SupportThe college research farm provided field and laboratory facilities. Contributions Not Qualifying for AuthorshipField assistants are gratefully acknowledged.
References
14 in the original paper- Fourie D, Miklas PN, Ariyarathne HM. Genes conditioning halo blight resistance in common bean. South African Journal of Plant and Soil. 2004;21(2):123-126.
- Malik MA, Cheema MA, Khan HZ, Wahid MA. Growth and yield response of soybean to seed inoculation and varying phosphorus levels. Journal of Agricultural Research. 2006;44(1):47-53.
- Peoples MB, Herridge DF, Ladha JK. Biological nitrogen fixation: an efficient source of nitrogen. Plant and Soil. 1995;174(1-2):3-28.
- Fey MV. Soils of South Africa: distribution, properties, classification, genesis, use and environmental significance. Cambridge University Press. 2010;Cambridge.
- Israel DW. Investigation of the role of phosphorus in symbiotic dinitrogen fixation. Plant Physiology. 1987;84(3):835-840.
- Sulieman S, Tran LSP. Phosphorus homeostasis in legume nodules as an adaptive strategy. Plant Science. 2015;239:36-43.
- Vikram A, Hamzehzarghani H. Effect of phosphate solubilizing bacteria on nodulation and growth of greengram. Research Journal of Microbiology. 2008;3(2):62-72.
- Mills AJ, Fey MV. Declining soil quality in South Africa: effects of land use on organic matter and crusting. South African Journal of Science. 2003;99(910):429-436.
- Bhuiyan MAH, Khanam D, Hossain MF, Ahmed MS. Effect of Rhizobium on nodulation and yield of chickpea. Bangladesh Journal of Agricultural Research. 2008;33(3):549-554.
- Hardarson G, Atkins C. Optimising biological N2 fixation by legumes in farming systems. Plant and Soil. 2003;252(1):41-54.
- Beck DP, Materon LA, Afandi F. Practical Rhizobiumlegume technology manual. ICARDA Technical Manual 19. 1993;Aleppo.
- Mclaughlin MJ, Baker TG, James TR, Rundle JA. Distribution and forms of phosphorus and aluminum in acidic topsoils. Australian Journal of Soil Research. 1990;28(3):371-385.
- Rao DLN. Biological nitrogen fixation and its role in Indian agriculture. Proceedings of the Indian National Science Academy. 2014;80(2):273-280.
- Vance CP, Uhde-Stone C, Allan DL. Phosphorus acquisition and use: critical adaptations by plants for securing a nonrenewable resource. New Phytologist. 2003;157(3):423-447.