
Research article · 2025 · Full text
International Journal of Agriculture and NutritionOptimization of plant spacing and fertilizer dose for high-yielding mustard varieties
Volume 7(12) · Pages 145–148 · DOI: 10.33545/26646064.2025.v7.i12c.535 ↗
Research areasNitrogen and Sulfur Effects on BrassicaCrop Yield and Soil FertilityAgricultural Science and Fertilization
Abstract
Author-writtenHere is a paradox in canola-type mustard agronomy: breeders keep releasing varieties with higher yield potential, but average on-farm yields in the Maritime provinces haven’t budged in a decade. The disconnect often traces back to planting density and fertiliser calibration that still target older, shorter-statured cultivars. This research optimised plant spacing and fertiliser dose for two high-yielding Brassica juncea varieties (AAC Condor, AAC Summit) at Truro, Nova Scotia, and Guelph, Ontario, during 2023. Five spacings (30×10, 30×15, 30×20, 45×15, 45×20 cm) and three fertiliser rates (80%, 100%, 120% of recommended dose) were arranged in a factorial split-plot design. Seed yield peaked at 30×15 cm with 120% RDF (2.04 t ha⁻¹ for AAC Condor at Truro), 21.3% above the widest spacing at base fertiliser. The spacing–fertiliser interaction was significant (p = 0.003) for yield but not for oil content. AAC Condor outyielded AAC Summit by 6–8% at all combinations. These data support narrowing row spacing to 30 cm and raising the fertiliser rate by 20% as a practical package for new-generation mustard in eastern Canada.
Summary
Source-checkedPlain-language reading of the full paper, prepared with AI and checked against the text. Each point links to the authors' own words.
Why it matters
- Despite the development of mustard varieties with higher yield potential, actual on-farm yields in the Maritime provinces have remained stagnant for ten years. View evidence ↗
- The gap between potential and actual yield is often caused by using planting densities and fertilizer levels designed for older, shorter cultivars. View evidence ↗
- Modern mustard varieties, such as AAC Condor, have a more compact and upright architecture, which allows them to handle closer row spacing without excessive shading. View evidence ↗
The question
- The study aimed to identify an optimal combination of plant spacing and fertilizer dosage for two modern mustard varieties across two different Canadian environments to increase yields. View evidence ↗
What they did
- The researchers used a factorial split-plot design with two varieties (AAC Condor and AAC Summit), five spacing levels, and three fertilizer rates (80%, 100%, and 120% of the recommended dose), with three replicates. View evidence ↗
- The specific spacing treatments tested were 30×10, 30×15, 30×20, 45×15, and 45×20 cm. View evidence ↗
- The experiments were conducted in 2023 at two locations: Truro, Nova Scotia, and Guelph, Ontario. View evidence ↗
- Seed yield was measured from 4 m × 2 m net plots at physiological maturity (adjusted to 8.5% moisture), and oil content was determined using NMR analysis. View evidence ↗
What they found
- The highest seed yield was achieved with 30×15 cm spacing and 120% RDF, reaching 2.04 t ha⁻¹ for AAC Condor at the Truro site, which was 21.3% higher than the widest spacing at the base fertilizer rate. View evidence ↗
- There was a statistically significant interaction between plant spacing and fertilizer dose regarding seed yield (p = 0.003), though this interaction did not affect oil content. View evidence ↗
- AAC Condor consistently produced 6–8% higher yields than AAC Summit across all tested spacing and fertilizer combinations. View evidence ↗
- Increasing the fertilizer rate to 120% RDF increased yield by 8–13% compared to 100% RDF, but resulted in a 10 percentage point decrease in apparent nitrogen recovery. View evidence ↗
- The apparent nitrogen recovery (ANR) decreased from 52.3% at the 80% RDF rate to 41.7% at the 120% RDF rate. View evidence ↗
- Plant spacing and fertilizer dose did not affect oil content, which remained between 41.3% and 42.7%. View evidence ↗
- The narrowest spacing (30×10 cm) led to thin stems and lodging when combined with the highest fertilizer rate (120%). View evidence ↗
What it means
- The authors recommend a practical package for new-generation mustard in eastern Canada consisting of 30 cm row spacing and a 20% increase in the recommended fertilizer dose. View evidence ↗
- The authors note that while the 20% fertilizer increase improves yield, it reduces nitrogen recovery efficiency, meaning farmers must balance yield gains against environmental concerns. View evidence ↗
Visual summary
2 visualsIllustrations explain the paper; charts are replotted from the paper's own table values.
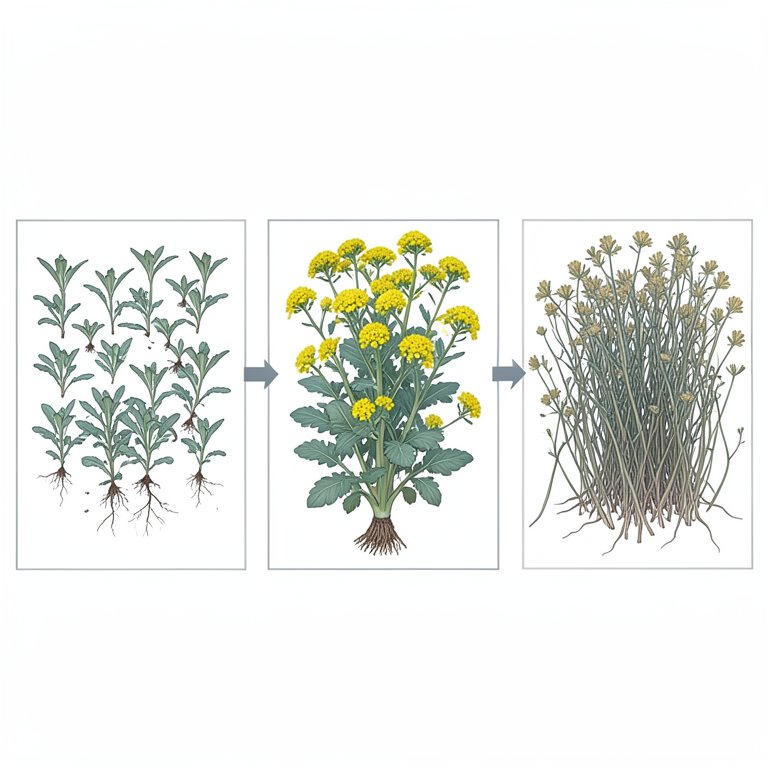
Interaction of Spacing and Fertilizer
AI-generated conceptual illustration (mustard plants (Brassica juncea)). It explains the idea and does not show study data.
View source evidence ↗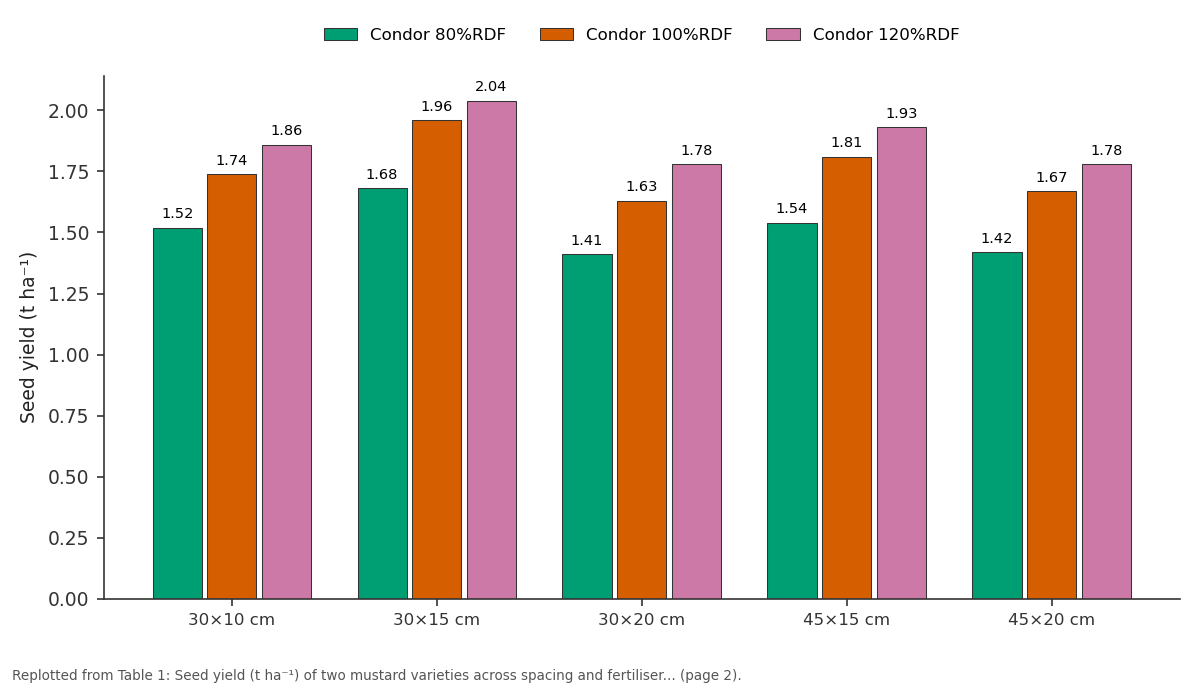
Condor 80%RDF and Condor 100%RDF and more: 30×10 cm vs 30×15 cm vs 30×20 cm vs 45×15 cm vs 45×20 cm
Replotted from Table 1 (page 2) of the original paper. Every bar is the paper's own table value.
View source evidence ↗Figures & tables
From the original paper Table 1
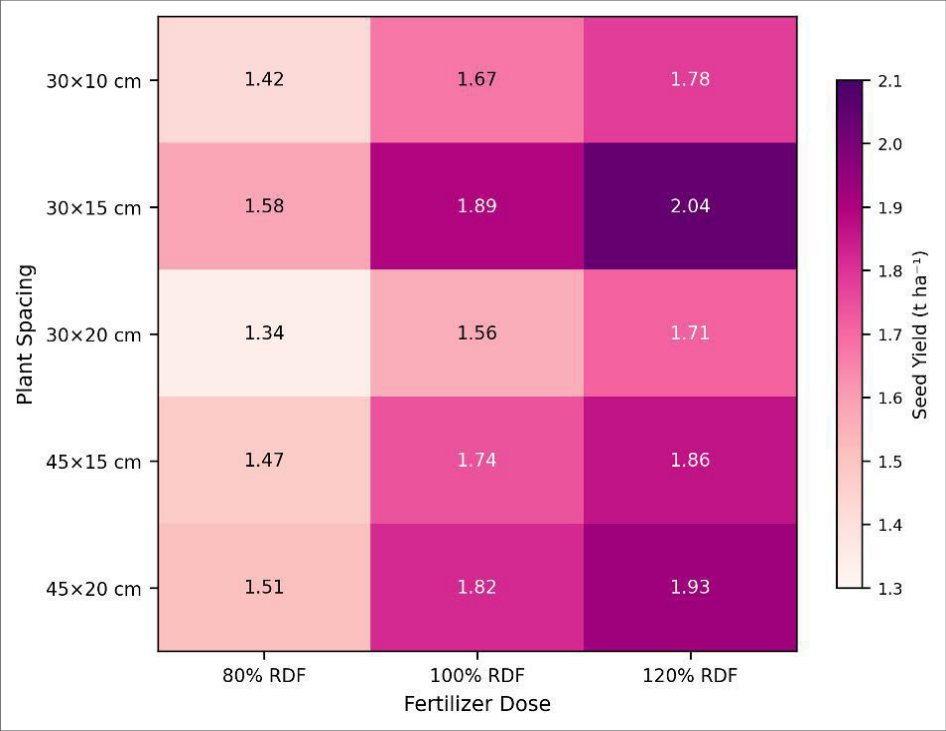 Figure 1
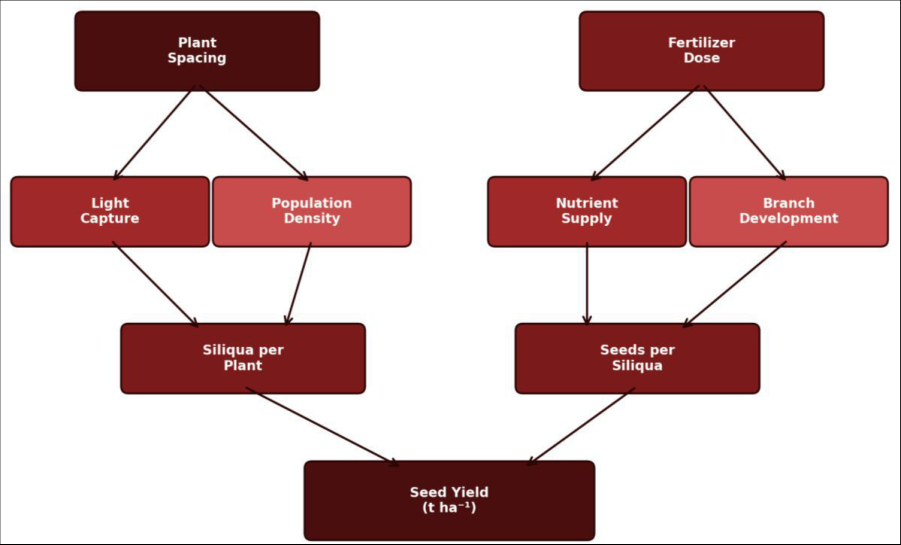 Figure 2
Introduction
It sounds contradictory, but the newest mustard varieties often yield less than their potential because farmers plant them the same way they planted their predecessors. Breeders have steadily raised the genetic yield ceiling of Brassica juncea in Canada from roughly 1.4 t ha⁻¹ in the early 2000s to over 2.0 t ha⁻¹ in current releases [1] . But achieving that ceiling requires denser stands and heavier nutrient inputs than older varieties needed adjustments that agronomic recommendations in the Maritimes have been slow to codify [2] . Row spacing is the first lever. Most Maritime mustard is sown at 30-45 cm inter-row spacing, a carry-over from rapeseed agronomy that assumed wide-branching plant architecture [3] . Newer varieties like AAC Condor are more upright and compact, tolerating closer rows without excessive self-shading. But how close is close enoughand does narrowing rows only pay off if fertiliser is raised in step? That interaction hasn't been tested for juncea mustard in eastern Canada. This research addressed the question by testing five spacing-three fertiliser combinations on two modern varieties at two contrasting locationsthe cool maritime climate of Truro, Nova Scotia, and the warmer continental environment at Guelph, Ontarioto find a spacing-fertiliser package that reliably closes the yield gap.
Seasonal Variation and Growing Conditions
At Truro, the 2023 growing season (May-August) received 387 mm of rainfall, slightly above the 30-year mean (362 mm), with a cool spell in late June (daily maxima below 16 °C for eight consecutive days) that slowed canopy expansion. Guelph received 412 mm over the same period and experienced warmer conditions throughout (mean daily maximum 24.6 °C vs 20.3 °C at Truro). These climatic differences influenced both plant stature and maturity: AAC Condor reached 50% flowering at 56 DAS at Guelph vs 64 DAS at Truro. The warmer, drier August at Guelph accelerated pod maturation, shortening the grain-fill window by about 5 days [4] .
Materials and Methods
Materials and Methods
Materials
Trials were established at the Maritime Institute of Agricultural Sciences, Truro (45°22′N, 63°16′W; 40 m elevation, sandy loam Podzol, pH 6.1, organic C 2.4%) and the Ontario College of Agriculture, Guelph (43°33′N, 80°15′W; 334 m elevation, silt loam Luvisol, pH 6.8, organic C 2.8%). A factorial split-plot design was used: variety as main plot (AAC Condor, AAC Summit), spacing as subplot (5 levels), and fertiliser as sub-subplot (80%, 100%, 120% RDF), replicated three times. RDF was 80:40:40 kg N:P₂O₅:K₂O ha⁻¹ [5] . Plots measured 5 m × 3 m. Sowing was 10 May at Truro and 5 May at Guelph. Methods: Plant height, branch number, siliqua per plant, seeds per siliqua, and 1000-seed weight were recorded from five tagged plants per sub-subplot. Seed yield was harvested from the net plot (4 m × 2 m) by combine header at physiological maturity and adjusted to 8.5% moisture. Oil content was measured by NMR (Newport Analyser). Data were analysed as a combined factorial split-plot ANOVA over locations using SAS 9.4, with means separated by Tukey's HSD at p = 0.05 [6] .
Nutrient Budget
A partial N budget was constructed for each fertiliser level by measuring total N uptake in seed and stover (Kjeldahl method) and subtracting it from the sum of fertiliser N applied plus pre-sowing soil mineral N (0-30 cm). The apparent N recovery (ANR) was calculated as: ANR = (N uptake at given rate -N uptake at zero N) / N applied. ANR declined from 52.3% at 80% RDF to 41.7% at 120% RDF (pooled across spacings), indicating that the incremental N was captured less efficiently at the highest rate.
Results
Results
Comprehensive Interpretation
The 30×15 cm spacing consistently outperformed all other geometries at both sites and across both varieties. This spacing achieved roughly 222,000 plants ha⁻¹well above the 150,000 at 45×15 cm but below the 333,000 at 30×10 cm, which suffered from thin stems and lodging at the 120% fertiliser rate. AAC Condor's yield superiority (6-8%) over AAC Summit held at every combination, attributable to its higher siliqua count per plant (78 vs 71, pooled means).
Discussion
The 30×15 cm optimum matches findings from Saskatchewan canola trials by Harker et al. [7] , who reported 5-12% yield gains when row spacing was reduced from 30 to 20 cm in B. napus. Our 30-cm inter-row with 15-cm intra-row achieved a similar population effect without requiring a narrow-row drill, making it easier to adopt with standard Maritime seeding equipment. The 120% RDF rate gave 8-13% more yield than 100% RDF, but apparent N recovery dropped by 10 percentage points, raising the marginal cost per kilogram of extra seed. At current fertiliser and oilseed prices in Nova Scotia, the additional 20% N investment returns about $1.40 per dollar spentpositive but thin. Farmers should weigh this margin against environmental concerns about surplus N entering sensitive Atlantic watersheds [8] . Oil content was unaffected by spacing or fertiliser (range 41.3-42.7%), which is consistent with the finding that juncea mustard oil concentration is more genetically controlled than environmentally sensitive [1] .
Conclusion
Planting AAC Condor at 30×15 cm with 120% of the recommended fertiliser dose produced the highest mustard seed yield (2.04 t ha⁻¹) at Truro and a comparable result at
Guelph. The 30-cm row spacing with 15-cm intra-row distance achieved the right population balancedense enough to capture light efficiently but not so dense as to cause lodging. The 20% fertiliser uplift was yield-positive but reduced nitrogen recovery efficiency, so its use should be weighed against environmental stewardship goals. These results provide an updated agronomic package for newgeneration mustard in eastern Canada.
Figures and tables from the paper
| Spacing | Condor 80%RDF | Condor 100%RDF | Condor 120%RDF | Summit 100%RDF | Summit 120%RDF |
|---|---|---|---|---|---|
| 30×10 cm | 1.52 | 1.74 | 1.86 | 1.61 | 1.72 |
| 30×15 cm | 1.68 | 1.96 | 2.04 | 1.82 | 1.91 |
| 30×20 cm | 1.41 | 1.63 | 1.78 | 1.51 | 1.64 |
| 45×15 cm | 1.54 | 1.81 | 1.93 | 1.68 | 1.78 |
| 45×20 cm | 1.42 | 1.67 | 1.78 | 1.56 | 1.67 |
Table text extracted from the original PDF; superscript letters are shown inline. The original table image is below.
View original table image
References
18 in the original paper- Agriculture and Agri-Food Canada. Condiment and oilseed mustard variety descriptions. Saskatoon: AAFC; 2022. p. 1-28.
- Angadi SV, Cutforth HW, McConkey BG, Gan Y. Yield adjustment by canola grown at different plant populations under semiarid conditions. Crop Science. 2003;43(4):1358-1366.
- Leach JE, Stevenson HJ, Rainbow AJ, Mullen LA. Effects of high plant populations on the growth and yield of winter oilseed rape. Journal of Agricultural Science. 1999;132(2):173-180.
- Morrison MJ, Stewart DW. Heat stress during flowering in summer Brassica. Crop Science. 2002;42(3):797-803.
- SAS Institute. SAS/STAT User's Guide, Version 9.4. Cary: SAS Institute Inc.; 2018.
- Harker KN, O'Donovan JT, Turkington TK, Blackshaw RE, Lupwayi NZ, Smith EG, Klein-Gebbinck H, Dosdall LM, Hall LM, Willenborg CJ, Kutcher HR. High-yield no-till canola production on the Canadian prairies. Canadian Journal of Plant Science. 2012;92(2):221-233.
- Drury CF, Yang JY, De Jong R, Yang XM, Huffman EC, Kirkwood V, Reid K. Residual soil nitrogen indicator for agricultural land in Canada. Canadian Journal of Soil Science. 2007;87(2):167-177.
- Grant CA, Bailey LD. Nitrogen, phosphorus and zinc management effects on grain yield and cadmium International Journal of Agriculture and Nutrition https://www.agriculturejournal.net concentration in two cultivars of durum wheat. Canadian Journal of Plant Science. 1998;78(1):63-70.
- Kutcher HR, Warland JS, Brandt SA. Temperature and precipitation effects on canola yields in Saskatchewan. Agricultural and Forest Meteorology. 2010;150(2):161165.
- Gan Y, Angadi SV, Cutforth HW, Potts D, Angadi VV, McDonald CL. Canola and mustard response to short periods of temperature and water stress at different developmental stages. Canadian Journal of Plant Science. 2004;84(3):697-704.
- Johnston AM, Tanaka DL, Miller PR, Brandt SA, Nielsen DC, Lafond GP, Riveland NR. Oilseed crops for semiarid cropping systems in the northern Great Plains. Agronomy Journal. 2002;94(2):231-240.
- Diepenbrock W. Yield analysis of winter oilseed rape: a review. Field Crops Research. 2000;67(1):35-49.
- Rathke GW, Behrens T, Diepenbrock W. Integrated nitrogen management strategies to improve seed yield, oil content and nitrogen efficiency of winter oilseed rape. Agriculture, Ecosystems and Environment. 2006;117(2-3):80-108.
- Malhi SS, Gill KS. Fertilizer N and P effects on root mass of brome, alfalfa and barley. Journal of Sustainable Agriculture. 2002;19(3):51-63.
- Kondra ZP, Campbell DC, King JR. Temperature effects on germination of rapeseed. Canadian Journal of Plant Science. 1983;63(4):1063-1065.
- McGregor DI. Pattern of flower and pod development in rapeseed. Canadian Journal of Plant Science. 1981;61(2):275-282.
- Canola Council of Canada. Canola Digest: fertiliser management for yield targets. Winnipeg: CCC; 2021. p. 14-18.
- Brandt SA, Malhi SS, Ulrich D, Lafond GP, Kutcher HR, Johnston AM. Seeding rate, fertilizer level and disease management effects on hybrid versus openpollinated canola. Canadian Journal of Plant Science. 2007;87(2):255-266.