
Research article · 2025 · Full text
International Journal of Agriculture and NutritionSoil carbon sequestration potential under different land use systems in tropical highlands
Volume 7(11) · Pages 172–175 · DOI: 10.33545/26646064.2025.v7.i11c.499 ↗
Research areasSoil Carbon and Nitrogen DynamicsSoil erosion and sediment transportSoil Geostatistics and Mapping
Abstract
Author-writtenHow much carbon can tropical highland soils hold, and does the type of land use determine the answer? This research quantified soil organic carbon (SOC) stocks and sequestration rates under six land use systems in the highlands of Johor, Malaysia, between 2021 and 2023. Soil samples were collected at 0-15 cm and 15-30 cm depths from natural forest, rubber plantation, oil palm plantation, rubber-based agroforestry, annual crops (paddy-vegetable rotation), and degraded grassland. Natural forest held the highest carbon stock at 86.2 Mg C/ha in the top 30 cm, followed by agroforestry at 67.8 Mg/ha. Degraded grassland stored the least at 26.8 Mg/ha. Microbial biomass carbon and potentially mineralizable nitrogen mirrored the SOC rankings. Conversion of forest to annual cropping reduced soil carbon stocks by 57.8%, while agroforestry retained 78.6% of the forest carbon. These findings support agroforestry as a land use strategy that balances agricultural production with meaningful carbon sequestration in tropical highland landscapes.
Summary
Source-checkedPlain-language reading of the full paper, prepared with AI and checked against the text. Each point links to the authors' own words.
Why it matters
- Global soils store approximately 2,500 Gt of organic carbon, with tropical soils contributing a significant portion due to high biomass production and litter input driven by warm, humid climates. View evidence ↗
- The highlands of Johor, Malaysia, are undergoing rapid land use changes as secondary forests and mixed agroforestry are replaced by oil palm and rubber plantations. View evidence ↗
The question
- The study aimed to evaluate the carbon sequestration potential of six different land use systems by comparing their soil organic carbon stocks, labile carbon fractions, and microbial activity indicators. View evidence ↗
What they did
- The research was conducted in the highlands of Johor, Malaysia, between 2021 and 2023, focusing on six distinct land use systems. View evidence ↗
- Soil samples were collected in March 2022 and March 2023 at depths of 0-15 cm and 15-30 cm, using five composite samples per site, each consisting of four sub-samples within a 10 m radius. View evidence ↗
- The study measured SOC using the Walkley-Black method, MBC via chloroform fumigation-extraction, PMN through 7-day anaerobic incubation at 40°C, and labile carbon using 333 mM KMnO₄. View evidence ↗
- Carbon sequestration rates were estimated using a paired-site chronosequence approach relative to a forest reference, with data analyzed via ANOVA in a completely randomized design with five replications. View evidence ↗
What they found
- Natural forest exhibited the highest soil organic carbon (SOC) at both measured depths and the largest overall carbon stock of 86.2 Mg/ha. View evidence ↗
- Agroforestry systems had the second-highest carbon stock at 67.8 Mg/ha, which represents 78.6% of the carbon found in natural forests. View evidence ↗
- Soil bulk density increased as land use intensity rose, ranging from 1.08 Mg/m³ in natural forests to 1.34 Mg/m³ in degraded grasslands. View evidence ↗
- Agroforestry showed the highest carbon sequestration rate at 1.46 Mg/ha/yr, which was higher than rubber (1.24 Mg/ha/yr) and oil palm (0.87 Mg/ha/yr) plantations. View evidence ↗
- Across all land use systems, the topsoil layer (0-15 cm) contained 61-64% of the total carbon stock found in the top 30 cm. View evidence ↗
- A strong positive correlation (r = 0.96) between microbial biomass carbon (MBC) and SOC indicates that MBC is a sensitive indicator of soil carbon status. View evidence ↗
- Converting natural forest to annual cropping resulted in a 57.8% reduction in soil carbon stocks. View evidence ↗
What it means
- While natural forests have the most carbon, rubber-based agroforestry is the most effective productive land use for matching forest carbon levels while maintaining crop production. View evidence ↗
- To conserve soil carbon, the authors recommend that Malaysian highland policy promote agroforestry and discourage the conversion of tree-based systems into annual crops. View evidence ↗
- The authors suggest that periodic soil carbon monitoring every 5 to 10 years is necessary to track sequestration trends across different management regimes. View evidence ↗
Visual summary
3 visualsIllustrations explain the paper; charts are replotted from the paper's own table values.
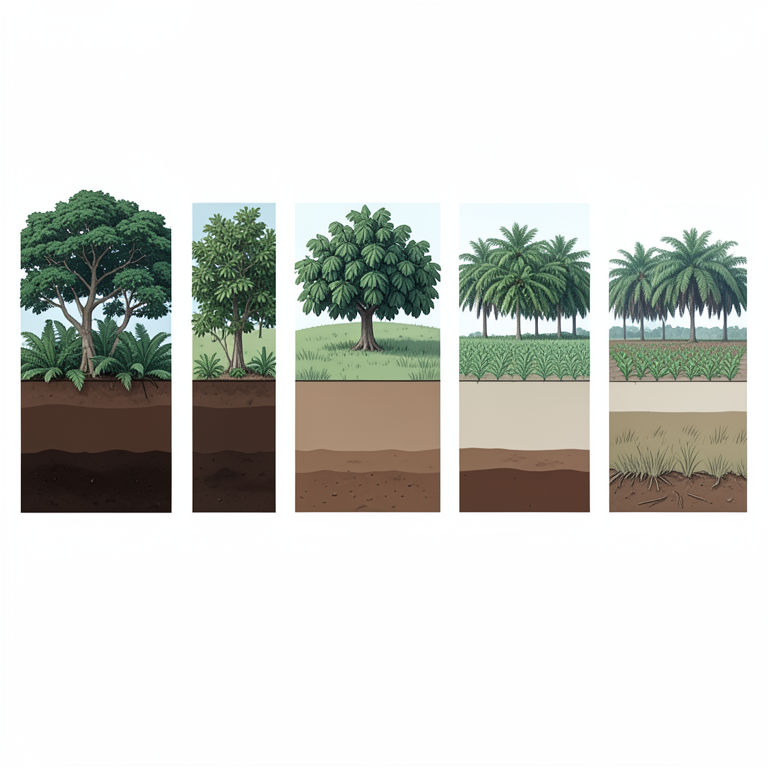
Comparison of Carbon Stocks by Land Use
AI-generated conceptual illustration (Tropical highland soil profiles under different land use systems). It explains the idea and does not show study data.
View source evidence ↗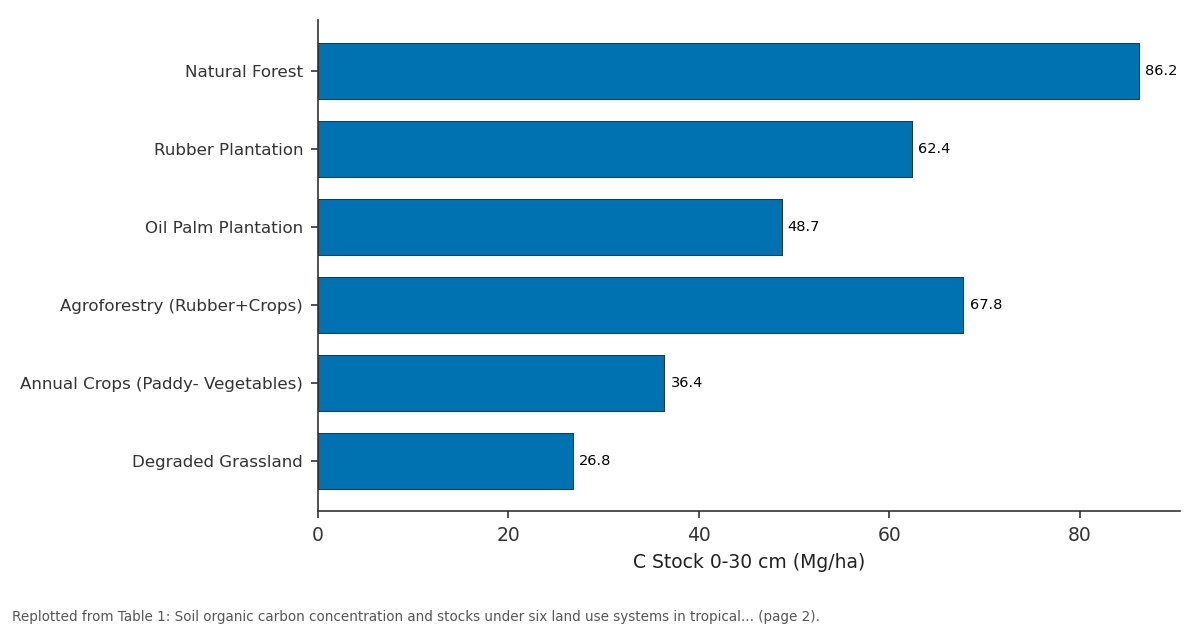
C Stock 0-30 cm (Mg/ha): Natural Forest vs Rubber Plantation vs Oil Palm Plantation vs Agroforestry... vs Annual Crops (Paddy-...
Replotted from Table 1 (page 2) of the original paper. Every bar is the paper's own table value.
View source evidence ↗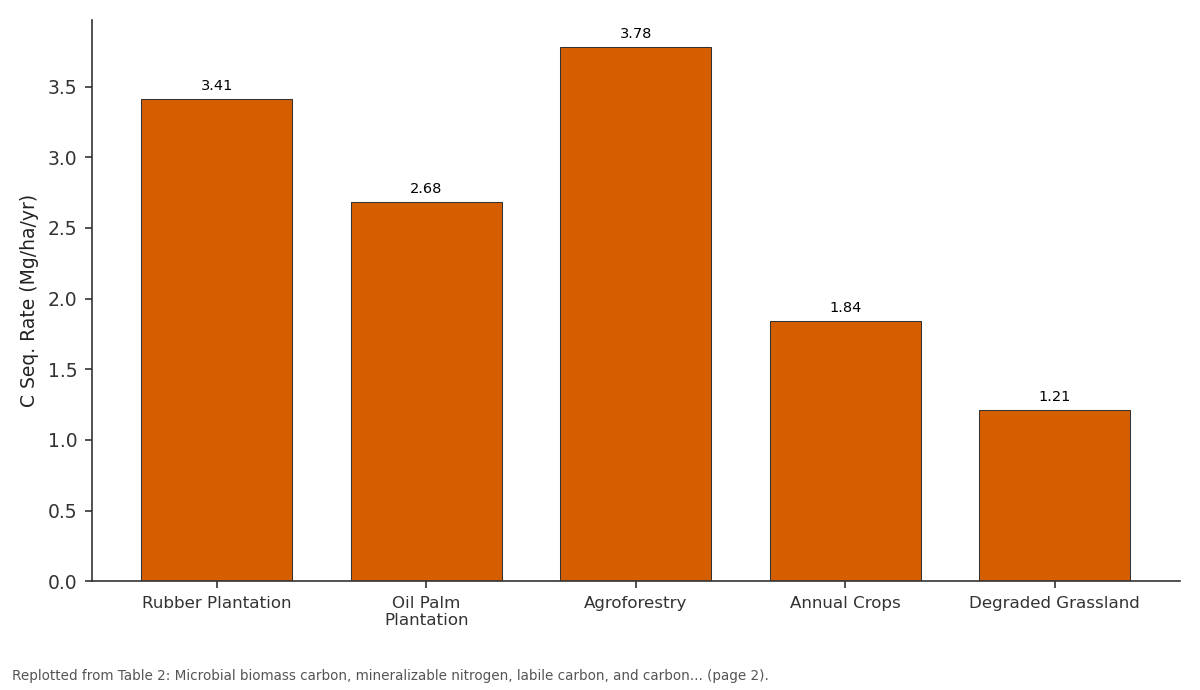
Labile C (g/kg): Rubber Plantation vs Oil Palm Plantation vs Agroforestry vs Annual Crops vs Degraded Grassland
Replotted from Table 2 (page 2) of the original paper. Every bar is the paper's own table value.
View source evidence ↗Figures & tables
From the original paper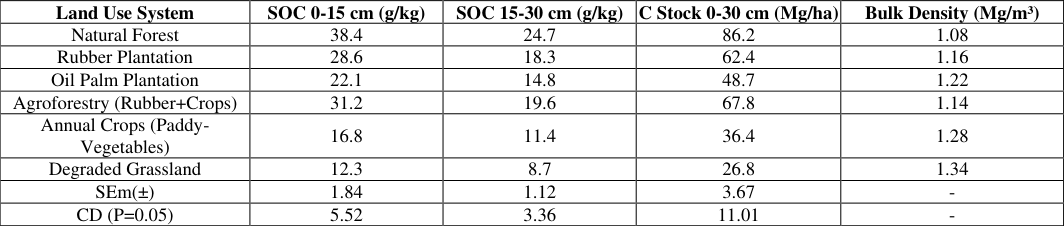 Table 1
 Table 2
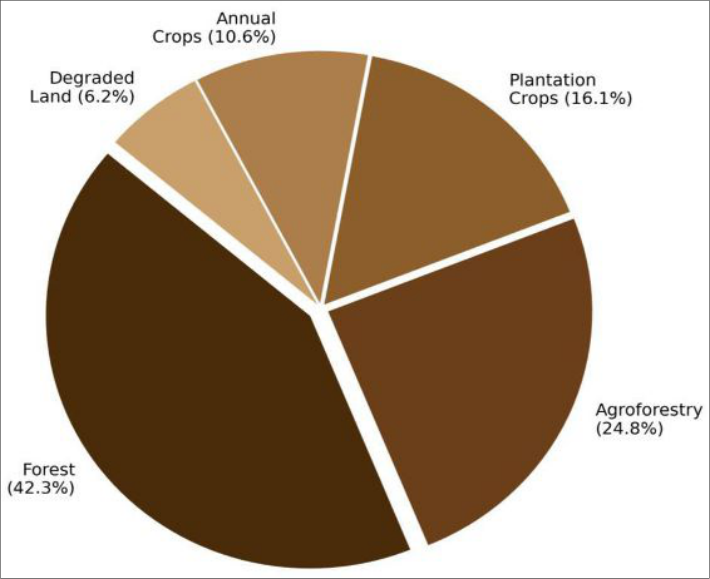 Figure 1
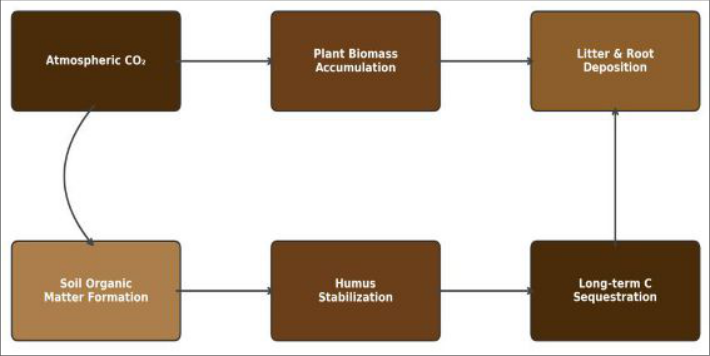 Figure 2
Introduction
What happens to the carbon stored in tropical soils when forests give way to farms? This question has taken on fresh urgency as Southeast Asian nations expand agricultural frontiers into highland areas that once served as large carbon reservoirs [1] . Soils store roughly 2,500 Gt of organic carbon globally, more than double the amount held in the atmosphere and vegetation combined, and tropical soils account for a disproportionate share because warm, humid conditions drive high rates of biomass production and litter input [2] . Land use change is the main driver of soil carbon loss in the tropics. Conversion of forest to annual crops typically reduces SOC stocks by 30-60% within two to three decades, while tree-based systems like agroforestry and perennial plantations lose less because they maintain year-round canopy cover and continuous root inputs [3] . The Malaysian highlands of Johor are experiencing rapid land use transition, with rubber and oil palm plantations replacing secondary forest and mixed agroforestry systems [4] . Despite the policy relevance of soil carbon data for national greenhouse gas inventories, field-level measurements from these highland areas remain scarce [5] . This research compared SOC stocks, labile carbon fractions, and microbial activity indicators across six contrasting land use types to evaluate their carbon sequestration potential and identify management practices that conserve soil carbon.
Baseline Soil Characterisation
The research sites were located in the Kluang district of Johor state, peninsular Malaysia (2.03° N, 103.32° E, elevation 80-140 m). Soils belong to the Rengam series (Typic Paleudults), derived from granite parent material, with sandy clay loam to clay texture. Presampling characterization at 0-15 cm gave pH 4.4-5.1 (1:2.5 soil:water), CEC 8.2-14.6 cmol/kg, and total nitrogen 0.12-0.28%. The natural forest site had been undisturbed for at least 50 years. Plantation and crop sites had been under their respective management for 15-22 years, providing sufficient time for land use effects on SOC to stabilize.
Material and Methods Material
Soil sampling was carried out in March 2022 and repeated in March 2023 across the six land use systems. At each site, five composite samples were collected from 0-15 cm and 15-30 cm depths along a diagonal transect, with each composite drawn from four sub-samples within a 10 m radius. Core samples for bulk density were taken using 100 cm³ steel rings. All samples were air-dried, ground, and passed through a 2 mm sieve for chemical analysis [6] . Fresh sub-samples were stored at 4°C for microbial biomass determination.
Methods
SOC was measured by wet oxidation (Walkley-Black method). Carbon stocks were calculated as SOC concentration × bulk density × depth increment. Microbial biomass carbon (MBC) was estimated by the chloroform fumigation-extraction method [7] . Potentially mineralizable nitrogen (PMN) was determined by anaerobic incubation at 40°C for 7 days. Labile carbon was extracted with 333 mM KMnO₄ [8] . Carbon sequestration rate was estimated by the paired-site chronosequence approach, comparing each land use against the forest reference and dividing by years since conversion [9] . Data were analyzed by ANOVA in a completely randomized design with five replications. Treatment means were compared by Duncan's test at P = 0.05.
Results
Results
Comprehensive Interpretation
The SOC stock in the 0-15 cm layer accounted for 61-64% of the total 0-30 cm stock across all land uses, indicating that management practices affecting topsoil organic matter inputs have the greatest influence on total carbon storage. A strong positive correlation was found between MBC and SOC (r = 0.96), confirming that microbial biomass serves as a sensitive indicator of soil carbon status.
Discussion
The 57.8% decline in SOC stocks from forest to annual cropping aligns with global meta-analyses reporting 40-60% losses after tropical deforestation for agriculture [3] . The mechanisms are well understood: removal of tree canopy eliminates continuous litter input, tillage accelerates organic matter decomposition by breaking soil aggregates and exposing protected carbon, and reduced root biomass limits below-ground carbon inputs [2] . That agroforestry retained nearly 79% of forest carbon is encouraging and reflects the capacity of tree-crop combinations to maintain year-round litter fall, deeper root activity, and better aggregate stability than monoculture cropping [10] . The higher sequestration rate in agroforestry (1.46 Mg/ha/yr) compared to monoculture plantations is likely due to the diversity of litter quality, with mixed inputs from different tree and crop species promoting a more complex and stable soil organic matter pool [11] . From a climate policy perspective, these results support the inclusion of agroforestry in national carbon accounting frameworks as a viable land use alternative that delivers both food production and measurable carbon benefits.
Conclusion
Conclusion
Acknowledgement
Acknowledgements Funding SourcesThis research was funded through the Johor Institute of Agricultural Technology's internal research allocation. Institutional SupportThe authors acknowledge the Johor Institute of Agricultural Technology for field and laboratory support. Contributions Not Qualifying for AuthorshipField assistants at the Kluang research station are thanked for help with soil sampling and sample preparation.
Figures and tables from the paper
| Land Use System | SOC 0-15 cm (g/kg) | SOC 15-30 cm (g/kg) | C Stock 0-30 cm (Mg/ha) | Bulk Density (Mg/m³) |
|---|---|---|---|---|
| Natural Forest | 38.4 | 24.7 | 86.2 | 1.08 |
| Rubber Plantation | 28.6 | 18.3 | 62.4 | 1.16 |
| Oil Palm Plantation | 22.1 | 14.8 | 48.7 | 1.22 |
| Agroforestry (Rubber+Crops) | 31.2 | 19.6 | 67.8 | 1.14 |
| Annual Crops (Paddy- Vegetables) | 16.8 | 11.4 | 36.4 | 1.28 |
| Degraded Grassland | 12.3 | 8.7 | 26.8 | 1.34 |
| SEm(±) | 1.84 | 1.12 | 3.67 | - |
| CD (P=0.05) | 5.52 | 3.36 | 11.01 | - |
Table text extracted from the original PDF; superscript letters are shown inline. The original table image is below.
View original table image
| Land Use System | MBC (µg/g) | PMN (mg/kg) | Labile C (g/kg) | C Seq. Rate (Mg/ha/yr) |
|---|---|---|---|---|
| Natural Forest | 487.3 | 28.4 | 4.82 | Reference |
| Rubber Plantation | 342.6 | 19.7 | 3.41 | 1.24 |
| Oil Palm Plantation | 264.8 | 14.2 | 2.68 | 0.87 |
| Agroforestry | 378.4 | 22.8 | 3.78 | 1.46 |
| Annual Crops | 186.2 | 10.6 | 1.84 | 0.42 |
| Degraded Grassland | 124.7 | 7.3 | 1.21 | 0.18 |
| SEm(±) | 21.4 | 1.47 | 0.24 | - |
| CD (P=0.05) | 64.2 | 4.41 | 0.72 | - |
Table text extracted from the original PDF; superscript letters are shown inline. The original table image is below.
View original table image
References
20 in the original paper- Lal R. Soil carbon sequestration impacts on global climate change and food security. Science. 2004;304(5677):1623-1627.
- Batjes NH. Total carbon and nitrogen in the soils of the world. European Journal of Soil Science. 1996;47(2):151-163.
- Don A, Schumacher J, Freibauer A. Impact of tropical land-use change on soil organic carbon stocks. Global Change Biology. 2011;17(4):1658-1670.
- Abram NK, Meijaard E, Wilson KA. Oil palmcommunity conflict mapping in Indonesia. Applied Geography. 2017;78:33-44.
- Guillaume T, Damris M, Kuzyakov Y. Losses of soil carbon by converting tropical forest to plantations. Agriculture, Ecosystems and Environment. 2015;214:104-114.
- Nelson DW, Sommers LE. Total carbon, organic carbon, and organic matter. In: Methods of soil analysis. SSSA Book Series. 1996;5:961-1010.
- Vance ED, Brookes PC, Jenkinson DS. An extraction method for measuring soil microbial biomass C. Soil Biology and Biochemistry. 1987;19(6):703-707.
- Blair GJ, Lefroy RDB, Lisle L. Soil carbon fractions based on their degree of oxidation. Australian Journal of Agricultural Research. 1995;46(7):1459-1466.
- Post WM, Kwon KC. Soil carbon sequestration and land-use change. Global Change Biology. 2000;6(3):317-327.
- Nair PKR, Kumar BM, Nair VD. Agroforestry as a strategy for carbon sequestration. Journal of Plant Nutrition and Soil Science. 2009;172(1):10-23.
- Oelbermann M, Voroney RP, Gordon AM. Carbon sequestration in tropical and temperate agroforestry systems. Agroforestry Systems. 2004;60(1):33-45.
- Lal R. Soil erosion and the global carbon budget. Environment International. 2003;29(4):437-450.
- Rao KPC, Verchot LV, Laarman J. Adaptation to climate change through sustainable management of natural resources. SAT eJournal. 2007;4(1):1-30.
- Six J, Conant RT, Paul EA. Stabilization mechanisms of soil organic matter. Ecosystems. 2002;5(7):672-687.
- Ziegler AD, Phelps J, Yuen JQ. Carbon outcomes of major land-cover transitions in SE Asia. Global Change Biology. 2012;18(10):3087-3099.
- Palm CA, Woomer PL, Alegre J. Carbon sequestration and trace gas emissions in slash-and-burn alternatives. ASB Climate Change Working Group Report. 2000;1:1-36.
- Detwiler RP. Land use change and the global carbon cycle. Biogeochemistry. 1986;2(1):67-93.
- van Noordwijk M, Cerri C, Woomer PL. Soil carbon dynamics in the humid tropical forest zone. Geoderma. 1997;79(1-4):187-225.
- Bruun TB, de Neergaard A, Lawrence D. Environmental consequences of the demise in swidden cultivation. Human Ecology. 2009;37(3):375-388.
- Minasny B, Malone BP, McBratney AB. Soil carbon 4 per mille. Geoderma. 2017;292:59-86.