
Research article · 2026 · Full text
International Journal of Geography Geology and EnvironmentHypsometric analysis of the Sankh river watershed using geospatial techniques
Volume 8(4) · Pages 52–57 · DOI: 10.22271/.v27067483.20268.i4a.511 ↗
Research areasGroundwater and Watershed AnalysisGeography and Environmental StudiesHydrology and Watershed Management Studies
Abstract
Author-writtenHypsometric analysis is used to evaluate the distribution of elevations within the Watershed and understand the evolution of the landscape. This study uses a quantitative assessment of erosion status and landscape evolution. Remote sensing and GIS have been used to construct the hypsometric curve and Hypsometric Integral (HI). The Hypsometric curve is used to interpret the erosion status, and the hypsometric integral has been used to interpret whether the watershed is in the youth, mature, or old stage of development. For this purpose, the watershed has been divided into three sub-watersheds, namely SW-1, SW-2 and SW-3. The value of HI has been computed as 0.49 for all the sub-watersheds, which is an indicator that the whole watershed has attained a mature stage of development and homogeneous landscape evolution. Hypsometric analysis helps in understanding the terrain evolution and makes necessary sustainability planning strategies for the watershed management.
Summary
Source-checkedPlain-language reading of the full paper, prepared with AI and checked against the text. Each point links to the authors' own words.
Why it matters
- Hypsometric analysis allows researchers to evaluate how elevations are distributed within a watershed to understand how the landscape has evolved. View evidence ↗
- The hypsometric characteristics of a watershed provide critical information regarding its geomorphic development stage, erosion processes, and hydrological behavior. View evidence ↗
- The Hypsometric Integral (HI) and the shape of the hypsometric curve indicate the level of erosion and tectonic activity, with convex curves and high HI values suggesting less erosion. View evidence ↗
The question
- The study aims to perform a hypsometric analysis of the Sank River Watershed to determine its evolutionary stages and the extent of erosion. View evidence ↗
What they did
- Researchers used a 30-meter resolution SRTM Digital Elevation Model (DEM) processed within ArcMap 10.4 software. View evidence ↗
- To facilitate the analysis, the main watershed was divided into three distinct sub-watersheds: SW-1, SW-2, and SW-3. View evidence ↗
- The Hypsometric Integral and curves were generated by extracting minimum, maximum, and mean elevations using a Zonal Statistics table. View evidence ↗
What they found
- The Hypsometric Integral (HI) was calculated as 0.49 for the entire Sankh River watershed and for each of its three sub-watersheds. View evidence ↗
- Because the HI values (0.49) fall within the 0.35 to 0.6 range, the entire watershed is classified as being in a mature stage of development. View evidence ↗
- Sub-watershed SW-1 exhibits a smooth, slightly concave downward curve, indicating a balance between slope decline and erosion. View evidence ↗
- Sub-watershed SW-2 has a more curved hypsometric curve than SW-1, suggesting it is transitioning toward a late mature stage. View evidence ↗
- Sub-watershed SW-3 shows a concave curve, indicating a strong mature stage with increased erosion intensity approaching the old stage. View evidence ↗
- The identical HI values across all sub-watersheds indicate that geomorphic processes and basin evolution are homogeneous throughout the watershed. View evidence ↗
What it means
- The authors recommend soil conservation through terracing, contour bunding, and sustainable land and groundwater use. View evidence ↗
- To combat soil degradation common in mature basins, the authors suggest constructing percolation tanks and check dams to improve groundwater recharge. View evidence ↗
Visual summary
2 visualsIllustrations explain the paper; charts are replotted from the paper's own table values.
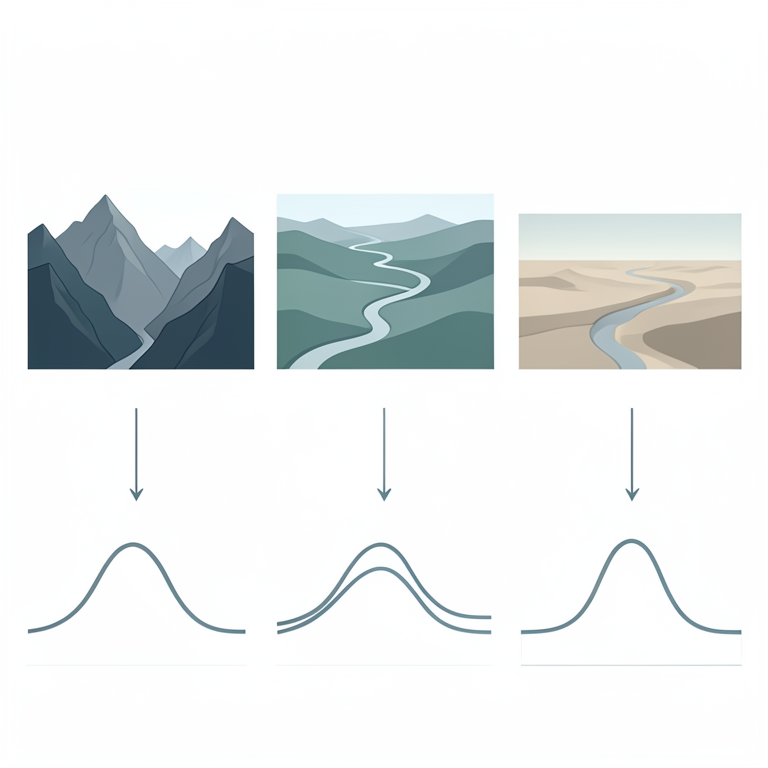
Hypsometric Curve Interpretation
AI-generated conceptual illustration (Sankh river watershed topography). It explains the idea and does not show study data.
View source evidence ↗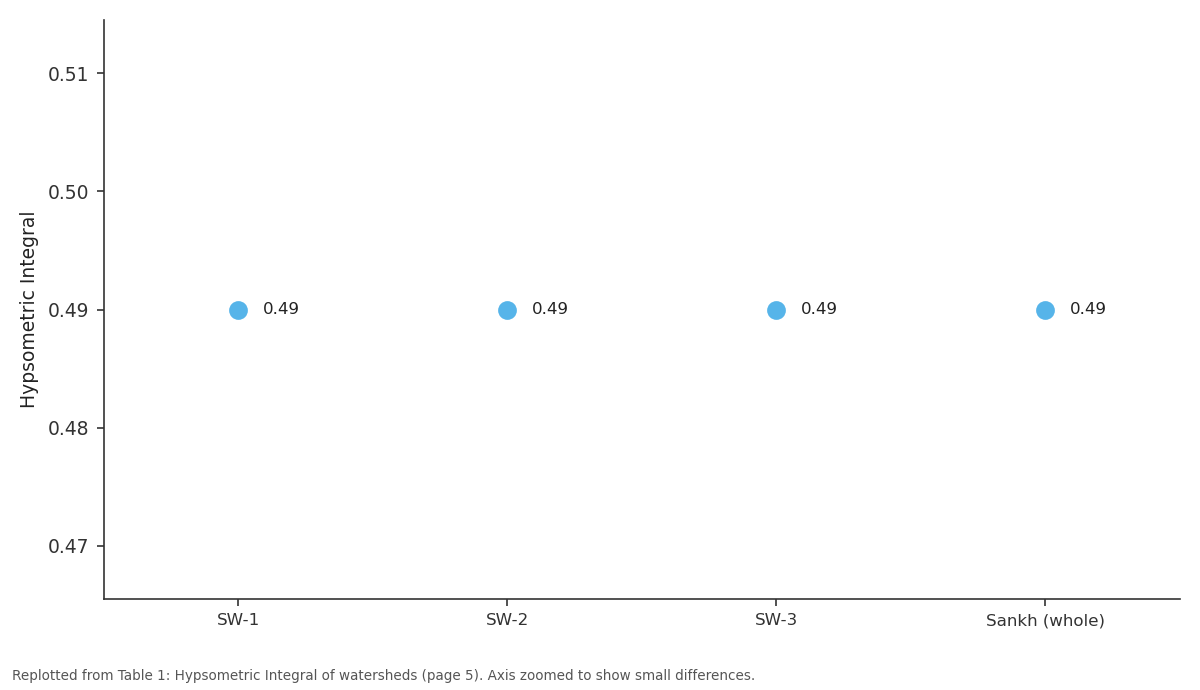
Hypsometric Integral: SW-1 vs SW-2 vs SW-3 vs Sankh (whole)
Replotted from Table 1 (page 5) of the original paper. Every bar is the paper's own table value.
View source evidence ↗Figures & tables
From the original paper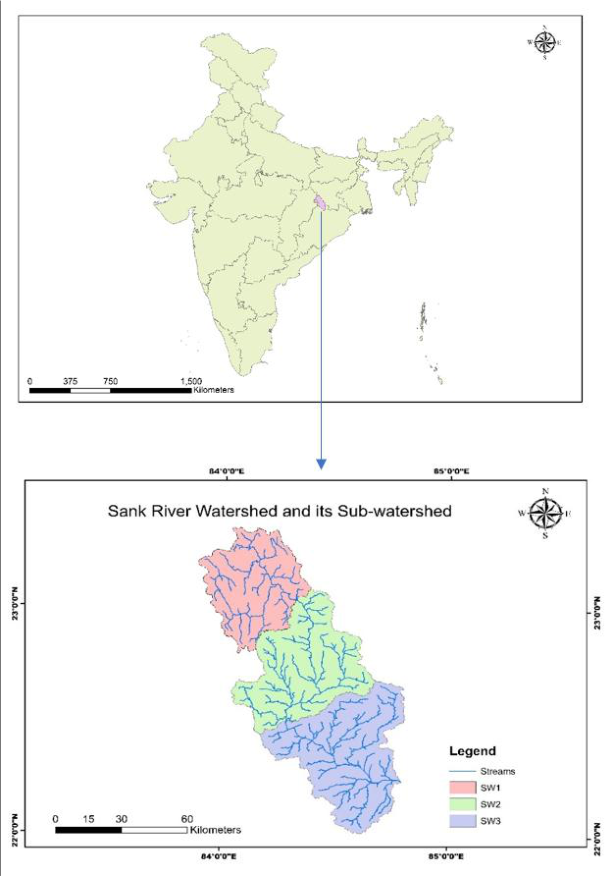 Figure 1
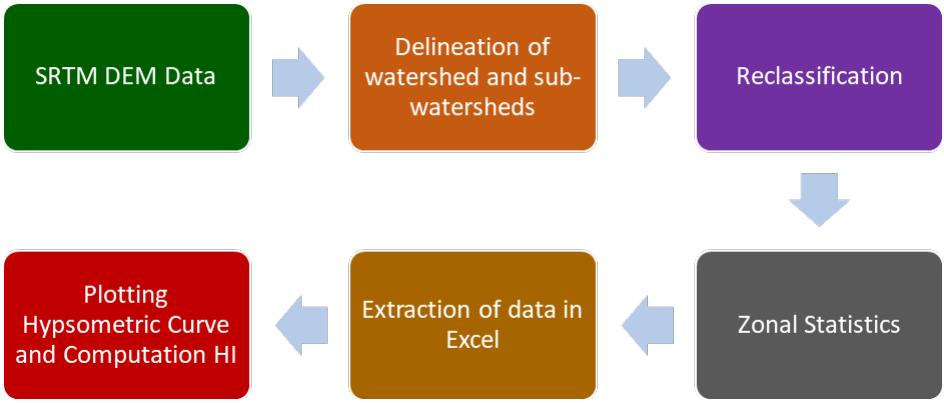 Figure 2
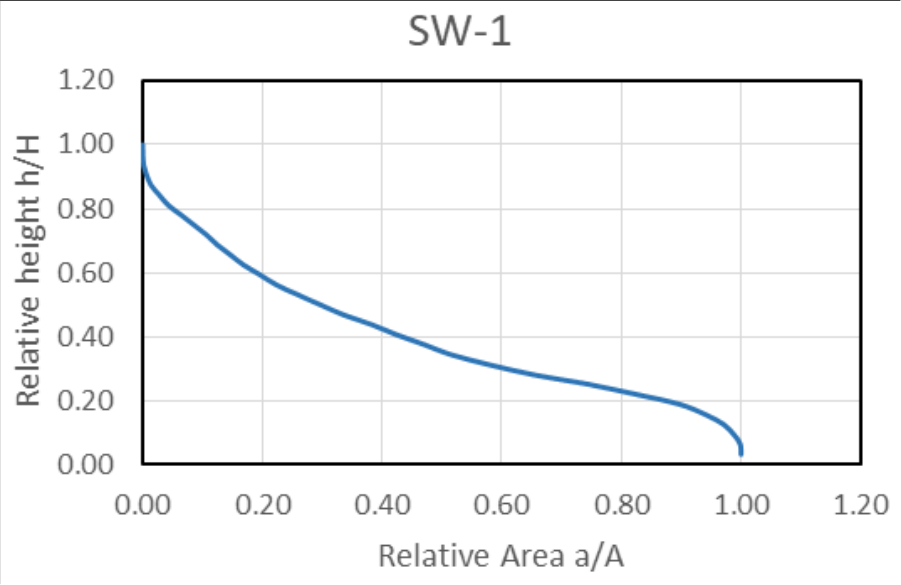 Figure 3
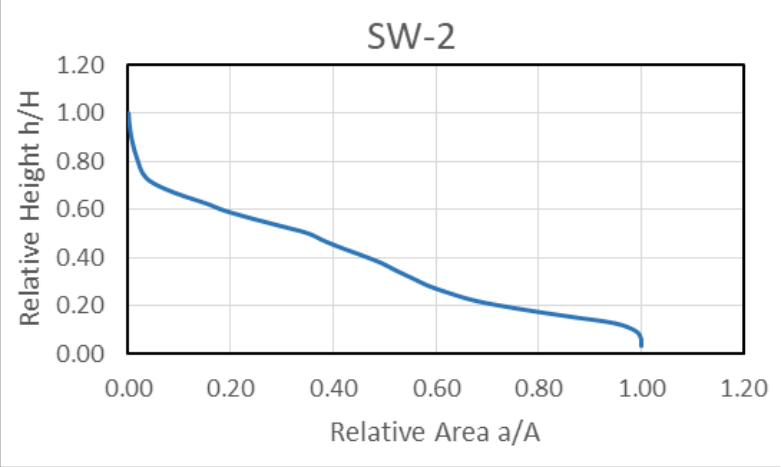 Figure 4
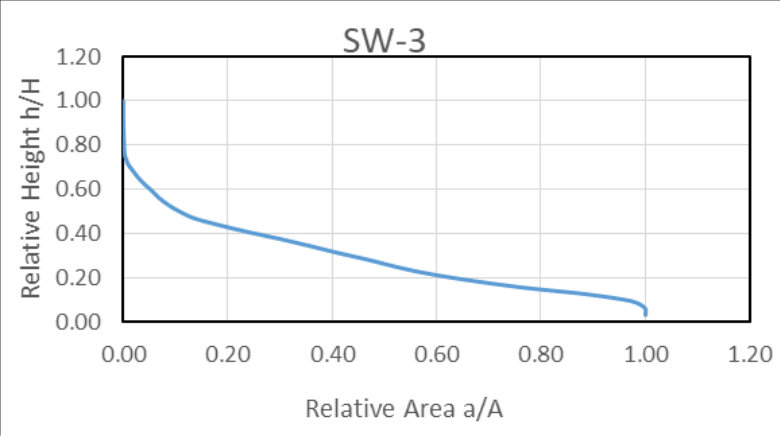 Figure 5
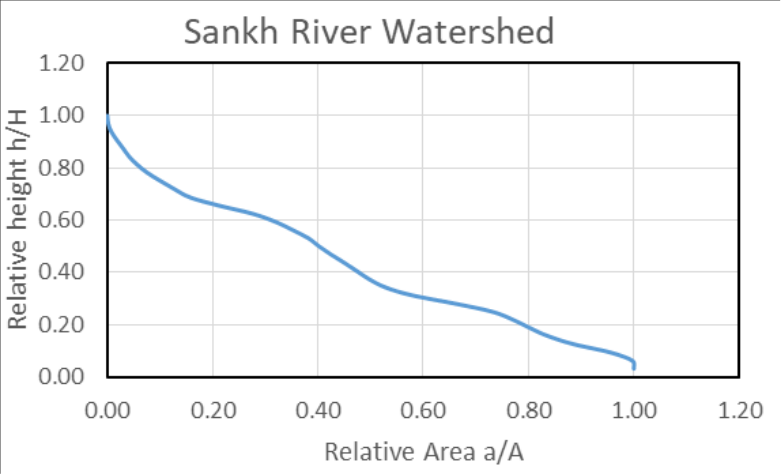 Figure 6
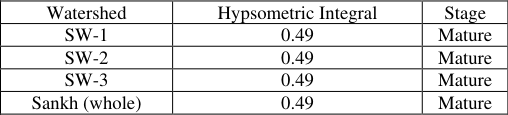 Table 1
Introduction
A watershed is an area from which all the streams and precipitation are drained to a common outlet (Harsha et al., 2020; Kumar et al., 2016; Wang et al., 2016) [1,2,3] . Hypsometric characteristics of a watershed provide important insights into its hydrological behaviour, erosion processes, and stage of geomorphic development (Yousaf et al., 2018) [4] . Hypsometric analysis was initially introduced by Langebein (1947) to indicate the slope and forms of a drainage basin (Sharma et al., 2013) [5] and later on interpreted by Strahler (1952) also found that HI has an inverse relation with the total relief, channel gradient, drainage density, and Slope steepness. It is also an indication of the cycle of erosion (Garg, 1991; Strahler, 1952) [6,7] . The hypsometric curve is related to the volume of the soil mass within the basin and the extent of the erosion that took place in a basin relative to the residual mass (Hurtrez et al., 1999; Marchi et al., 2015) [8,9] . Hypsometric analysis involves the estimation of the hypsometric interval and plotting hypsometric curves to identify the relationship between the relative area and the relative height of the watershed (Harsha et al., 2020; Singh et al., 2008; Walia et al., 2018) [2,10,11] [12,13,14,15] . High HI Values with a convex hypsometric curve indicate less eroded and tectonically active terrain, while lower HI values with a concave hypsometric curve indicate high erosion and a stable geomorphic unit (Ezati et al., 2021; Haz & Pamumpuni, 2025; Strahler, 1952; Van Liem et al., 2016) [7,16,17,18] . Many researchers have used GIS for Hypsometric analysis(Das, 2014; [2,4,5,19,20,21,22] . The integration of DEM digital elevation models with the GIS tool has enabled the automated extraction of watershed boundaries and the determination of stream networks (Melesse et al., 2003) [14] . The objective is to conduct a hypsometric analysis of the Sank River Watershed to evaluate the erosion and evolutionary stages. This analysis will help to understand the level of erosion, landscape changes and implementation of plans for sustainable watershed management.
Study Area
The study area is delineated from where the Sank River confluences with the South Koel to become part of the Brahmani River. The watershed area extends between longitudes 84º2'12" to 84º37'18" E and latitudes 22º0'41" to 23º21'27"N as shown in Figure 1. It has been divided into three sub-watersheds as SW-1, SW-2 and SW-3. The study area lies in Jharkhand, around 4410 sq km (64%), Odisha, 1330 sq km (19%) and Chhattisgarh, 1160 sq km (17%). It covers an area of around 6900 square kilometres The climate of the study area lies in the tropical monsoon climate zone. Sal tree is the most common tree found in this study area. The Chhotanagpur Granitic Gneiss complex (CGGC) forms the basement rock. Most of the study area consists of Batholith masses, which have undergone metamorphism and tectonic deformation. Pigmatite veins are also most common, which have intruded into the basement rocks and other Granites (Patowarya et al., 2023) [23] . The landscape of the study area is characterised by undulating terrain with varying elevations ranging from 180 metres to 100 metres above sea level. The drainage pattern is mostly dendritic. The shape of the drainage is elongated.
Methodology
A geospatial technique with a quantitative approach has been used for hypsometric analysis of the study area. Initially, the digital data is acquired, then the watershed and sub-watersheds are delineated by processing data using different tools, and finally, the hypsometric parameters are computed for analysis. A 30-meter resolution SRTM DEM has been obtained from the website https://earthexplorer.usgs.gov/. The acquired DEM data is being processed in ArcMap 10.4. DEM data is processed using a specialist analysis hydrology tool, which involves fill, followed by the generation of flow direction and flow accumulation. Using the pour point, the Sankh River watershed and sub-watersheds SW-1, SW-2, and SW-3 are delineated. Subsequently, the Sank River Watershed and sub-watersheds elevation range is reclassified into equal intervals, and finally, the Zonal Statistics table is used for the extraction of minimum, maximum, and mean elevation for the calculation of the Hypsometric Integral and the Hypsometric curve is plotted. The Hypsometry integral is calculated using the following equation. [3,24] .
Where: h=height of given contour H = maximum basin elevation [3,20] . Where: HI>0. Overall, the upper portion indicates a gentle slope that has less area at high elevation. In the middle portion, the slope has gradually declined, indicating the zone of active erosion. The lower portion of the surface relief is flat because of more sediment deposition.
Conclusion
The computed HI values of all the sub-watersheds, as well as that of the whole watershed, are 0.49, which indicates the whole basin has attained the maturity stage. Similar HI values also suggest homogeneity in geomorphic processes within the watershed. All sub-watersheds have uniform development, and basin evolution is homogeneous. All these results help in analysing plans for the watershed management. Sustainable use of groundwater and land use practices must be followed for the purpose of soil conservation. Contours bunding and Terracing on a moderate slope will help to reduce erosion. Check Dams and percolation tanks must be constructed within the watershed to increase the recharge of groundwater, since mature basins are sensitive to soil degradation. Thus, instead of constructing intensive structures, emphasis must be placed on maintaining the ecological balance and sustainable use of the landscape within the Watershed.
Figures and tables from the paper
| Watershed | Hypsometric Integral | Stage |
|---|---|---|
| SW-1 | 0.49 | Mature |
| SW-2 | 0.49 | Mature |
| SW-3 | 0.49 | Mature |
| Sankh (whole) | 0.49 | Mature |
Table text extracted from the original PDF; superscript letters are shown inline. The original table image is below.
View original table image
References
19 in the original paper- Wang G, Mang S, Cai H, et al. Integrated watershed management: evolution, development and emerging trends. Journal of Forestry Research. 2016;27(5):967994.
- Harsha J, Ravikumar AS, Shivakumar BL. Evaluation of morphometric parameters and hypsometric curve of Arkavathy river basin using RS and GIS techniques. Applied Water Science. 2020;10(3):86.
- Kumar S, Meshram S, Patil R, Tignath S. Hypsometric analysis using geographical information system of Gour River watershed, Jabalpur, Madhya Pradesh, India. Current World Environment. 2016;11(1):56-64.
- Yousaf W, Mohayud-Din-Hashmi SG, Akram U, et al. Erosion potential assessment of watersheds through GIS-based hypsometric analysis: a case study of Kurram Tangi Dam. Arabian Journal of Geosciences. 2018;11(22):711.
- Sharma SK, Tignath S, Gajbhiye S, Patil R. Use of geographical information system in hypsometric analysis of Kanhiya Nala watershed. International Journal of Remote Sensing and Geoscience. 2013;2(3):30-35.
- Garg SK. Geology: the science of earth. Khanna; 1991.
- Strahler AN. Hypsometric (area-altitude) analysis of erosional topography. Geological Society of America Bulletin. 1952;63(11):1117-1142.
- Hurtrez JE, Sol C, Lucazeau F. Effect of drainage area on hypsometry from an analysis of small-scale drainage basins in the Siwalik Hills (Central Nepal). Earth Surface Processes and Landforms. 1999;24(9):799-808.
- Marchi L, Cavalli M, Trevisani S. Hypsometric analysis of headwater rock basins in the Dolomites (eastern Alps) using high-resolution topography. Geografiska Annaler Series A Physical Geography. 2015;97(2):317335.
- Singh O, Sarangi A, Sharma MC. Hypsometric integral estimation methods and its relevance on erosion status of north-western lesser Himalayan watersheds. Water Resources Management. 2008;22(11):1545-1560.
- Walia S, Singh S, Loshali DC, Babbar R. Hypsometric analysis of the micro-watersheds with different management practices located on Shivalik foothills. Arabian Journal of Geosciences. 2018;11(11):276.
- Bala SK. Hypsometric analysis for prioritization of watershed using GIS technique; 2013.
- Jha A, Gupta NC, Dey B. Morphometric analysis of Gandak River drainage basin using geographic information system and SRTM-DEM. Geology. 2022;4(18):31.
- Melesse AM, Graham WD, Jordan JD. Spatially distributed watershed mapping and modeling: GISbased storm runoff response and hydrograph analysis: Part 2. Journal of Spatial Hydrology. 2003;3(2):1-28.
- Pande C, Moharir K, Pande R. Assessment of morphometric and hypsometric study for watershed development using spatial technology: a case study of Wardha River basin in Maharashtra, India. International Journal of River Basin Management. 2021;19(1):43-53.
- Ezati M, Gholami E, Mousavi SM. Tectonic activity level evaluation using geomorphic indices in the Shekarab Mountains, Eastern Iran. Arabian Journal of Geosciences. 2021;14(5):385.
- Haz H, Pamumpuni A. Integrating geomorphic indices to characterize tectonic activity across contrasting volcanic-tectonic domains of the Cimanuk Basin, Indonesia. Bulletin of Geology. 2025;9(2):54-74.
- Van Liem N, Dat NP, Dieu BT, et al. Assessment of geomorphic processes and active tectonics in Con Voi mountain range area (Northern Vietnam) using the hypsometric curve analysis method. Vietnam Journal of Earth Sciences. 2016;38(2):202-216.
- Gajbhiye S, Mishra SK, Pandey A. Hypsometric analysis of Shakkar River catchment through geographical information system. Journal of the Geological Society of India. 2014;84(2):192-196.