
Research article · 2025 · Full text
International Journal of Agriculture and NutritionTechno-economic analysis of solar-powered irrigation systems for small-scale horticulture
Volume 7(5) · Pages 151–154 · DOI: 10.33545/26646064.2025.v7.i5c.577 ↗
Research areasEngineering and Agricultural InnovationsIrrigation Practices and Water ManagementPhotovoltaic Systems and Sustainability
Abstract
Author-writtenWhat if small-scale horticulture farmers could irrigate without any recurring fuel or electricity bill? This research conducted a techno-economic comparison of solar photovoltaic (SPV), diesel, and grid-electric pump systems for drip irrigation in small-scale vegetable and flower production at Tamil Nadu Agricultural University, Coimbatore, and Sam Higginbottom University, Prayagraj, during 2022-24. Five SPV system sizes (1.0-3.0 kWp) were evaluated alongside diesel and grid benchmarks across both locations. A 2.0 kWp SPV system delivered 16.8 m³ of water per day-sufficient for 0.4 ha of drip-irrigated vegetables-at a levelized cost of ₹1.84 per m³ versus ₹4.62 (diesel) and ₹2.96 (grid). The payback period for the 2.0 kWp system was 3.8 years at Coimbatore and 4.2 years at Prayagraj. Internal rate of return exceeded 28% at both sites over a 15-year system life. Sensitivity analysis showed that a 30% capital subsidy reduced payback to 2.4 years. These results confirm that solar-powered irrigation is economically viable for small horticultural holdings in southern and northern India.
Summary
Source-checkedPlain-language reading of the full paper, prepared with AI and checked against the text. Each point links to the authors' own words.
Why it matters
- The cost of solar panels has decreased significantly since 2010, while diesel prices have increased, potentially making solar irrigation more affordable. View evidence ↗
- Small-scale horticulture is well-suited for solar pumping due to high water demands and high crop values that can offset initial investment costs. View evidence ↗
- While grid electricity is available in some areas, its supply is often unreliable in rural regions. View evidence ↗
The question
- The study aimed to compare the technical performance and financial viability of solar photovoltaic (SPV), diesel, and grid-electric irrigation for small-scale horticulture in two different Indian locations. View evidence ↗
What they did
- Five different SPV system sizes ranging from 1.0 to 3.0 kWp were tested using monocrystalline panels with 20.4% efficiency. View evidence ↗
- The solar systems were benchmarked against a 3.5 HP diesel pump and a 2 HP grid-electric pump. View evidence ↗
- Financial viability was assessed using metrics including levelized cost of water (LCW), payback period, net present value (NPV), and internal rate of return (IRR). View evidence ↗
What they found
- For a 0.4 ha plot, the 2.0 kWp SPV system provided 16.8 m³ of water daily at a levelized cost of ₹1.84/m³, which is significantly cheaper than diesel (₹4.62/m³) and grid electricity (₹2.96/m³). View evidence ↗
- The 2.0 kWp solar system had a payback period of 3.8 years in Coimbatore and 4.2 years in Prayagraj. View evidence ↗
- Over a 15-year lifespan, the internal rate of return for the solar systems exceeded 28% at both test locations. View evidence ↗
- Lower solar irradiance at the Prayagraj site resulted in 10-12% less water delivery and a longer payback period of 4.2 years. View evidence ↗
- Dust accumulation during dry months can reduce solar output by 8-12% if panels are not cleaned on a weekly basis. View evidence ↗
What it means
- The authors recommend the aggressive promotion of solar irrigation for small-scale horticultural farmers throughout India. View evidence ↗
- The assumed 15-year lifespan of the panels has not been field-verified specifically under Indian environmental conditions. View evidence ↗
Visual summary
2 visualsIllustrations explain the paper; charts are replotted from the paper's own table values.
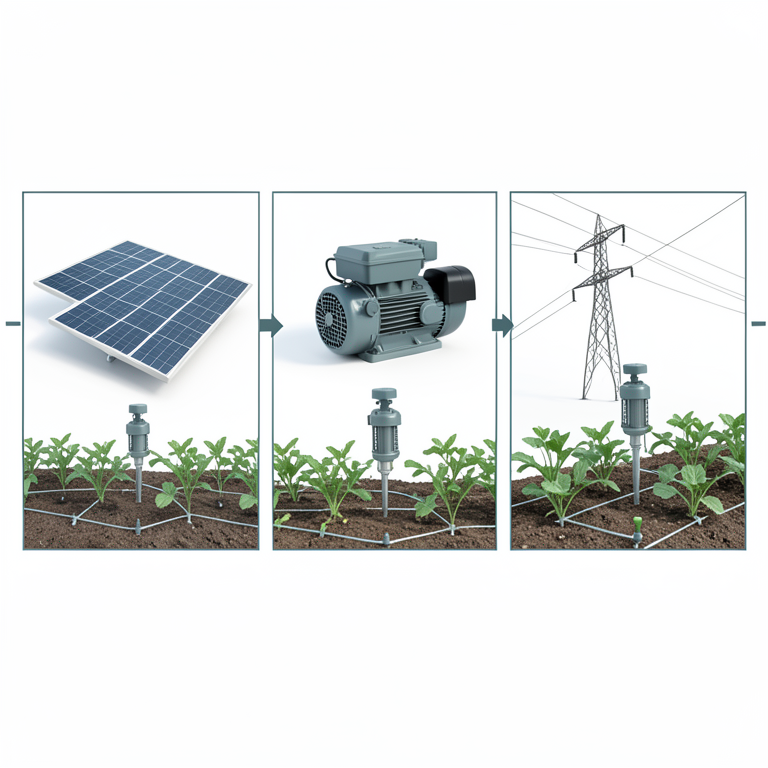
Energy Source Comparison
AI-generated conceptual illustration (small-scale vegetable garden with drip irrigation). It explains the idea and does not show study data.
View source evidence ↗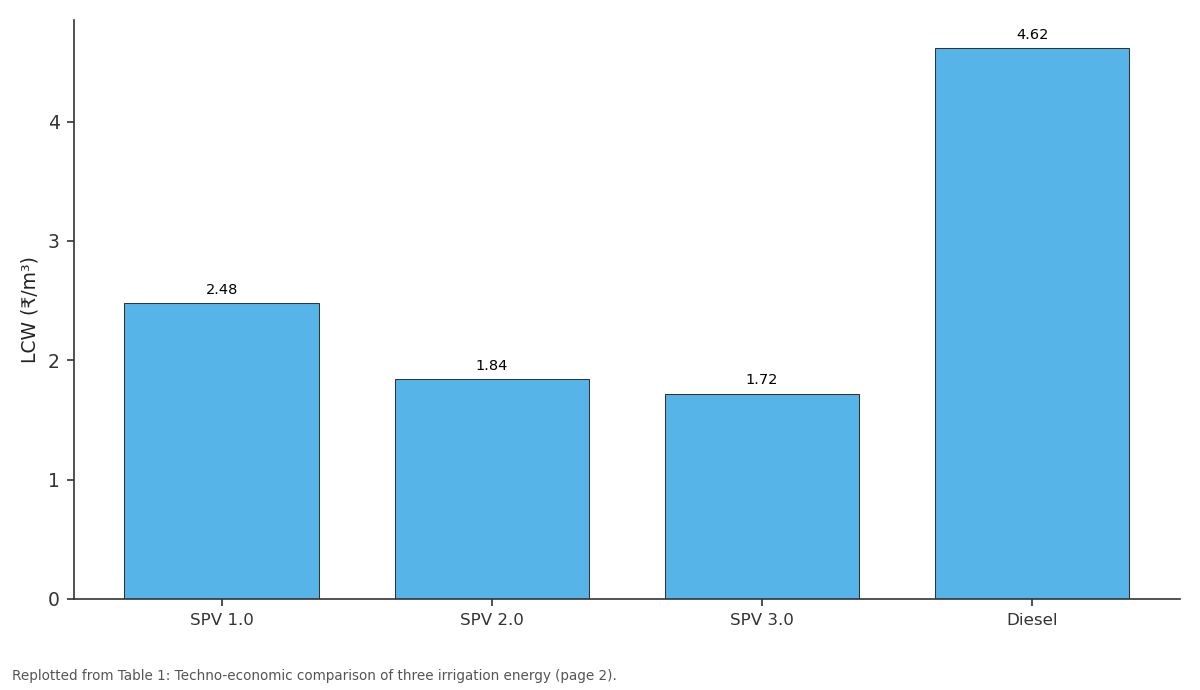
LCW (₹/m³): SPV 1.0 vs SPV 2.0 vs SPV 3.0 vs Diesel
Replotted from Table 1 (page 2) of the original paper. Every bar is the paper's own table value.
View source evidence ↗Figures & tables
From the original paper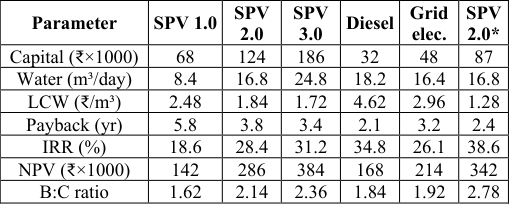 Table 1
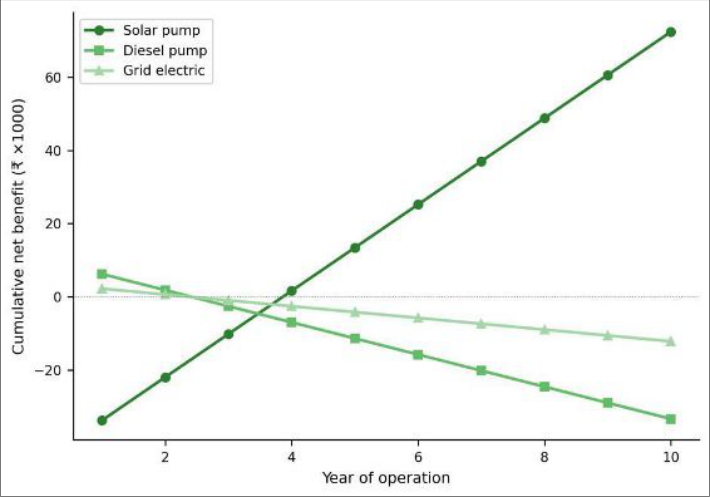 Figure 1
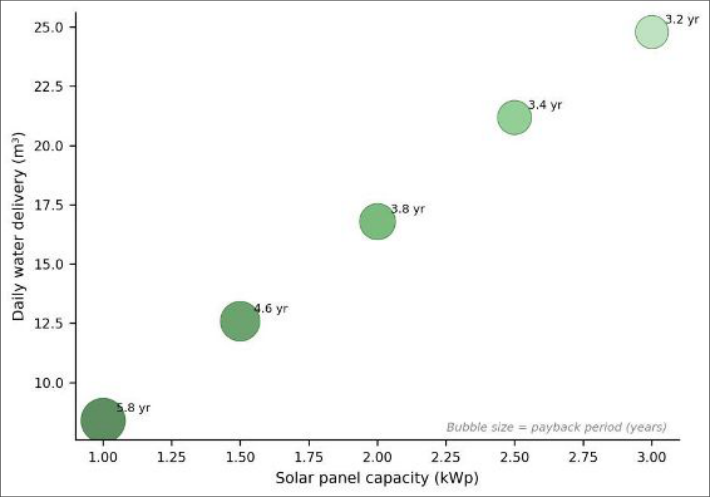 Figure 2
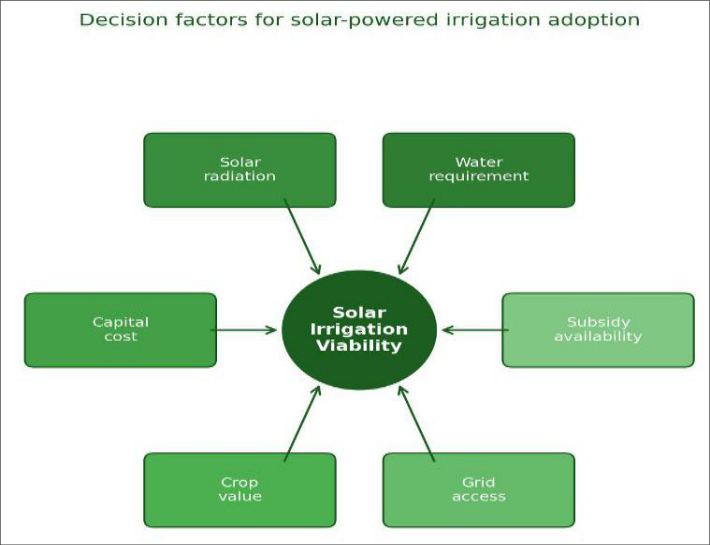 Figure 3
Introduction
Here's a hypothesis worth testing: the falling cost of solar panels has made photovoltaic irrigation cheaper than diesel in most of India's horticultural zones-but farmers don't know it yet. The price of crystalline silicon PV modules dropped from ₹180 per watt in 2010 to below ₹30 per watt by 2023, while diesel prices have risen steadily to ₹90-100 per litre [1,2] . Grid electricity, where available, costs ₹5-7 per kWh for agricultural connections in most states, but supply is unreliable in many rural areas [3] . Small-scale horticulture-vegetables, flowers, and nursery crops on 0.2-1.0 ha plots-has specific irrigation characteristics: relatively high water demand per unit area, daily scheduling requirements, and high crop value that can absorb capital investment costs [4] . Solar pumping is well suited to these conditions because peak solar irradiance coincides with peak irrigation demand, and the fixed-cost nature of solar eliminates the price volatility of diesel [5] . However, most techno-economic analyses of solar pumping have focused on cereal crops and larger holdings [6,7] . The economics may differ for horticulture because of the higher revenue per m³ of water applied and the smaller system sizes needed. This research aimed to compare the technical performance, costs, and financial returns of SPV, diesel, and gridelectric irrigation systems sized for small-scale horticultural operations at two contrasting Indian locations.
Solar Resource Assessment
Solar irradiance data were obtained from the NASA POWER database and validated against ground measurements at both sites. Coimbatore (11°01′N, 76°58′E) receives an annual average global horizontal irradiance (GHI) of 5.42 kWh m⁻² day⁻¹, with peak values of 6.1-6.4 kWh m⁻² day⁻¹ during March-May. Prayagraj (25°26′N, 81°51′E) averages 4.86 kWh m⁻² day⁻¹, with a wider seasonal range (3.8-6.2). Both sites have >280 sunshine days per year, well above the minimum for viable solar pumping. The 10-12% lower irradiance at Prayagraj translates to proportionally lower daily water delivery, which was factored into the economic analysis.
Material and Methods Material
Five SPV system configurations were tested: 1.0, 1.5, 2.0, 2.5, and 3.0 kWp DC surface-mounted pump sets (Shakti Solar, India) paired with monocrystalline panels (efficiency 20.4%, 25-year warranty). Each system was connected to a 1, 000 L overhead tank feeding inline drip laterals. Benchmark systems were a 3. The 2.0 kWp SPV system achieved the best balance of affordability and performance for the 0.4 ha plot (Table 1). Its levelized cost of water (₹1.84 m⁻³) was 60.2% lower than diesel and 37.8% lower than grid electricity. Payback was 3.8 years without subsidy and 2.4 years with the 30% KUSUM subsidy. The 3.0 kWp system had slightly better economics per m³ but required higher capital that may be inaccessible to smallholders.
| Parameter | SPV 1.0 | SPV 2.0 | SPV 3.0 | Diesel | Grid elec. | SPV 2.0* |
|---|---|---|---|---|---|---|
| Capital (₹×1000) | 68 | 124 | 186 | 32 | 48 | 87 |
| Water (m³/day) | 8.4 | 16.8 | 24.8 | 18.2 | 16.4 | 16.8 |
| LCW (₹/m³) | 2.48 | 1.84 | 1.72 | 4.62 | 2.96 | 1.28 |
| Payback (yr) | 5.8 | 3.8 | 3.4 | 2.1 | 3.2 | 2.4 |
| IRR (%) | 18.6 | 28.4 | 31.2 | 34.8 | 26.1 | 38.6 |
| NPV (₹×1000) | 142 | 286 | 384 | 168 | 214 | 342 |
| B:C ratio | 1.62 | 2.14 | 2.36 | 1.84 | 1.92 | 2.78 |
Table text extracted from the original PDF; superscript letters are shown inline. The original table image is below.
View original table image
Comprehensive Interpretation
The cumulative benefit curves (Figure 1) show that solar's high upfront cost is offset by near-zero operating costs, making it the most profitable option beyond year 4. The mind map (Figure 3) captures the multi-dimensional decision that farmers face-solar is most compelling where grid access is poor, solar radiation is high, and crop value justifies the investment.
Discussion
The 60% cost advantage of solar over diesel irrigation confirms earlier predictions based on falling panel prices [1,5] , but the magnitude of the advantage was larger than most published estimates because high-value horticultural crops generate more revenue per m³ of water than cereals, amplifying the relative benefit of cheaper water [4] . The payback of 3.8 years is well within the 15-year system life and compares favorably with the 4-6 year paybacks reported for larger solar pump installations on cereal farms [6,7] . The Prayagraj site showed 10-12% lower water delivery due to lower irradiance, extending payback to 4.2 years-still attractive. Seasonal variation in solar output was managed by the overhead tank, which buffered daily fluctuations.
Conclusion
Solar-powered drip irrigation using a 2.0 kWp system is economically viable for small-scale horticulture (0.4 ha) in both Coimbatore and Prayagraj, with a levelized water cost 60% below diesel and payback within 3.8 years. The KUSUM subsidy reduces payback to 2.4 years. Solar pumping eliminates recurring fuel costs and price volatility, making farm-level water costs predictable over the 15-year system life. These findings support aggressive promotion of solar irrigation for smallholder horticultural operations across India.
Acknowledgement
Acknowledgements Funding SourcesThis research was supported by collaborative grants from Tamil Nadu Agricultural University and Sam Higginbottom University of Agriculture for renewable energy in irrigation research. Institutional SupportBoth university research farms provided field facilities, pump installations, and weather monitoring infrastructure.
Figures and tables from the paper
References
19 in the original paper- Chandel SS, Naik MN, Chandel R. Review of solar photovoltaic water pumping system technology for irrigation and community drinking water supplies. Renewable and Sustainable Energy Reviews. 2015;49:1084-1099.
- IRENA. Renewable power generation costs in 2022. International Renewable Energy Agency. 2023;Abu Dhabi.
- Mukherji A, Shah T, Banerjee PS. Groundwater governance in South Asia. Natural Resources Forum. 2012;36(1):5-14.
- Burney J, Woltering L, Burke M, Naylor R, Pasternak D. Solar-powered drip irrigation enhances food security in the Sudano-Sahel. Proceedings of the National Academy of Sciences. 2010;107(5):1848-1853.
- Campana PE, Li H, Zhang J, Zhang R, Liu J, Yan J. Economic optimization of photovoltaic water pumping systems for irrigation. Energy Conversion and Management. 2015;95:32-41.
- Hartung H, Pluschke L. The benefits and risks of solar powered irrigation. FAO and GIZ. 2018;Rome.
- Agrawal S, Jain A. Sustainable deployment of solar irrigation pumps: key determinants and strategies. WIREs Energy and Environment. 2019;8(2):e325.
- Meah K, Fletcher S, Ula S. Solar photovoltaic water pumping for remote locations. Renewable and Sustainable Energy Reviews. 2008;12(2):472-487.
- Kelley LC, Gilbertson E, Sheikh A, Eppinger SD, Dubowsky S. On the feasibility of solar-powered irrigation. Renewable and Sustainable Energy Reviews. 2010;14(9):2669-2682.
- Senol R. An analysis of solar energy and irrigation systems in Turkey. Energy Policy. 2012;47:478-486.
- Mangrio AG, Asif M, Ahmed E. Techno-economic feasibility of solar water pumping system for agricultural application in Pakistan. Journal of Cleaner Production. 2020;261:121220.
- Al-Smairan M. Application of photovoltaic array for pumping water as an alternative to diesel engines in Jordan Badia. Renewable Energy. 2012;40(1):35-42.
- Chandrasekaran N, Thyagarajah K. Review and analysis of solar photovoltaic water pumping system for agriculture. Materials Today: Proceedings. 2021;45:1416-1422.
- Narale PD, Rathore NS, Kothari S. Study of solar PV water pumping system for irrigation of horticulture crops. International Journal of Engineering Science Invention. 2013;2(12):54-60.
- Sontake VC, Kalamkar VR. Solar photovoltaic water pumping system: a comprehensive review. Renewable and Sustainable Energy Reviews. 2016;59:1038-1067.
- Kumar M, Reddy KS, Adake RV, Rao CVSK. Solar powered micro-irrigation system for small holders of dryland agriculture in India. Agricultural Water Management. 2015;158:112-119.
- Benghanem M, Daffallah KO, Alamri SN, Joraid AA. Effect of pumping head on solar water pumping system. Energy Conversion and Management. 2014;77:334339.
- Ould-Amrouche S, Rekioua D, Hamidat A. Modelling photovoltaic water pumping systems and evaluation of their CO2 emissions mitigation potential. Applied Energy. 2010;87(11):3451-3459.
- Muhsen DH, Khatib T, Nagi F. A review of photovoltaic water pumping system designing methods, control strategies and field performance. Renewable and Sustainable Energy Reviews. 2017;68:70-86.