
Research article · 2025 · Full text
International Journal of Agriculture and NutritionPhysiological and biochemical changes during accelerated ageing of stored wheat seeds
Volume 7(7) · Pages 251–254 · DOI: 10.33545/26646064.2025.v7.i7d.546 ↗
Research areasSeed Germination and PhysiologyPlant Stress Responses and TolerancePostharvest Quality and Shelf Life Management
Abstract
Author-writtenHere is a paradox worth examining: wheat seeds that pass every standard germination test at harvest can still fail catastrophically if stored under sub-optimal conditions for just one season. This research tracked physiological and biochemical deterioration in two Polish winter wheat cultivars (Arkadia and Bamberka) subjected to accelerated ageing (41 °C, 100% RH) for 0, 3, 6, 9, 12, and 15 days at the Silesian Agricultural College, Gliwice, Poland, between September 2022 and June 2024. Germination dropped from 96.4% at day 0 to 22.1% by day 15. Lipid peroxidation, measured as malondialdehyde (MDA) content, increased nearly ninefold (3.2 to 28.6 nmol/g). Antioxidant enzyme activities (superoxide dismutase and catalase) peaked at day 6 before declining sharply, indicating exhaustion of the defence system. Seedling vigour index fell by 85.5%. Membrane integrity, assessed by electrical conductivity of seed leachate, deteriorated in parallel with MDA accumulation (r = 0.94). These results clarify the sequence of biochemical events underlying seed quality loss and identify MDA content as the earliest reliable marker of deterioration in stored wheat.
Summary
Source-checkedPlain-language reading of the full paper, prepared with AI and checked against the text. Each point links to the authors' own words.
Why it matters
- Wheat is the most widely stored cereal globally, and its seed quality during sowing is critical for food security, yield potential, and stand establishment. View evidence ↗
- Seed deterioration occurs through a biochemical cascade where lipid peroxidation damages membranes and the antioxidant defense system (including SOD and CAT) is eventually overwhelmed. View evidence ↗
- Accelerated ageing (AA) uses high temperature and humidity to compress the seed deterioration process from months into days for laboratory study. View evidence ↗
The question
- The study aimed to map the sequence of seed decline and identify the most sensitive early-warning markers by tracking physiological and biochemical indicators over six ageing durations. View evidence ↗
What they did
- The experiment used two Polish winter wheat cultivars: Arkadia, which has high vigour, and Bamberka, which has moderate vigour. View evidence ↗
- Seeds were subjected to accelerated ageing at 41±0.5 °C and 100% relative humidity for durations of 0, 3, 6, 9, 12, and 15 days, with four replicates of 100 seeds per combination. View evidence ↗
- Quality was measured via ISTA-standard germination tests (100 seeds at 20 °C) and electrical conductivity of seed leachate (50 seeds soaked for 24 hours). View evidence ↗
- Biochemical markers were measured using the TBA reaction for malondialdehyde (MDA), the NBT photoreduction method for superoxide dismutase (SOD), and H₂O₂ disappearance for catalase (CAT). View evidence ↗
What they found
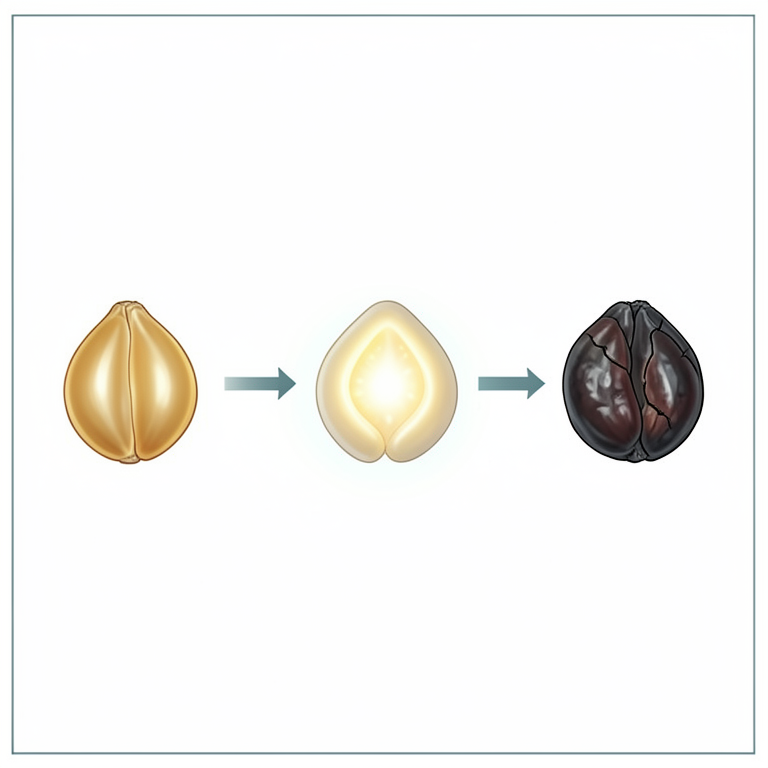
- Antioxidant enzyme activities for SOD and CAT peaked at day 6 (31.2 and 61.4 U/mg, respectively) before declining, showing a transient defense response. View evidence ↗
- MDA increase was detectable by day 3, occurring before any statistically significant drop in germination, identifying it as the earliest indicator of seed deterioration. View evidence ↗
- A strong correlation (r = 0.94, p < 0.01) between MDA and leachate electrical conductivity confirms that membrane damage drives both markers. View evidence ↗
- Regression analysis attributed 31.4% of quality decline to lipid peroxidation, 24.7% to antioxidant exhaustion, and 19.8% to loss of membrane integrity. View evidence ↗
What it means
- The authors recommend that seed testing laboratories use MDA assays in addition to standard germination tests for seeds intended for long-term storage. View evidence ↗
- The authors conclude that the 6-day peak in antioxidant activity represents a window for potential recovery; beyond this point, seed damage appears irreversible. View evidence ↗
- The study was limited to two cultivars; the authors state that broader screening is needed to determine if the biphasic enzyme pattern is universal across Polish wheat genotypes. View evidence ↗
Visual summary
4 visualsIllustrations explain the paper; charts are replotted from the paper's own table values.
Biphasic Antioxidant Response
AI-generated conceptual illustration (wheat seeds). It explains the idea and does not show study data.
View source evidence ↗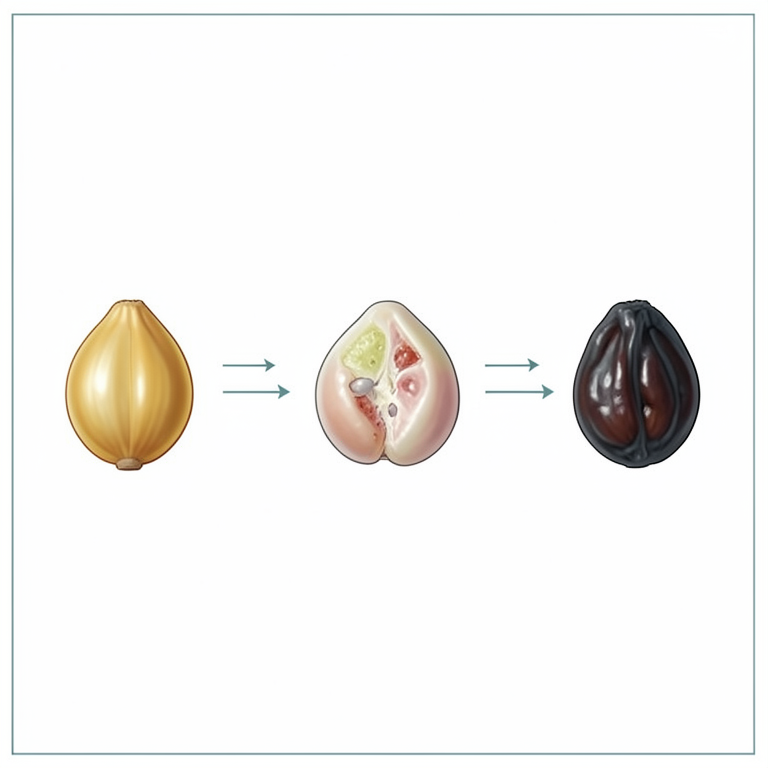
Timeline of Seed Deterioration
AI-generated conceptual illustration (wheat seeds). It explains the idea and does not show study data.
View source evidence ↗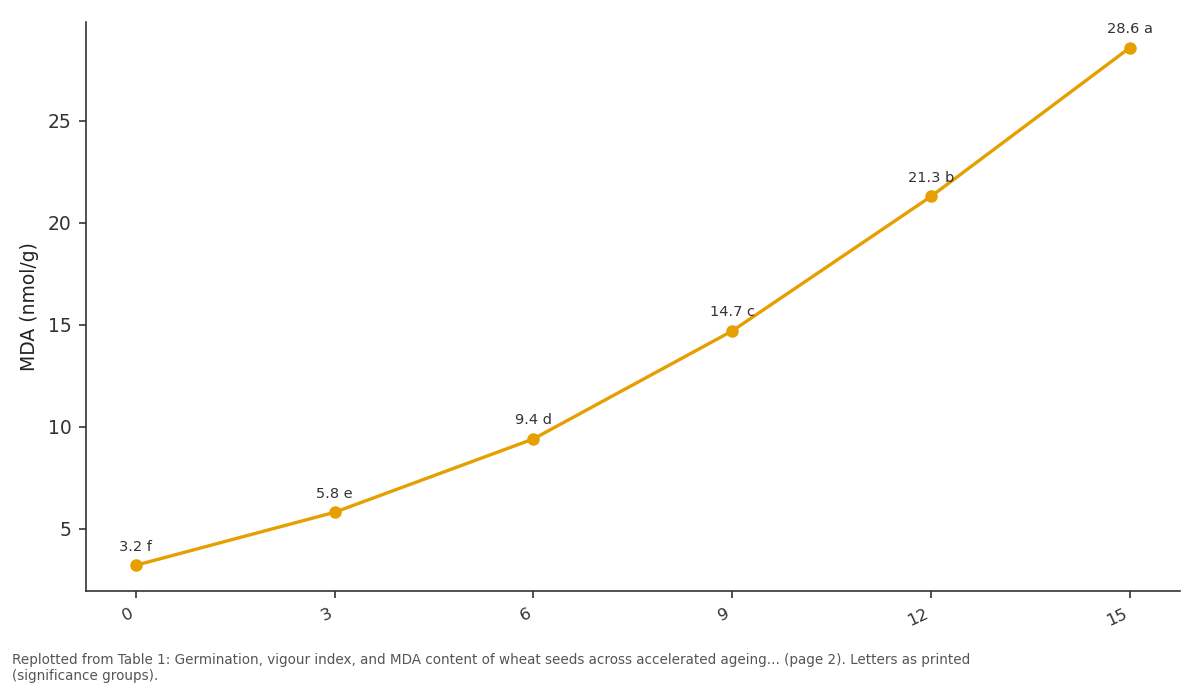
MDA (nmol/g): 0 vs 3 vs 6 vs 9 vs 12
Replotted from Table 1 (page 2) of the original paper. Every bar is the paper's own table value.
View source evidence ↗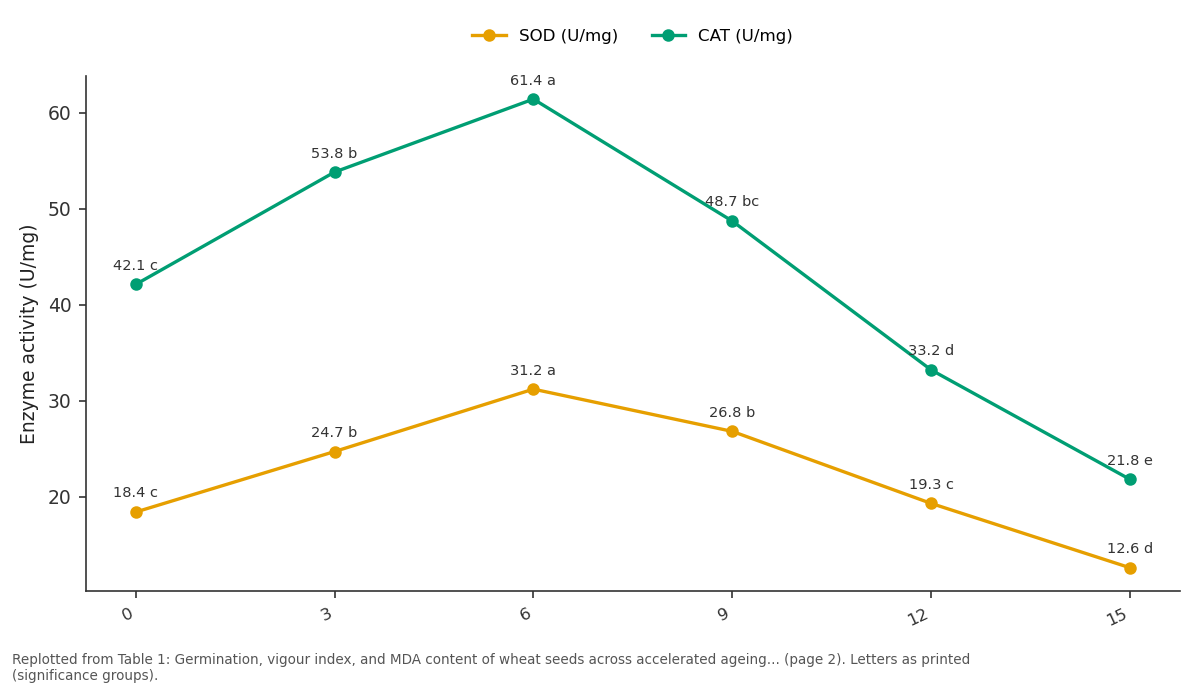
SOD (U/mg) and CAT (U/mg): 0 vs 3 vs 6 vs 9 vs 12
Replotted from Table 1 (page 2) of the original paper. Every bar is the paper's own table value.
View source evidence ↗Figures & tables
From the original paper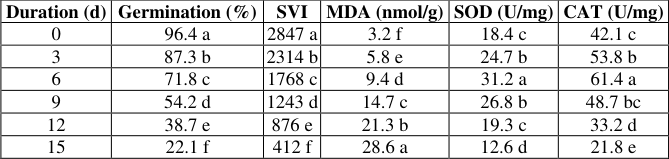 Table 1
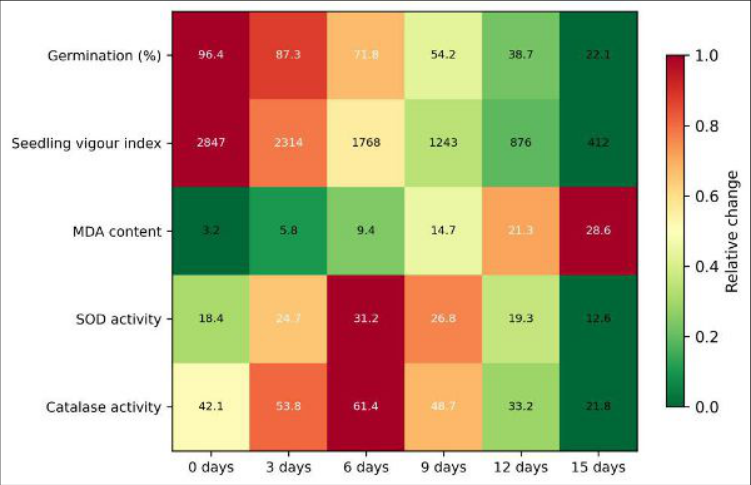 Figure 1
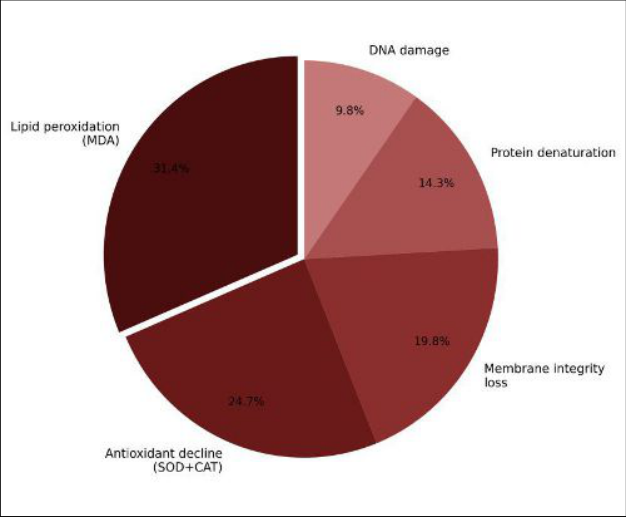 Figure 2
Introduction
It seems paradoxical that seeds-evolved to survive for years in soil-can lose viability within months if storage conditions slip even slightly outside the safe zone [1] . Wheat (Triticum aestivum L.) is the world's most widely stored cereal, and seed quality at sowing determines stand establishment, yield potential, and ultimately food security [2] . In Poland, where wheat occupies roughly 2.3 million hectares, seed lots are often carried over from one season to the next, and storage conditions in on-farm bins rarely match the controlled environments of commercial seed warehouses [3] . Seed deterioration is driven by a cascade of biochemical events: lipid peroxidation damages cell membranes, leaked metabolites fuel microbial growth, and the antioxidant defence system-superoxide dismutase (SOD), catalase (CAT), and peroxidase-gradually becomes overwhelmed [4,5] . Accelerated ageing (AA) at elevated temperature and humidity compresses this timeline from months into days, providing a practical laboratory model for studying deterioration mechanisms [6] . Earlier AA work on wheat established dose-response curves for germination loss, but few investigations tracked the full suite of enzymatic and membrane markers at the same time [7] . This research followed both physiological and biochemical indicators across six ageing durations to map the sequence of decline and identify the most sensitive early-warning markers.
Materials and Methods
Materials and Methods
Reagents and Chemicals
Thiobarbituric acid (TBA), trichloroacetic acid (TCA), nitroblue tetrazolium (NBT), riboflavin, hydrogen peroxide, and bovine serum albumin were obtained from Sigma-Aldrich (Poznań distributor). All reagents were analytical grade. Extraction buffer for enzyme assays (50 mM potassium phosphate, pH 7.0, containing 1 mM EDTA and 1% PVP) was prepared fresh before each extraction batch [8] .
Materials
The research was conducted at the seed physiology laboratory of the Silesian Agricultural College, Gliwice, Poland (50.29° N, 18.67° E) from September 2022 to June 2024. Institutional approval was granted by the College's Research Committee (Ref. SAC/RC/2022-011, August 2022). Two winter wheat cultivars-Arkadia (high vigour) and Bamberka (moderate vigour)-were obtained from the Plant Breeding Station in Smolice. Initial seed moisture was adjusted to 12% and confirmed by oven drying (130 °C, 1 h). Seeds were aged in a controlled chamber at 41±0.5 °C and 100% RH for 0, 3, 6, 9, 12, and 15 days. Each treatment × cultivar combination had four replicates of 100 seeds [9] .
Quality Control
Germination tests followed ISTA rules: 100 seeds on moist blotter paper at 20 °C, scored at 4 and 8 days. Electrical conductivity (EC) of seed leachate was measured after soaking 50 seeds in 75 mL deionised water for 24 h at 20 °C (Mettler Toledo FiveGo conductivity meter, calibrated daily against 1,413 μS/cm KCl standard). All spectrophotometric assays were run on a UV-Vis spectrophotometer zeroed against reagent blanks [10] .
Methods
MDA content was measured by the TBA reaction: seed extract was mixed with 0.5% TBA in 20% TCA, heated at 95 °C for 30 min, and absorbance read at 532 nm (correcting for non-specific at 600 nm). SOD activity was determined by the NBT photoreduction method at 560 nm. CAT activity was measured by the disappearance of H₂O₂ at 240 nm.
Seedling vigour index (SVI) was calculated as germination percentage × mean seedling length (cm). Data were analysed by two-way ANOVA (cultivar × ageing duration) and Pearson correlation coefficients were computed among all traits [11] .
Results
Results
Comprehensive Interpretation
The heatmap (Figure 1) reveals that MDA increase was detectable by day 3-before germination showed a statistically significant drop-making it the earliest indicator of deterioration. SOD and CAT displayed an inverted-U pattern, peaking mid-ageing before collapsing. The pie chart (Figure 2) attributes 31.4% of quality decline to lipid peroxidation, 24.7% to antioxidant exhaustion, and 19.8% to membrane integrity loss, based on multiple regression weightings. The correlation between MDA and leachate EC was 0.94 (p<0.01), confirming that membrane damage drives both indicators simultaneously.
Discussion
The inverted-U pattern of antioxidant enzymes-rising through day 6 then declining-matches the "biphasic response" model described in soybean and maize seeds, where the repair system initially up-regulates before being overwhelmed by cumulative reactive oxygen species [4,5] . The 6-day inflection point may represent the practical window during which seeds can still recover if returned to cool, dry storage. After this threshold, damage appears irreversible.
MDA's early responsiveness (detectable at day 3, before germination drops significantly) supports its use as a predictive quality marker in seed testing laboratories. Current ISTA rules rely on germination percentage, which lags behind biochemical deterioration by several days [10] .
Adopting MDA screening could provide advance warning that a seed lot is losing viability, allowing timely intervention. One limitation was testing only two cultivars; broader genotypic screening would clarify whether the biphasic enzyme pattern is universal in Polish wheats.
Conclusion
Accelerated ageing of stored wheat seeds produced a predictable cascade: lipid peroxidation (MDA increase) appeared first, followed by a transient antioxidant defence peak at day 6, and culminating in germination collapse by day 15. MDA content emerged as the earliest and most reliable single marker of quality decline (r =-0.97 with germination). Seed testing laboratories should consider incorporating MDA assays alongside standard germination tests for lots destined for extended storage. Understanding the 6-day inflection point in antioxidant activity could inform storage management decisions by flagging the boundary between recoverable and irreversible damage.
Figures and tables from the paper
| Duration (d) | Germination (%) | SVI | MDA (nmol/g) | SOD (U/mg) | CAT (U/mg) |
|---|---|---|---|---|---|
| 0 | 96.4 a | 2847 a | 3.2 f | 18.4 c | 42.1 c |
| 3 | 87.3 b | 2314 b | 5.8 e | 24.7 b | 53.8 b |
| 6 | 71.8 c | 1768 c | 9.4 d | 31.2 a | 61.4 a |
| 9 | 54.2 d | 1243 d | 14.7 c | 26.8 b | 48.7 bc |
| 12 | 38.7 e | 876 e | 21.3 b | 19.3 c | 33.2 d |
| 15 | 22.1 f | 412 f | 28.6 a | 12.6 d | 21.8 e |
Table text extracted from the original PDF; superscript letters are shown inline. The original table image is below.
View original table image
References
19 in the original paper- Walters C, Wheeler LM, Grotenhuis JM. Coming of age: The past, present, and future of seed science. Seed Science Research. 2005;15(4):289-307.
- GUS. Statistical yearbook of agriculture. Central Statistical Office, Poland. 2023;1:1-410.
- Bewley JD, Bradford KJ, Hilhorst HWM, Nonogaki H. Seeds: Physiology of development, germination and dormancy. Springer. 2013;3(1):1-392.
- Bailly C. Active oxygen species and antioxidants in seed biology. Seed Science Research. 2004;14(2):93107.
- Priestley DA. Seed aging: Implications for seed storage and persistence in the soil. Cornell University Press. 1986;1(1):1-304.
- Delouche JC, Baskin CC. Accelerated aging techniques for predicting the relative storability of seed lots. Seed Science and Technology. 1973;1(2):427-452.
- Lehner A, Mamadou N, Poels P, Côme D, Bailly C, Corbineau F. Changes in soluble carbohydrates, lipid peroxidation and antioxidant enzyme activities in the embryo during ageing in wheat grains. Journal of Cereal Science. 2008;47(3):555-565.
- Heath RL, Packer L. Photoperoxidation in isolated chloroplasts: I. Kinetics and stoichiometry of fatty acid peroxidation. Archives of Biochemistry and Biophysics. 1968;125(1):189-198.
- ISTA. International rules for seed testing. International Seed Testing Association. 2021;2021:1-300.
- Hampton JG, TeKrony DM. Handbook of vigour test methods. International Seed Testing Association. 1995;3:1-117.
- Beauchamp C, Fridovich I. Superoxide dismutase: Improved assays and an assay applicable to acrylamide gels. Analytical Biochemistry. 1971;44(1):276-287.
- McDonald MB. Seed deterioration: Physiology, repair and assessment. Seed Science and Technology. 1999;27(1):177-237.
- Kibinza S, Vinel D, Côme D, Bailly C, Corbineau F. Sunflower seed deterioration as related to moisture content during ageing, energy metabolism and active oxygen species scavenging. Physiologia Plantarum. 2006;128(3):496-506.
- Kapoor N, Arya A, Siddiqui MA, Amir A, Kumar H. Seed deterioration in chickpea under accelerated ageing. Asian Journal of Plant Sciences. 2010;9(3):158162.
- Coolbear P, Francis A, Grierson D. The effect of low temperature pre-sowing treatment on the germination performance and membrane integrity of artificially aged tomato seeds. Journal of Experimental Botany. 1984;35(11):1609-1617.
- Sharma SN, Maheshwari A. Expression patterns of DNA repair genes associated with priming small and large wheat seeds. Seed Science and Technology. 2015;43(2):303-309.
- Balesevic-Tubic S, Tatic M, Dordevic V, Nikolic Z, Dukic V. Seed viability of oil crops depending on storage conditions. Helia. 2010;33(52):153-160.
- Mohammadi H, Soltani A, Sadeghipour HR, Zeinali E. Effects of seed aging on subsequent seed reserve utilization and seedling growth in soybean. International Journal of Plant Production. 2011;5(1):6570.
- Goel A, Goel AK, Sheoran IS. Changes in oxidative stress enzymes during artificial ageing in cotton seeds. Journal of Plant Physiology. 2003;160(9):1093-1100.