
Research article · 2025 · Full text
International Journal of Agriculture and NutritionOptimization of drip irrigation scheduling for improving water productivity in greenhouse tomato
Volume 7(5) · Pages 163–166 · DOI: 10.33545/26646064.2025.v7.i5c.589 ↗
Research areasIrrigation Practices and Water ManagementEngineering and Agricultural InnovationsInnovations in Aquaponics and Hydroponics Systems
Abstract
Author-writtenSince greenhouse tomato production expanded across the Arabian Peninsula in the 1990s, water-use efficiency has remained a persistent challenge in hyper-arid environments. This research compared four drip irrigation scheduling methods—daily (T1), alternate day (T2), soil-moisture sensor-based (T3), and every third day (T4)—for greenhouse tomato (cv. GS-12) at the Hail Institute of Agricultural Sciences, Saudi Arabia, during 2022–23 and 2023–24. A randomized complete block design with four replications was used across two consecutive winter cropping seasons. Sensor-based scheduling (T3) produced the highest marketable fruit yield (87.4 t ha⁻¹) while consuming 22.6% less water than daily irrigation. Water productivity reached 31.8 kg m⁻³ under T3, compared with 22.4 kg m⁻³ under T1. Soil moisture under sensor-based scheduling remained within 68–82% of field capacity throughout the crop cycle, avoiding both waterlogging and moisture deficit. Daily irrigation led to excess drainage and nutrient leaching, while the every-third-day schedule caused periodic wilting and blossom-end rot. These results confirm that real-time sensor-based irrigation optimizes water use in arid-zone greenhouse tomato production.
Summary
Source-checkedPlain-language reading of the full paper, prepared with AI and checked against the text. Each point links to the authors' own words.
Why it matters
- Water-use efficiency is a critical and ongoing challenge for greenhouse tomato production in the hyper-arid environments of the Arabian Peninsula. View evidence ↗
- Agriculture in the Hail region relies on the Saq-Ram aquifer, which is a non-renewable fossil source with declining water levels. View evidence ↗
- Common daily irrigation practices often ignore actual soil moisture or crop needs, resulting in wasted water and nutrient leaching. View evidence ↗
The question
- The study aimed to determine which of four drip irrigation schedules maximizes fruit yield and water productivity for greenhouse tomatoes in Hail, Saudi Arabia. View evidence ↗
What they did
- The experiment tested four schedules, daily, alternate day, sensor-based, and every third day, using GS-12 tomato cultivars over two winter seasons (2022–24). View evidence ↗
- The researchers employed a randomized complete block design with four replications. View evidence ↗
- For the sensor-based treatment, irrigation was activated when moisture at 15 cm fell below 70% of field capacity and stopped at 85%. View evidence ↗
- The study measured total and marketable yield (fruit >50 g without defects) and calculated water productivity as marketable yield per unit of water applied. View evidence ↗
What they found
- The sensor-based scheduling (T3) achieved the highest marketable fruit yield at 87.4 t ha⁻¹. View evidence ↗
- Water productivity for the sensor-based method was 31.8 kg m⁻³, which is 42% higher than the daily irrigation method (T1). View evidence ↗
- The sensor-based approach reduced water consumption by 25.4% compared to daily irrigation. View evidence ↗
- While the every-third-day schedule was the most water-efficient, it resulted in a 16.4% loss in marketable yield and the highest incidence of blossom-end rot (9.4%). View evidence ↗
- The sensor-based treatment provided the best fruit quality balance, with a TSS of 4.8 °Brix and the highest average fruit weight of 131.2 g. View evidence ↗
- Sensor-based scheduling kept soil moisture in an optimal range, preventing the over-watering seen in daily schedules and the deficits seen in every-third-day schedules. View evidence ↗
What it means
- The authors conclude that real-time sensor technology should be adopted for managing irrigation in arid-zone greenhouse vegetable production. View evidence ↗
- The authors state that the investment in sensors and controllers can be recovered within one season due to increased yield and water savings. View evidence ↗
- The authors suggest that future research should test different moisture trigger thresholds and the integration of weather-based evapotranspiration forecasts. View evidence ↗
Visual summary
3 visualsIllustrations explain the paper; charts are replotted from the paper's own table values.
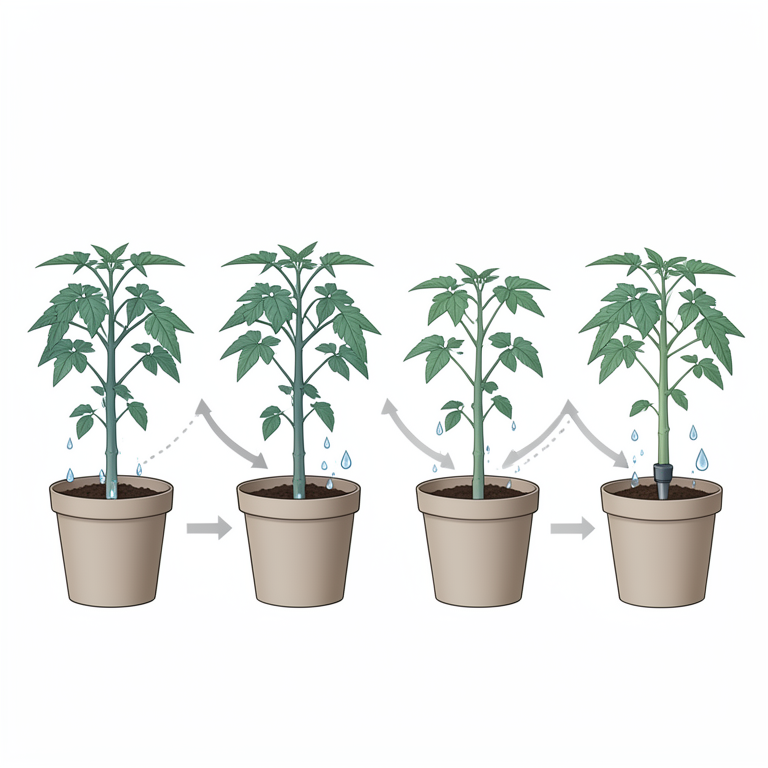
Irrigation Scheduling Comparison
AI-generated conceptual illustration (greenhouse tomato plants in pots with drip irrigation systems). It explains the idea and does not show study data.
View source evidence ↗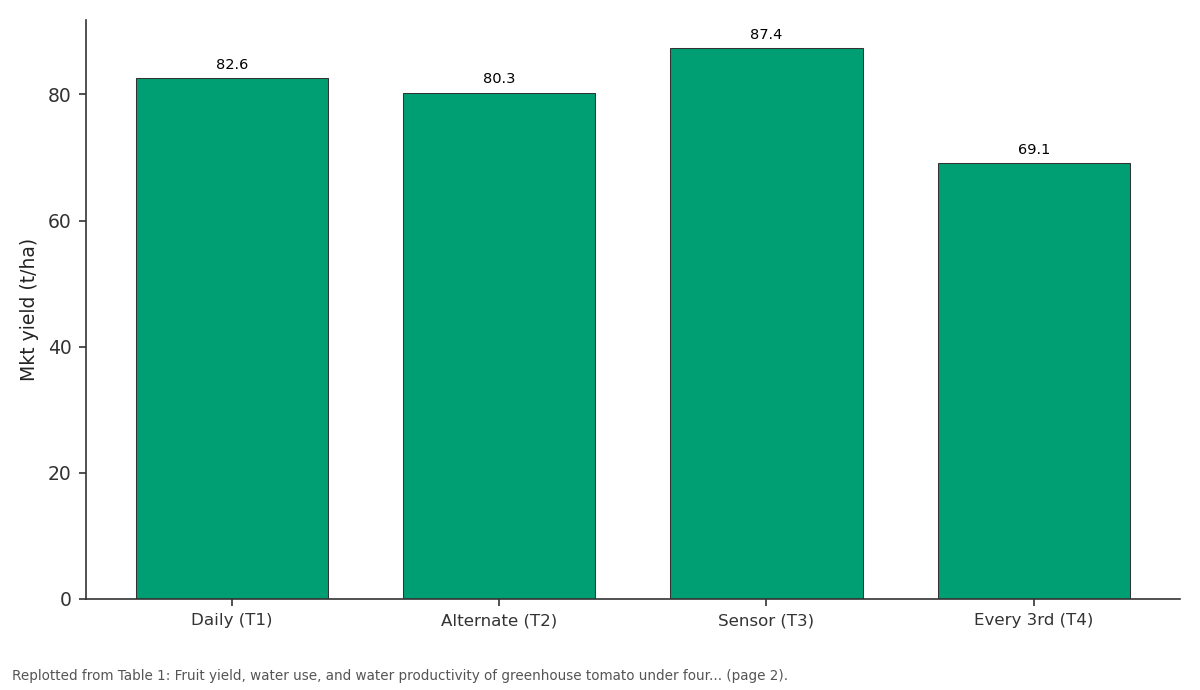
Mkt yield (t/ha): Daily (T1) vs Alternate (T2) vs Sensor (T3) vs Every 3rd (T4)
Replotted from Table 1 (page 2) of the original paper. Every bar is the paper's own table value.
View source evidence ↗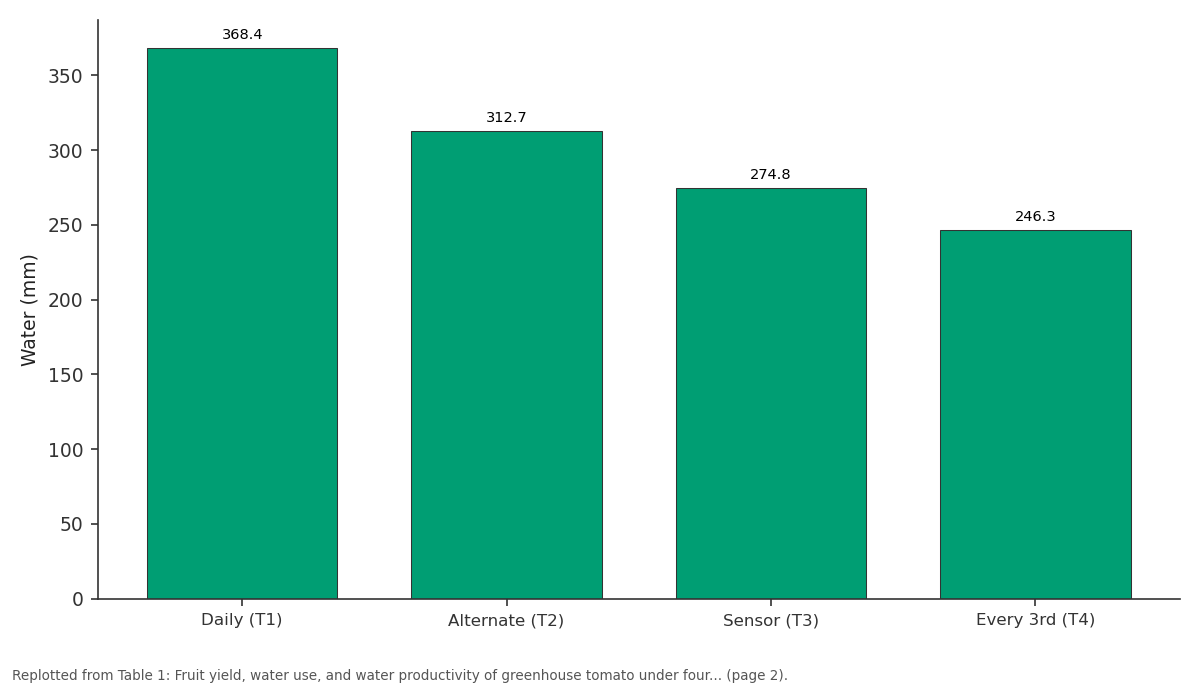
Water (mm): Daily (T1) vs Alternate (T2) vs Sensor (T3) vs Every 3rd (T4)
Replotted from Table 1 (page 2) of the original paper. Every bar is the paper's own table value.
View source evidence ↗Figures & tables
From the original paper Table 1
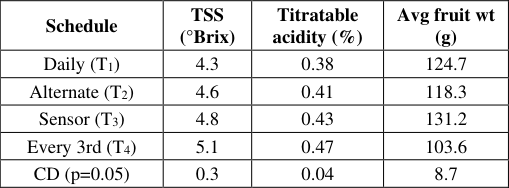 Table 2
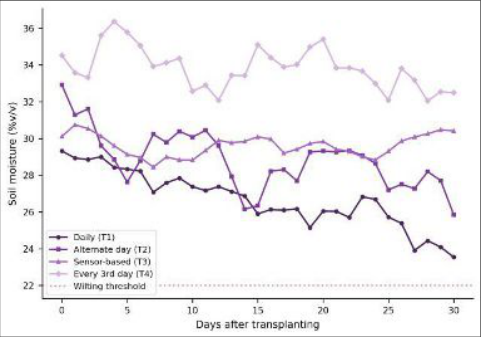 Figure 1
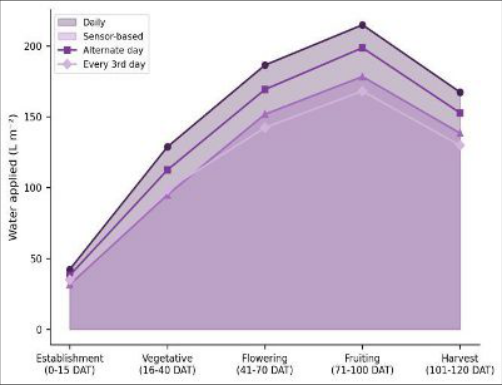 Figure 2
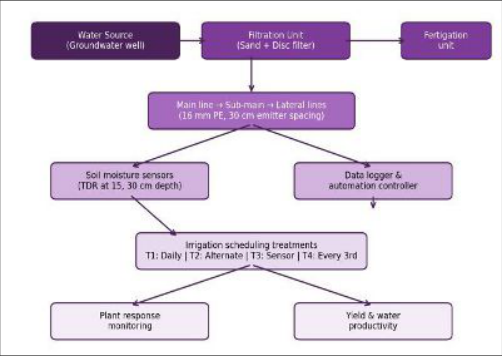 Figure 3
Introduction
The history of irrigated agriculture in the Hail region of Saudi Arabia dates back centuries, but the shift from traditional flood irrigation to pressurized drip systems began only in the mid-1980s with government-backed modernization programs [1] . Today, greenhouse vegetable production-particularly tomato, cucumber, and pepper-accounts for a growing share of fresh produce supply in the Kingdom, with an estimated 12, 000 hectares under protected cultivation [2] . However, water scarcity remains a defining constraint: the Saq-Ram aquifer system, the main source for Hail's agriculture, is a non-renewable fossil aquifer with declining water tables [3] . Drip irrigation has been widely adopted in Saudi greenhouse operations, but scheduling practices vary enormously. Many growers irrigate daily by default, regardless of crop stage or actual soil moisture status, leading to water wastage through deep percolation and potential nutrient leaching [4,5] . Conversely, infrequent irrigation saves water but risks moisture stress during sensitive periods like flowering and fruit set, causing yield losses from blossom-end rot and reduced fruit size [6] . Soil moisture sensor technology offers a middle path by triggering irrigation only when rootzone moisture falls below a pre-set threshold [7] . Several commercial sensors-including time-domain reflectometry (TDR) and capacitance probes-can provide real-time data to automated controllers [8] . But their adoption in Saudi greenhouse operations has been slow, partly because comparative data against conventional fixed-interval schedules are limited for local conditions [9] . This research compared four drip irrigation scheduling approaches to identify the method that maximizes fruit yield and water productivity in greenhouse tomato under the hyper-arid conditions of Hail, Saudi Arabia. coefficient (Kc) values of 0.45, 0.75, 1.05, and 0.85 were applied for establishment, vegetative, flowering-fruiting, and harvest stages, respectively [10] . For the sensor-based treatment (T 3 ), TDR probes (CS616, Campbell Scientific) were installed at 15 and 30 cm depths in each replication, linked to a CR1000 data logger. Irrigation was triggered when volumetric moisture at 15 cm dropped below 70% of field capacity and terminated at 85%. Daily and alternateday schedules applied a fixed volume calculated from Kc × ET₀ × crop factor, while every-third-day treatment applied triple the daily dose per event.
Materials and Methods
Materials and Methods
Materials
The trial was conducted in a 1, 200 m² climate-controlled polyethylene greenhouse at the Hail Institute of Agricultural Sciences (27°31′N, 41°42′E, elevation 1, 015 m). Tomato seedlings (cv. GS-12, indeterminate) were transplanted at the four-leaf stage into raised beds filled with a sandy loam growing medium (pH 7.4, EC 1.2 dS m⁻¹). Inline drip laterals (16 mm PE, emitter spacing 30 cm, discharge 2.0 L h⁻±) were laid along each row. Fertigation used a 19:19:19 NPK water-soluble fertilizer supplemented with calcium nitrate at fruit set. Groundwater (EC 0.9 dS m⁻¹, SAR 3.1) was the irrigation source.
Methods
Four irrigation schedules were compared in a randomized complete block design with four replications over two winter seasons (October-March 2022-23 and 2023-24). Treatments were: T 1 (daily), T 2 (alternate day), T 3 (sensorbased, threshold 70% FC), and T 4 (every third day). Each plot contained 20 plants in two rows. Total water applied was metered with inline flow sensors. Soil moisture was monitored in all treatments using TDR probes at 15 and 30 cm. Fruit yield was recorded as total and marketable (>50 g, no defects). Water productivity (WP) was calculated as marketable yield per unit of water applied (kg m⁻³). Fruit quality parameters included total soluble solids (TSS, refractometer), titratable acidity, and incidence of blossomend rot (BER). Data were analyzed by ANOVA with Tukey's HSD (p ≤ 0.05) in Statistix 10.
Greenhouse Climate
Inside the greenhouse, day temperatures ranged from 24 to 32 °C, night temperatures from 14 to 19 °C, and relative humidity from 45 to 72%. Ventilation was provided by exhaust fans and evaporative cooling pads that maintained the vapor pressure deficit below 2.5 kPa during peak afternoon hours. Outside ambient temperatures during December-February dropped to 2-4 °C at night, requiring nighttime heating in some weeks. Sensor-based scheduling (T 3 ) produced the highest marketable yield (87.4 t ha⁻¹) and the lowest blossom-end rot incidence (1.7%), while using 25.4% less water than daily irrigation (Table 1). Water productivity under T 3 (31.8 kg m⁻³) was 42% higher than T 1 . The every-third-day schedule saved the most water but suffered a 16.4% marketable yield penalty and the highest BER (9.4%). Sensor-based scheduling maintained soil moisture within a narrow optimal range (Figure 1), avoiding both the chronic excess seen under daily irrigation and the periodic deficits under every-third-day scheduling. The alternate-day treatment showed moderate oscillations but generally stayed above the wilting threshold. TSS increased progressively from daily to every-third-day scheduling (Table 2), reflecting a concentration effect under mild water deficit. But the sensor-based treatment achieved the best balance: high TSS (4.8 °Brix) with the largest average fruit weight (131.2 g), avoiding the size penalty of extended irrigation intervals.
| Schedule | TSS (°Brix) | Titratable acidity (%) | Avg fruit wt (g) |
|---|---|---|---|
| Daily (T1) | 4.3 | 0.38 | 124.7 |
| Alternate (T2) | 4.6 | 0.41 | 118.3 |
| Sensor (T3) | 4.8 | 0.43 | 131.2 |
| Every 3rd (T4) | 5.1 | 0.47 | 103.6 |
| CD (p=0.05) | 0.3 | 0.04 | 8.7 |
Table text extracted from the original PDF; superscript letters are shown inline. The original table image is below.
View original table image
| Schedule | Total yield (t/ha) | Mkt yield (t/ha) | Water (mm) | WP (kg/m³) | BER (%) |
|---|---|---|---|---|---|
| Daily (T1) | 91.2 | 82.6 | 368.4 | 22.4 | 3.1 |
| Alternate (T2) | 88.7 | 80.3 | 312.7 | 25.7 | 4.8 |
| Sensor (T3) | 92.8 | 87.4 | 274.8 | 31.8 | 1.7 |
| Every 3rd (T4) | 78.3 | 69.1 | 246.3 | 28.1 | 9.4 |
| CD (p=0.05) | 4.2 | 3.8 | 18.6 | 2.3 | 1.6 |
Table text extracted from the original PDF; superscript letters are shown inline. The original table image is below.
View original table image
Results
Results
Comprehensive Interpretation
The sensor-based approach consistently delivered the best combination of yield, quality, and water savings across both seasons. Its advantage lies in matching water supply to realtime crop demand rather than relying on fixed calendars that ignore day-to-day variation in evapotranspiration.
Discussion
The 42% improvement in water productivity under sensorbased scheduling compared with daily irrigation is consistent with reports from Mediterranean greenhouse systems [7,8] . The mechanism is straightforward: sensors prevent over-irrigation during cool, cloudy periods when ET is low and ensure adequate supply during hot, high-radiation days. This dynamic adjustment isn't possible with fixedinterval approaches. Daily irrigation, while producing high total yields, wasted water through drainage below the root zone. In a nonrenewable aquifer context like Hail, this excess application has both economic and environmental costs [3] . The alternate-day schedule offered moderate water savings but couldn't match sensor-based performance because it still applied a fixed volume regardless of conditions [5] . The every-third-day treatment, despite having the highest TSS (5.1 °Brix), showed unacceptable BER levels (9.4%) and a 16.4% yield loss. This confirms that extending intervals beyond two days risks calcium transport disruption to developing fruit, a well-documented cause of BER in tomato [6] . The results suggest that for hyper-arid greenhouse conditions, sensor-based scheduling at a 70% FC trigger threshold provides the optimal balance. Future work should evaluate different trigger thresholds (60%, 65%, 75%) and test whether integrating weather-based ET forecasts with sensor data could further improve scheduling precision.
Conclusion
Sensor-based drip irrigation scheduling at a 70% field capacity trigger threshold maximized marketable fruit yield (87.4 t ha⁻¹) and water productivity (31.8 kg m⁻³) in greenhouse tomato at Hail, Saudi Arabia, while reducing water consumption by 25.4% compared with daily irrigation. Fruit quality was also best under sensor-based management, with high TSS, large fruit size, and minimal blossom-end rot. Daily irrigation wasted water through over-application, and every-third-day scheduling caused significant yield and quality penalties. The findings support the adoption of real-time sensor technology for irrigation management in arid-zone greenhouse vegetable production. Investment in soil moisture sensors and automated controllers can pay for itself within a single season through water savings and improved marketable yield. The approach is readily scalable to commercial greenhouse operations across the Arabian Peninsula.
Acknowledgement
Acknowledgements Funding SourcesThis research was funded through institutional grants from the Hail Institute of Agricultural Sciences for water management research. Institutional SupportThe authors thank the Department of Soil and Water Engineering, Hail Institute of Agricultural Sciences, for providing greenhouse facilities, sensor equipment, and technical support.
Figures and tables from the paper
References
21 in the original paper- Al-Ghobari HM. Estimation of reference evapotranspiration for southern region of Saudi Arabia. Irrigation Science. 2000;19(2):81-86.
- Alkolibi FM. Possible effects of global warming on agriculture and water resources in Saudi Arabia. Climatic Change. 2002;54(1):225-245.
- Abderrahman WA. Water demand management in Saudi Arabia. Water Management in Islam. 2001;6878.
- Harmanto, Salokhe VM, Babel MS, Tantau HJ. Water requirement of drip irrigated tomatoes grown in greenhouse in tropical environment. Agricultural Water Management. 2005;71(3):225-242.
- Patane C, Cosentino SL. Effects of soil water deficit on yield and quality of processing tomato under a Mediterranean climate. Agricultural Water Management. 2010;97(1):131-138.
- Taylor MD, Locascio SJ. Blossom-end rot: a calcium deficiency. Journal of Plant Nutrition. 2004;27(1):123-139.
- Munoz-Carpena R, Dukes MD. Automatic irrigation based on soil moisture for vegetable crops. EDIS. 2005;ABE356:1-9.
- Thompson RB, Gallardo M, Valdez LC, Fernandez MD. Using plant water status to define threshold values for irrigation management of vegetable crops using soil moisture sensors. Agricultural Water Management. 2007;88(1-3):147-158.
- Al-Omran AM, Sheta AS, Falatah AM, Al-Harbi AR. Effect of drip irrigation on squash yield and water-use efficiency in sandy calcareous soils. Agricultural Water Management. 2005;73(1):43-55.
- Allen RG, Pereira LS, Raes D, Smith M. Crop evapotranspiration: guidelines for computing crop water requirements. FAO Irrigation and Drainage Paper 56. 1998;Rome.
- Zotarelli L, Scholberg JM, Dukes MD, MunozCarpena R. Monitoring of nitrate leaching in sandy soils: comparison of three methods. Journal of Environmental Quality. 2007;36(4):953-962.
- Marouelli WA, Silva WLC. Water tension thresholds for processing tomatoes under drip irrigation in central Brazil. Irrigation Science. 2007;25(4):411-418.
- Kirda C, Cetin M, Dasgan Y, Topcu S, Kaman H, Ekici B. Yield response of greenhouse grown tomato to partial root drying and conventional deficit irrigation. Agricultural Water Management. 2004;69(3):191-201.
- Hanson BR, Hutmacher RB, May DM. Drip irrigation of tomato and cotton under shallow saline ground water conditions. Irrigation and Drainage Systems. 2006;20(2-3):241-252.
- Rouphael Y, Colla G, Battistelli A, Moscatello S, Proietti S, Rea E. Yield, water requirement, nutrient uptake and fruit quality of zucchini squash grown in soil and closed soilless culture. Journal of Horticultural Science and Biotechnology. 2004;79(3):423-430.
- Wang D, Kang Y, Wan S. Effect of soil matric potential on tomato yield and water use under drip irrigation condition. Agricultural Water Management. 2007;87(2):180-186.
- Doorenbos J, Kassam AH. Yield response to water. FAO Irrigation and Drainage Paper 33. 1979;Rome.
- Fereres E, Soriano MA. Deficit irrigation for reducing agricultural water use. Journal of Experimental Botany. 2007;58(2):147-159.
- Savvas D, Gruda N. Application of soilless culture technologies in the modern greenhouse industry: a review. European Journal of Horticultural Science. 2018;83(5):280-293.
- Qiu R, Song J, Du T, Kang S, Tong L, Chen R. Response of evapotranspiration and yield to planting density of solar greenhouse grown tomato in northwest China. Agricultural Water Management. 2013;130:44-51.
- Buttaro D, Santamaria P, Signore A, Cantore V, Boari F. Irrigation management of greenhouse tomato and cucumber using tensiometer: effects on yield, quality and water use. Agriculture and Agricultural Science Procedia. 2015;4:440-444.