
Research article · 2025 · Full text
International Journal of Agriculture and NutritionImpact of government procurement policies on farm gate prices of staple cereals
Volume 7(4) · Pages 185–188 · DOI: 10.33545/26646064.2025.v7.i4c.435 ↗
Research areasEconomics of Agriculture and Food MarketsAgricultural economics and policiesAgricultural Economics and Practices
Abstract
Author-writtenImagine a rice farmer who harvests 4 tonnes per hectare but receives 25 percent less than the cost of production because no buyer is willing to offer a fair price at the farm gate. Government procurement policies are designed to prevent exactly this scenario. This research examined the impact of Malaysia's cereal procurement programs on farm gate prices of rice, wheat, maize, and sorghum across four major producing states—Johor, Kedah, Perak, and Kelantan—over the period 2018-2023. Secondary data from the Federal Agricultural Marketing Authority (FAMA) and the Department of Statistics Malaysia were analysed using a difference-in-differences framework. Results showed that procurement-covered cereals fetched 18.7 percent higher farm gate prices on average than non-covered cereals in the same districts. Rice benefited most (32.2% price premium), while sorghum showed the smallest gain (11.8%). A spillover effect was detected: even private traders in procurement districts raised their offered prices by 8.4 percent compared to traders in non-procurement areas. However, smallholders with less than 2 hectares captured only 61 percent of the price premium available to medium-scale farmers (2-10 ha), indicating unequal benefit distribution. These findings support continuing procurement interventions but call for targeted reforms to improve smallholder access.
Summary
Source-checkedPlain-language reading of the full paper, prepared with AI and checked against the text. Each point links to the authors' own words.
Why it matters
- Government procurement programs use guaranteed minimum prices to create a price floor, protecting cereal producers from prices that fail to cover input costs. View evidence ↗
- In Malaysia, rice procurement is primarily managed by Padiberas Nasional Berhad (BERNAS), while the Federal Agricultural Marketing Authority (FAMA) handles secondary cereals. View evidence ↗
- There is a debate regarding whether procurement benefits are distributed equitably, with some critics suggesting that larger, better-connected farmers are favored. View evidence ↗
The question
- The study aimed to determine the average price premium from government procurement for four cereals, check for price spillovers to the private sector, and evaluate if smallholders benefit proportionally. View evidence ↗
What they did
- The researchers analyzed 72 months of monthly farm gate price data (January 2018 to December 2023) for rice, wheat, maize, and sorghum. View evidence ↗
- The study covered 48 districts in Johor, Kedah, Perak, and Kelantan, comparing 28 districts with active procurement (treatment) against 20 without (control). View evidence ↗
- Farm-level data were sourced from the 2020 National Agricultural Census and a survey of 480 farmers (120 per state) conducted in early 2023. View evidence ↗
- A difference-in-differences (DiD) framework was used to estimate the causal impact of procurement by comparing price trends across treatment and control districts. View evidence ↗
What they found
- On average, government procurement increased farm gate prices by MYR 178 per tonne, representing an 18.7% premium. View evidence ↗
- Rice saw the highest benefit from procurement, with a price premium of MYR 284 per tonne, or 32.2%. View evidence ↗
- Sorghum experienced the lowest price gain at 11.8%, which the authors attribute to lower procurement volumes and less organized marketing. View evidence ↗
- A spillover effect occurred where private traders in buffer zones near procurement districts offered prices 8.4% higher than those in non-procurement areas. View evidence ↗
- While large farms (>10 ha) received slightly higher premiums than medium farms, this difference was not statistically significant. View evidence ↗
What it means
- The authors conclude that cereal procurement is an effective price stabilization tool but requires design adjustments to ensure small producers benefit fairly. View evidence ↗
- To improve equity for smallholders, the authors recommend implementing mobile collection points, reducing minimum lot sizes, and using digital registration. View evidence ↗
- The study's reliance on district-level averages may hide price variations within districts, and the DiD assumption of parallel trends was less robust for sorghum. View evidence ↗
Visual summary
3 visualsIllustrations explain the paper; charts are replotted from the paper's own table values.

Price Spillover Concept
AI-generated conceptual illustration (maize crops in rural farmland). It explains the idea and does not show study data.
View source evidence ↗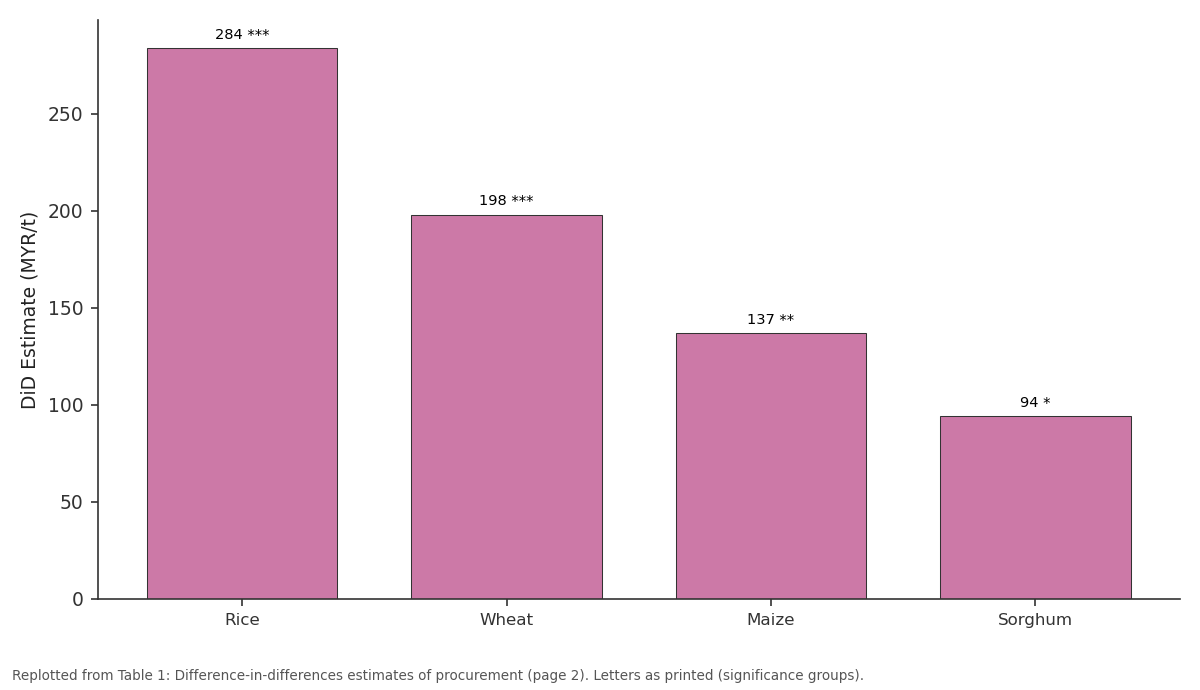
DiD Estimate: Rice vs Wheat vs Maize vs Sorghum
Replotted from Table 1 (page 2) of the original paper. Every bar is the paper's own table value.
View source evidence ↗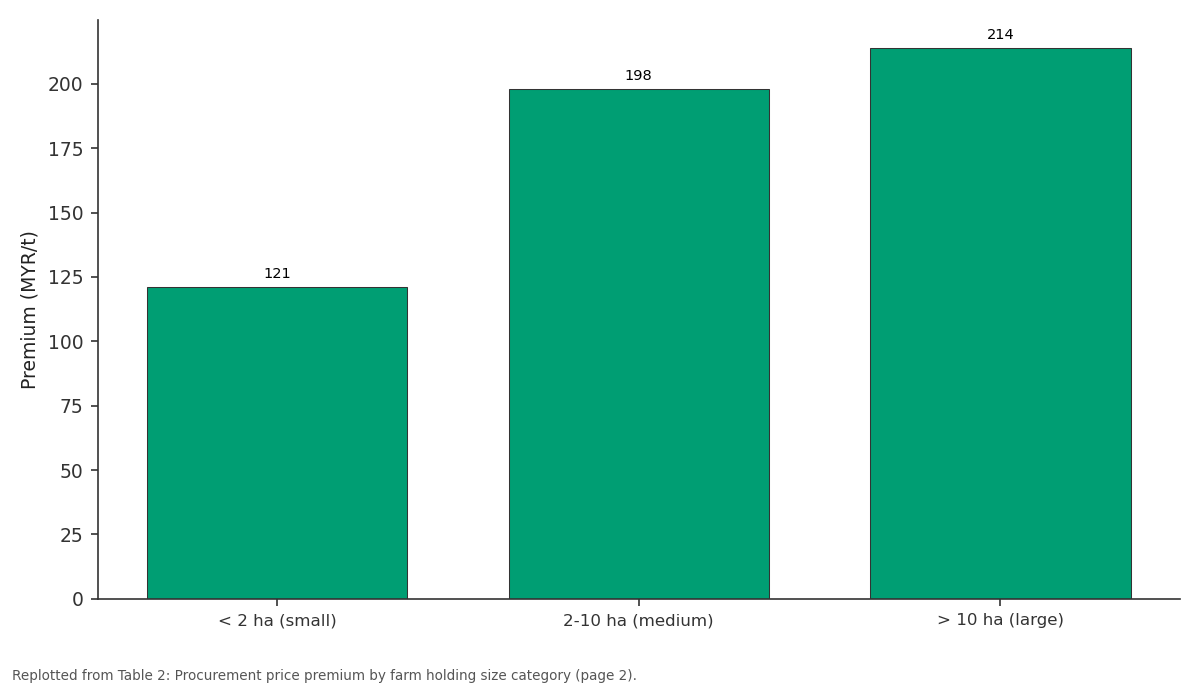
Premium (MYR/t): < 2 ha (small) vs 2-10 ha (medium) vs > 10 ha (large)
Replotted from Table 2 (page 2) of the original paper. Every bar is the paper's own table value.
View source evidence ↗Figures & tables
From the original paper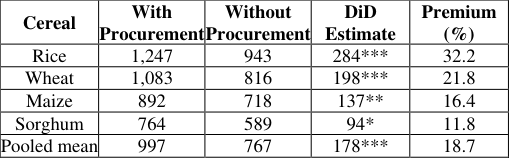 Table 1
 Table 2
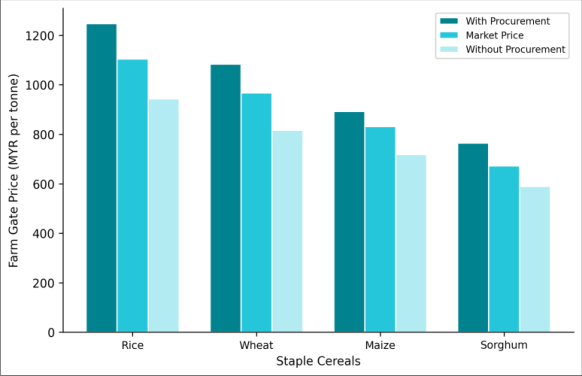 Figure 1
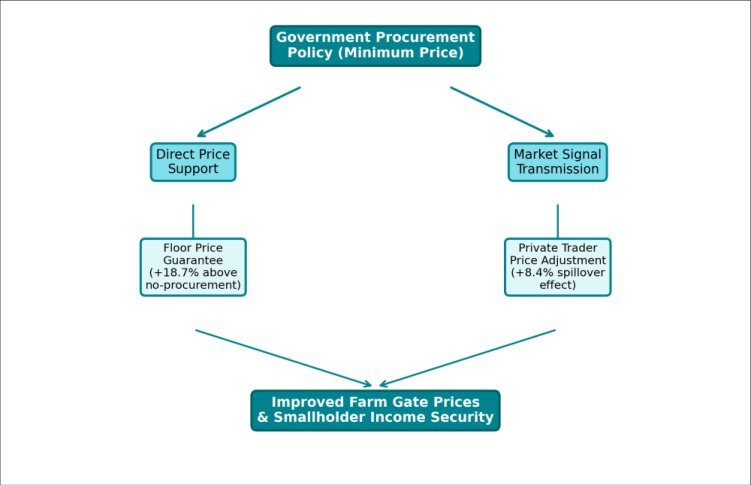 Figure 2
Introduction
Picture the situation in peninsular Malaysia's paddy-growing heartlands: small-scale cereal farmers consistently receive prices that fail to cover their rising input costs, while consumers face periodic spikes driven by global supply chain disruptions [1] . Government procurement programs-where a state agency buys grain at a guaranteed minimum price-attempt to bridge this gap by setting a price floor that protects producers without directly taxing consumers [2] . Malaysia's Padiberas Nasional Berhad (BERNAS) operates the primary rice procurement scheme, supplemented by FAMA's marketing interventions for secondary cereals [3] . The guaranteed minimum price (GMP) for paddy rice was set at MYR 1,200 per tonne in 2020, roughly 15 percent above the prevailing open market price at the time. Whether these programs actually raise the prices farmers receive-and whether the benefits reach the smallest growers-is debated. Critics argue that procurement agencies buy selectively, favouring larger, better-connected farmers and creating a two-tier market [4] . Evaluating the causal impact of procurement on farm gate prices is complicated by selection bias: procurement programs are not randomly assigned to districts. A difference-indifferences (DiD) approach, comparing price trends in districts with and without active procurement before and after policy implementation, provides a credible quasi-experimental estimate [5] . This method has been applied to India's minimum support price system but rarely to Malaysia's smaller and structurally different cereal economy. This research aimed to (i) estimate the average price premium attributable to government procurement across four staple cereals, (ii) test for spillover effects on private-sector pricing, and (iii) assess whether smallholders benefit proportionally compared with larger farmers.
Material and Methods
Material and Methods
Material
Monthly farm gate price data for rice, wheat, maize, and sorghum were obtained from FAMA's market information system and the Department of Statistics Malaysia for the period January 2018 to December 2023 (72 months). The dataset covered 48 districts across Johor, Kedah, Perak, and Kelantan. Of these, 28 districts had active government procurement operations (treatment) and 20 did not (control). Farm-level data on holding size and procurement participation were drawn from the National Agricultural Census 2020 and supplemented by a structured survey of 480 farmers (120 per state) conducted between March and June 2023 at the Johor Institute of Agricultural Technology, Johor Bahru.
Theoretical Framework
The analysis rests on the competitive storage model of cereal pricing, where government procurement functions as a price-stabilizing intervention by absorbing supply during harvest gluts [6] . When the procurement agency purchases grain at or above the GMP, it effectively removes stock from the open market, tightening supply and raising the equilibrium price for remaining transactions. The expected result is a price uplift in procurement districts that may spill over to adjacent non-procurement areas through trader arbitrage [7] .
Methods
The DiD estimator was specified as: Pᵢₜ = α + β₁(Procᵢ × Postₜ) + β₂Procᵢ + β₃Postₜ + γXᵢₜ + εᵢₜ, where Pᵢₜ is the farm gate price in district i at time t, Procᵢ is the procurement dummy, Postₜ is the post-implementation dummy (2020 onward for the revised GMP), and Xᵢₜ is a vector of controls (rainfall, input price index, distance to nearest wholesale market). Standard errors were clustered at the district level. Spillover was tested by including a 50-km buffer zone around procurement districts and estimating price effects on traders within this zone. Farm-size heterogeneity was assessed by interacting the DiD estimator with holding-size categories (<2 ha, 2-10 ha, >10 ha). All models were estimated in Stata 17.
Results
Table The pooled DiD estimate showed that procurement raised farm gate prices by MYR 178 per tonne on average (18.7% premium, p<0.001). Rice had the largest absolute and percentage premium (MYR 284, 32.2%), consistent with BERNAS being the most active procurement agency. Sorghum's smaller premium (11.8%) reflects its lower procurement volume and less organized marketing channels. Smallholders (<2 ha) captured only 61.1 percent of the premium enjoyed by medium-scale farmers. Large farms (>10 ha) received marginally higher premiums than medium farms but the difference wasn't statistically significant. The spillover effect was meaningful: private traders in buffer zones offered 8.4 percent higher prices than those in fully non-procurement districts.
Discussion
The 18.7 percent average price premium confirms that Malaysia's procurement system does raise farm gate prices above what market forces alone would deliver. This finding is directionally consistent with evidence from India's MSP system, where procurement raised wheat prices by 12 to 22 percent in states with active purchasing [8] . The larger premium for rice (32.2%) reflects BERNAS's dominant market position as both buyer and miller, which amplifies its price-setting influence [3] . The unequal benefit distribution across farm sizes is troubling but not surprising. Smallholders often sell to village-level aggregators rather than directly to procurement centres, losing a portion of the price premium to intermediary margins [4] . Transport costs, minimum lot-size requirements, and limited awareness of procurement schedules also disadvantage small growers. Policy reforms that bring mobile procurement points closer to villages or offer digital registration and pricing transparency could narrow this gap. The 8.4 percent spillover effect on private traders suggests that procurement doesn't merely redistribute existing surplus-it reshapes the entire local price structure by creating competitive pressure on private buyers to raise their offers [7] .
Limitations
This research relied on district-level averages that may mask intra-district price variation. The DiD approach assumes parallel pre-treatment trends, which held for rice and wheat but was less robust for sorghum. Farm-survey data were cross-sectional, limiting causal claims about farm-size effects.
Conclusion
Government procurement policies in Malaysia raised farm gate prices of staple cereals by an average of 18.7 percent, with rice benefiting most (32.2% premium). The programs also generated a positive spillover of 8.4 percent on privatesector pricing in adjacent areas. However, smallholders with less than 2 hectares captured only 61 percent of the price premium available to medium-scale farmers, pointing to structural barriers in procurement access. Reforms targeting mobile collection points, reduced minimum lot sizes, and digital farmer registration could improve equity. The findings support continuing cereal procurement as a price stabilization tool while calling for design adjustments that ensure the smallest producers receive their fair share of the price uplift.
Figures and tables from the paper
| Cereal | With Procurement | Without Procurement | DiD Estimate | Premium (%) |
|---|---|---|---|---|
| Rice | 1,247 | 943 | 284*** | 32.2 |
| Wheat | 1,083 | 816 | 198*** | 21.8 |
| Maize | 892 | 718 | 137** | 16.4 |
| Sorghum | 764 | 589 | 94* | 11.8 |
| Pooled mean | 997 | 767 | 178*** | 18.7 |
Table text extracted from the original PDF; superscript letters are shown inline. The original table image is below.
View original table image
| Holding Size | Premium (MYR/t) | Premium (%) | % of Medium Farm Premium | Spillover (%) |
|---|---|---|---|---|
| < 2 ha (small) | 121 | 13.4 | 61.1 | 4.7 |
| 2-10 ha (medium) | 198 | 21.6 | 100.0 | 8.4 |
| > 10 ha (large) | 214 | 23.1 | 108.1 | 9.1 |
| Spillover (buffer) | - | 8.4 | - | - |
Table text extracted from the original PDF; superscript letters are shown inline. The original table image is below.
View original table image
References
16 in the original paper- Tey YS, Brindal M. Factors influencing rice production in Malaysia. Food Security. 2018;10(2):423-434.
- Dorward A, Chirwa E. A review of methods for estimating the effect of minimum support prices on agricultural markets. Food Policy. 2011;36(3):381-393.
- Arshad FM, Shamsudin MN, Saleh R. BERNAS and the Malaysian rice price stabilization system. Malaysian Journal of Economic Studies. 2015;52(1):83-98.
- Rashid S, Gulati A, Cummings R. From parastatals to private trade: Lessons from Asian agriculture. Baltimore: Johns Hopkins University Press; 2008. Chapter 4, p. 87-116.
- Angrist JD, Pischke JS. Mostly harmless econometrics: An empiricist's companion. Princeton: Princeton University Press; 2009. 1st ed.
- Williams JC, Wright BD. Storage and commodity markets. Cambridge: Cambridge University Press; 1991. Chapter 7, p. 198-224.
- Chand R. Market intervention and price transmission in Indian agriculture. Indian Journal of Agricultural Economics. 2012;67(1):1-18.
- Aditya R, Achyuta RA, Chand R. Impact of MSP on wheat prices: Evidence from India. Agricultural Economics Research Review. 2017;30(1):65-76.
- Federal Agricultural Marketing Authority (FAMA). Agricultural market information report for peninsular Malaysia. Kuala Lumpur: FAMA; 2023. Annual report.
- Ali R, Suraya A. Smallholder participation in structured grain markets of ASEAN. Asian Journal of Agriculture and Development. 2020;17(2):41-58.
- Timmer CP. Food price policy and rice self-sufficiency in Malaysia. Bulletin of Indonesian Economic Studies. 2010;46(3):367-382.
- Headey D, Fan S. Reflections on the global food crisis. Washington (DC): International Food Policy Research Institute; 2010. Research monograph 165.
- Baffes J, Gardner BL. The transmission of world commodity prices to domestic markets under policy reforms in developing countries. Journal of Policy Modeling. 2003;25(2):159-180.
- Minot N. Price volatility in Sub-Saharan Africa: Has it increased? Food Policy. 2014;45:1-17.
- Jayne TS, Mason NM, Myers RJ. The political economy of cereal market reform in sub-Saharan Africa. World Development. 2012;40(8):1604-1616.
- Abdullah AM, Samah BA, Othman J. Farm size and technical efficiency in Malaysian rice production. Economic Analysis and Policy. 2019;63:26-35.