
Research article · 2025 · Full text
International Journal of Agriculture and NutritionNutrient budgeting and soil fertility status in intensive rice-wheat cropping zones
Volume 7(1) · Pages 156–159 · DOI: 10.33545/26646064.2025.v7.i1c.396 ↗
Research areasAgricultural Science and FertilizationRice Cultivation and Yield ImprovementPlant Growth and Agriculture Techniques
Abstract
Author-writtenFarmers in the Indo-Gangetic Plains face a practical dilemma every season: apply more fertiliser and risk profit erosion, or hold back and risk yield decline from nutrient mining. This research constructed nutrient budgets for nitrogen, phosphorus, and potassium across 60 rice-wheat fields in two districts of eastern Uttar Pradesh—Ayodhya and Ambedkar Nagar—during 2021–22 and 2022–23. Input-output analysis showed a mean N surplus of 34.7 kg ha⁻¹ yr⁻¹ but a K deficit of −41.3 kg ha⁻¹ yr⁻¹, indicating that farmers over-apply nitrogen while neglecting potassium. Phosphorus was near-balanced (+6.8 kg ha⁻¹ yr⁻¹). Available soil K declined by 18.4 mg kg⁻¹ over two years in plots with persistent K deficits. Apparent N recovery was only 38.2%, suggesting large losses via volatilisation and leaching. These findings call for rebalancing fertiliser use—reducing N by 15–20% while adding 40–50 kg K₂O ha⁻¹—to arrest potassium depletion without sacrificing yield.
Summary
Source-checkedPlain-language reading of the full paper, prepared with AI and checked against the text. Each point links to the authors' own words.
Why it matters
- Farmers in the Indo-Gangetic Plains must balance the risk of profit loss from over-fertilization against the risk of yield decline caused by nutrient mining. View evidence ↗
- Economic factors, such as subsidies making nitrogen cheap while potassium is not, lead farmers to over-apply urea and neglect potassium. View evidence ↗
- Potassium deficits are often invisible in the short term because soil reserves buffer the loss, but once exhausted, they cause abrupt and difficult-to-reverse yield drops. View evidence ↗
The question
- The study aimed to create nitrogen (N), phosphorus (P), and potassium (K) budgets for 60 farms in Ayodhya and Ambedkar Nagar, relate these to soil fertility changes over two years, and suggest fertilizer corrections. View evidence ↗
What they did
- Soil samples from a depth of 0–20 cm were collected from all 60 fields both before the 2021 kharif rice season and after the second wheat harvest in April 2023. View evidence ↗
What they found
- The apparent nitrogen recovery was only 38.2%, indicating that over 60% of applied nitrogen was lost, primarily through denitrification and ammonia volatilization from surface-applied urea. View evidence ↗
- The soil potassium depletion rate of approximately 9 kg K ha⁻¹ yr⁻¹ is critical, as yields in alluvial soils typically drop sharply once available K falls below 125 kg ha⁻¹. View evidence ↗
What it means
- A limitation of the study is that gaseous and leaching losses were estimated; the authors suggest using micro-meteorological equipment and suction lysimeters in future work to improve budget accuracy. View evidence ↗
- The two-year duration of the study was too short to reliably detect slow changes in soil organic carbon. View evidence ↗
Visual summary
1 visualsIllustrations explain the paper; charts are replotted from the paper's own table values.
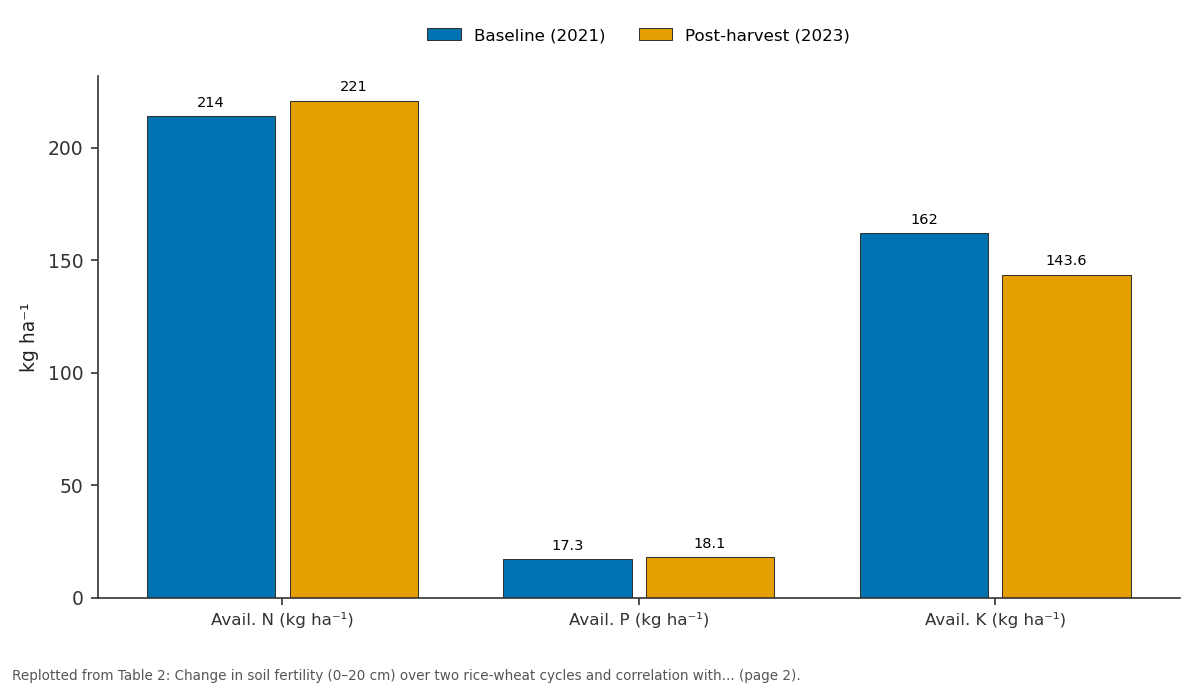
Baseline (2021) and Post-harvest (2023): Avail. N (kg ha⁻¹) vs Avail. P (kg ha⁻¹) vs Avail. K (kg ha⁻¹)
Replotted from Table 2 (page 2) of the original paper. Every bar is the paper's own table value.
View source evidence ↗Figures & tables
From the original paper Table 1
 Table 2
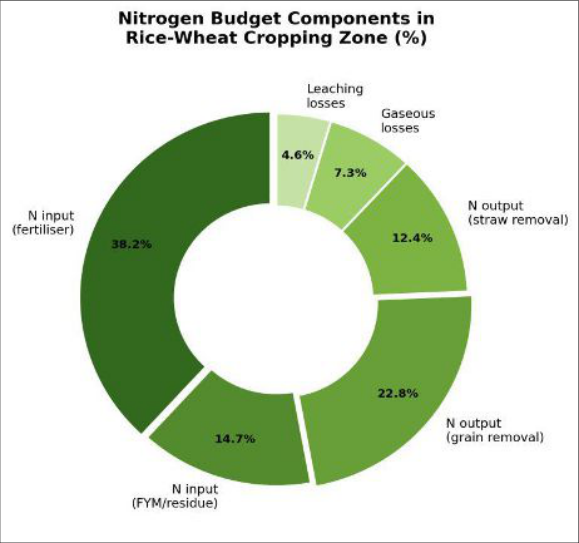 Figure 1
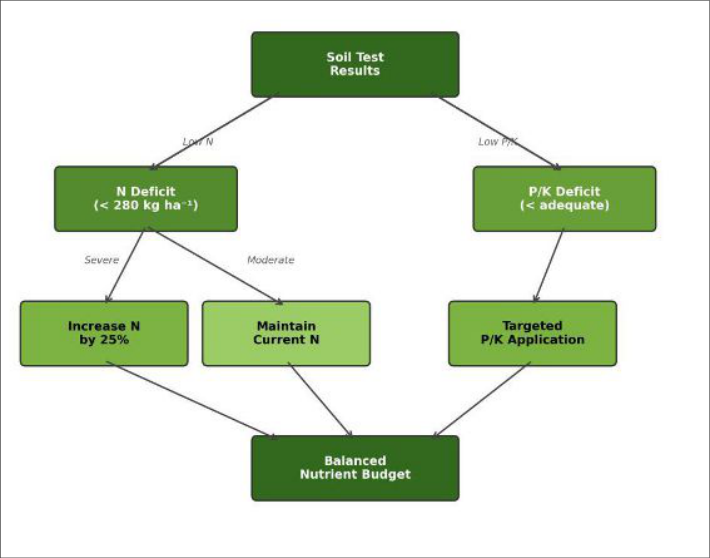 Figure 2
Introduction
Every rice-wheat farmer in eastern Uttar Pradesh faces the same practical dilemma: nitrogen fertiliser is subsidised and cheap, potassium is not-so urea bags pile up in the shed while muriate of potash is skipped entirely [1,2] . The short-term consequence is invisible, because soil K reserves buffer the deficit for several years. But once those reserves are exhausted, yield drops abruptly and is hard to reverse [3,4] . Nutrient budgeting-the systematic accounting of all nutrient inputs (fertiliser, manure, biological fixation, deposition) against all outputs (crop removal, leaching, gaseous losses)is the most direct way to detect imbalances before they become yield-limiting [5,6] . Published budgets for western UP and Punjab show N surpluses of 30-60 kg ha⁻¹ and K deficits of 20-50 kg ha⁻¹, but data from the eastern districts, where farm size and input intensity are lower, remain sparse [7,8] . This research aimed to: (a) construct N, P, and K budgets across 60 rice-wheat farms in Ayodhya and Ambedkar Nagar districts, (b) link budget imbalances to changes in soil fertility over two years, and (c) recommend corrective fertiliser adjustments.
Baseline Soil Characterisation
Composite soil samples (0-20 cm) from all 60 fields were collected before the 2021 kharif rice season. Mean values: pH 7.8, EC 0.28 dS m⁻¹, organic carbon 0.47%, available N (alkaline KMnO₄) 214 kg ha⁻¹, available P (Olsen) 17.3 kg ha⁻¹, and available K (NH₄OAc) 162 kg ha⁻¹. Texture was silt loam to silty clay loam across the alluvial floodplain. According to the ICAR fertility rating, N was low, P medium, and K medium-but the K value was already near the lower boundary of the medium class (150 kg ha⁻¹), signalling vulnerability to depletion [3] .
Nutrient Budget Methodology
Inputs: fertiliser N, P₂O₅, and K₂O (from farmer records), farmyard manure (nutrient content analysed per farm), biological N fixation by rice-associated cyanobacteria (estimated at 15 kg N ha⁻¹ yr⁻¹ [9] ), and atmospheric deposition (5 kg N, 1 kg P, 3 kg K ha⁻¹ yr⁻¹ [6] ). Outputs: grain and straw nutrient removal (from plant-tissue analysis × yield), gaseous N losses (estimated at 25% of applied N for flooded rice [10] ), and leaching (10% of applied N; P and K leaching assumed negligible on this fine-textured soil). Budget = total inputstotal outputs. Apparent nutrient recovery (ANR) = (nutrient uptake in fertilised plot -uptake in zero-N control) / nutrient applied × 100 [5] .
Material and Methods
Material and Methods
Material
Sixty rice-wheat fields (0.
Comprehensive Interpretation
The N surplus of 34.7 kg ha⁻¹ yr⁻¹ contrasts sharply with the K deficit of -41.3 kg ha⁻¹ yr⁻¹. Soil available K fell by 18.4 mg kg⁻¹ in just two years, and this decline correlated strongly with the K budget deficit (r = 0.67, p < 0.01).
Apparent N recovery was only 38.2%, meaning over 60% of applied N was lost-mostly through ammonia volatilisation from surface-applied urea in flooded rice and denitrification [10] . The P budget was near-balanced, consistent with the stable soil-P values.
Discussion
The K depletion rate of ~9 kg K ha⁻¹ yr⁻¹ in soil-test terms is alarming because once available K drops below 125 kg ha⁻¹, rice and wheat yields decline sharply in alluvial soils [3,4] . At the current rate, the median field will cross that threshold within three years. The paradox is that farmers perceive no immediate yield response to K because the soil buffer masks the deficit-until it doesn't [7] . The low ANR for N (38.2%) is consistent with estimates from the western Indo-Gangetic Plains (35-45%) and reflects the chronic inefficiency of broadcast urea under flooded conditions [10,11] . Switching to neem-coated urea or deep placement could raise ANR to 50-55% and reduce the N surplus simultaneously [12] . A limitation is that gaseous and leaching losses were estimated rather than measured; installing micrometeorological equipment and suction lysimeters on a subset of farms would tighten the budget. The two-year window is also short for detecting slow changes in organic carbon [13] .
Conclusion
Intensive rice-wheat farming in eastern Uttar Pradesh runs a persistent nitrogen surplus (+34.7 kg ha⁻¹ yr⁻¹) alongside a potassium deficit (-41.
Figures and tables from the paper
| Component | N input | N output | P input | P output | K input | K output |
|---|---|---|---|---|---|---|
| Fertiliser | 187.4 | — | 48.3 | — | 23.7 | — |
| FYM/residue | 18.6 | — | 7.4 | — | 21.3 | — |
| BNF + deposition | 20.0 | — | 1.0 | — | 3.0 | — |
| Grain removal | — | 108.7 | — | 28.4 | — | 24.8 |
| Straw removal | — | 41.3 | — | 8.7 | — | 51.6 |
| Gaseous + leaching | — | 41.3 | — | — | — | — |
| Balance | +34.7 | +6.8 | −41.3 |
Table text extracted from the original PDF; superscript letters are shown inline. The original table image is below.
View original table image
| Parameter | Baseline (2021) | Post-harvest (2023) | Change | p-value | r with budget balance |
|---|---|---|---|---|---|
| Avail. N (kg ha⁻¹) | 214 | 221 | +7.0 | 0.034 | 0.41* |
| Avail. P (kg ha⁻¹) | 17.3 | 18.1 | +0.8 | 0.218 | 0.28 ns |
| Avail. K (kg ha⁻¹) | 162 | 143.6 | −18.4 | <0.001 | 0.67** |
| Organic C (%) | 0.47 | 0.46 | −0.01 | 0.387 | — |
Table text extracted from the original PDF; superscript letters are shown inline. The original table image is below.
View original table image
References
21 in the original paper- Tiwari KN. Potassium management in rice-wheat cropping system of the Indo-Gangetic Plains. Better Crops South Asia. 2011;5(1):6-9.
- Ladha JK, Dawe D, Pathak H, Padre AT, Yadav RL, Singh B, et al. How extensive are yield declines in long-term rice-wheat experiments in Asia? Field Crops Research. 2003;81(2-3):159-180.
- Sharma PK, Ladha JK, Bhandari AL. Soil physical effects of puddling in rice-wheat cropping systems. In: Ladha JK et al., editors. Improving the productivity of rice-wheat systems. Madison: ASA; 2003. p. 97-113.
- Bijay-Singh, Yadvinder-Singh, Sekhon GS. Fertilizer-N use efficiency and nitrate pollution of groundwater in developing countries. Journal of Contaminant Hydrology. 1995;20(3-4):167-184.
- Oenema O, Kros H, de Vries W. Approaches and uncertainties in nutrient budgets: implications for nutrient management and environmental policies. European Journal of Agronomy. 2003;20(1-2):3-16.
- Smaling EMA, Stoorvogel JJ, Windmeijer PN. Calculating soil nutrient balances in Africa at different scales. Fertilizer Research. 1993;35(3):227-235.
- Pathak H, Aggarwal PK, Roetter R, Kalra N, Bandyopadhyaya SK, Prasad S, et al. Modelling the quantitative evaluation of soil nutrient supply, nutrient use efficiency, and fertilizer requirements of wheat in India. Nutrient Cycling in Agroecosystems. 2003;65(2):105-113.
- Majumdar K, Johnston AM, Dutta S, Satyanarayana T, Roberts TL. Fertiliser best management practices: current scenario, improved sentiments, and role of nutrient expert. Indian Journal of Fertilisers. 2013;9(4):26-31.
- Roger PA, Ladha JK. Biological N₂ fixation in wetland rice fields: estimation and contribution to nitrogen balance. Plant and Soil. 1992;141(1):41-55.
- Pathak H, Nedwell DB, Rao GV, Raghuram N. Nitrous oxide emission from soil and water in rice and wheat ecosystems. Nutrient Cycling in Agroecosystems. 2004;69(1):37-45.
- Ladha JK, Pathak H, Krupnik TJ, Six J, van Kessel C. Efficiency of fertilizer nitrogen in cereal production: retrospects and prospects. Advances in Agronomy. 2005;87:85-156.
- Nkebiwe PM, Weinmann M, Bar-Tal A, Muller T. Fertilizer placement to improve crop nutrient acquisition and yield: a review and meta-analysis. Field Crops Research. 2016;196:389-401.
- Nambiar KKM, Ghosh AB. Highlights of research of a long-term fertilizer experiment in India (1971-82). LTFE Research Bulletin 1. New Delhi: ICAR; 1984.
- Dobermann A, Witt C, Dawe D, Abdulrachman S, Gines HC, Nagarajan R, et al. Site-specific nutrient management for intensive rice cropping systems in Asia. Field Crops Research. 2002;74(1):37-66.
- Regmi AP, Ladha JK, Pathak H, Pasuquin E, Bueno C, Dawe D, et al. Yield and soil fertility trends in a 20year rice-rice-wheat experiment in Nepal. Soil Science Society of America Journal. 2002;66(3):857-867.
- Shukla AK, Behera SK, Pakhre A, Chaudhari SK. Micronutrient deficiencies in Indian soils and their remediation. Indian Journal of Fertilisers. 2018;14(4):30-40.
- Singh VK, Dwivedi BS, Singh SK, Majumdar K, Jat ML, Mishra RP, et al. Soil physical properties, yield trends and economics after five years of conservation agriculture based rice-maize system in north-western India. Soil and Tillage Research. 2016;155:133-148.
- Tandon HLS. Methods of analysis of soils, plants, waters, fertilisers and organic manures. New Delhi: FDCO; 2005.
- Yadav RL, Dwivedi BS, Prasad K, Tomar OK, Shurpali NJ, Pandey PS. Yield trends, and changes in soil organic-C and available NPK in a long-term rice-wheat system under integrated use of manures and fertilisers. Field Crops Research. 2000;68(3):219-246.
- Dutta S, Majumdar K, Khurana HS, Sulewski G, Satyanarayana T, Johnston A. Mapping potassium budgets across districts of India. Better Crops South Asia. 2013;7(1):14-16.
- Singh B, Ryan J. Managing fertilizers to enhance soil health. Paris: International Fertilizer Industry Association; 2015.