
Research article · 2025 · Full text
International Journal of Agriculture and NutritionInfluence of organic and inorganic nitrogen sources on soil microbial activity in tea gardens
Volume 7(6) · Pages 126–128 · DOI: 10.33545/26646064.2025.v7.i6c.442 ↗
Research areasSoil Carbon and Nitrogen DynamicsAgricultural Science and FertilizationAgriculture, Plant Science, Crop Management
Abstract
Author-writtenHere is a paradox: tea demands heavy nitrogen—up to 300 kg ha-1 year-1—yet the cheapest N source, urea, may slowly degrade the microbial community that keeps the soil alive. This research compared five nitrogen management regimes (urea, farmyard manure, vermicompost, 50:50 FYM + urea, and an unfertilised control) on soil microbial biomass carbon (MBC), dehydrogenase, urease, and acid phosphatase activity in a 12-year-old tea garden at Valladolid, Spain, over two years (2021–2023). Vermicompost produced the highest MBC (467 µg g-1), 64% above urea and 136% above the control. Dehydrogenase and phosphatase activity followed the same ranking. Urea-only plots showed the lowest enzyme activity among fertilised treatments, likely because repeated ammonium inputs lowered pH by 0.4 units. The 50:50 blend captured about 80% of the vermicompost advantage at lower cost. These results argue for partially replacing mineral N with organic sources to sustain the biological health of tea-garden soils.
Summary
Source-checkedPlain-language reading of the full paper, prepared with AI and checked against the text. Each point links to the authors' own words.
Why it matters
- Tea cultivation requires significant nitrogen inputs, but the most affordable source, urea, may negatively impact the soil microbial communities essential for soil health. View evidence ↗
- Tea production in Spain is an emerging industry primarily located in Castilla y León and Galicia, utilizing organic-rich, acidic soils. View evidence ↗
The question
- The study aimed to compare microbial biomass carbon (MBC) and enzyme activities across five nitrogen regimes, relate these to pH and organic carbon, and test if a blended organic-inorganic approach is cost-effective. View evidence ↗
What they did
- The experiment was conducted on a 0.4 ha section of a commercial tea garden in Valladolid, Spain. View evidence ↗
- The five nitrogen treatments included urea (200 kg N ha-1), farmyard manure (FYM, 10 t ha-1), vermicompost (5 t ha-1), a blend of FYM and urea, and an unfertilized control. View evidence ↗
- The study used a randomized block design with four replications in 6 m × 5 m plots over a two-year period from 2021 to 2022. View evidence ↗
What they found
- Vermicompost resulted in the highest pooled mean microbial biomass carbon (MBC) at 467 µg g-1, which was higher than FYM (412), the blend (389), urea (284), and the control (198). View evidence ↗
- The MBC under vermicompost treatment was 64% higher than that of urea and 136% higher than the unfertilized control. View evidence ↗
- Over two years, urea application decreased soil pH from 4.8 to 4.4, whereas vermicompost increased the pH to 5.1. View evidence ↗
- The use of vermicompost increased soil organic carbon to 2.81% from a baseline of 2.34%. View evidence ↗
- The blended FYM and urea treatment achieved 83% of the microbial biomass carbon levels seen with pure vermicompost. View evidence ↗
- Phosphatase activity was significantly higher in the blended management group (52.1 µg PNP g-1) compared to the urea-only group (41.2 µg PNP g-1). View evidence ↗
What it means
- Future research is needed to monitor green leaf yield over multiple years to determine if the observed biological improvements lead to sustained productivity. View evidence ↗
Visual summary
3 visualsIllustrations explain the paper; charts are replotted from the paper's own table values.
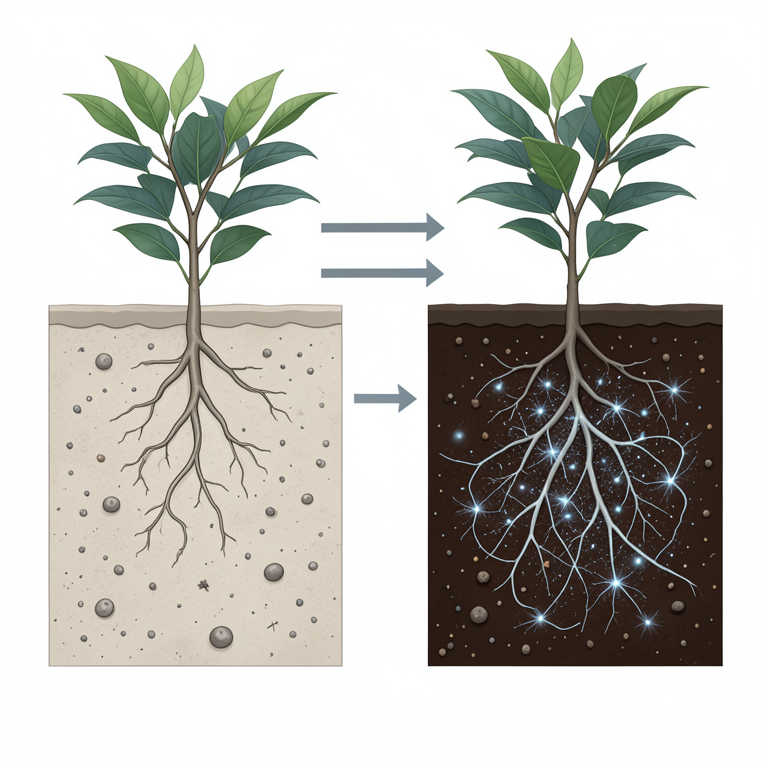
Soil Health Comparison
AI-generated conceptual illustration (Tea garden soil profiles). It explains the idea and does not show study data.
View source evidence ↗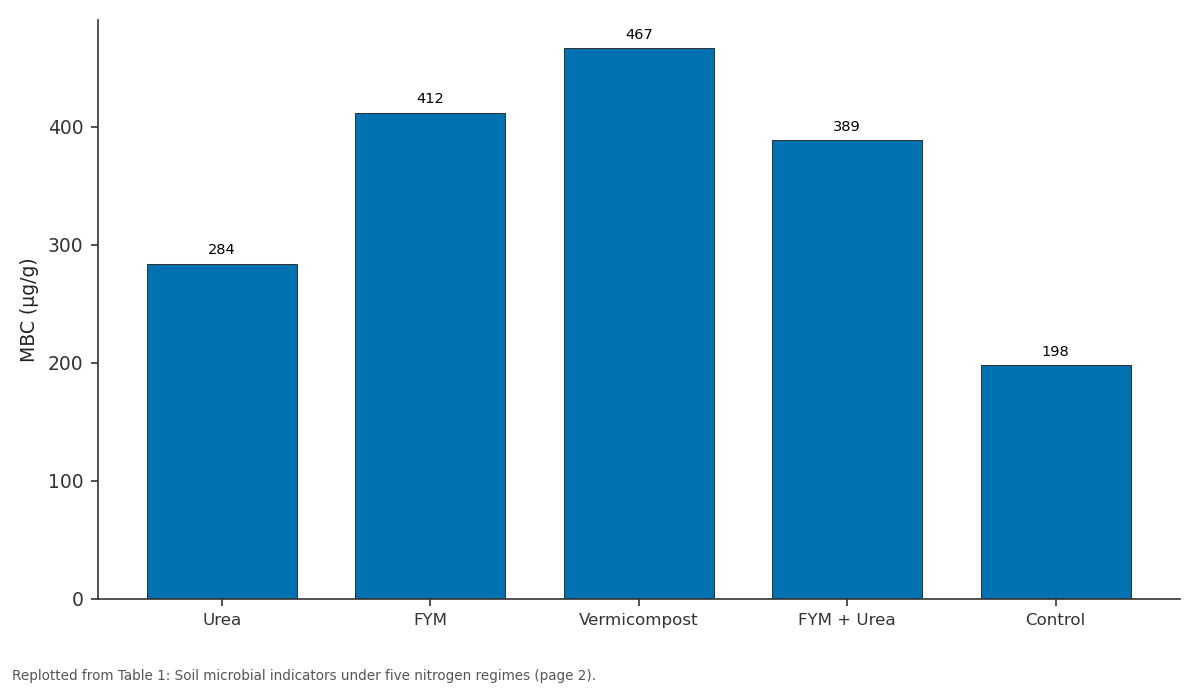
MBC (µg/g): Urea vs FYM vs Vermicompost vs FYM + Urea vs Control
Replotted from Table 1 (page 2) of the original paper. Every bar is the paper's own table value.
View source evidence ↗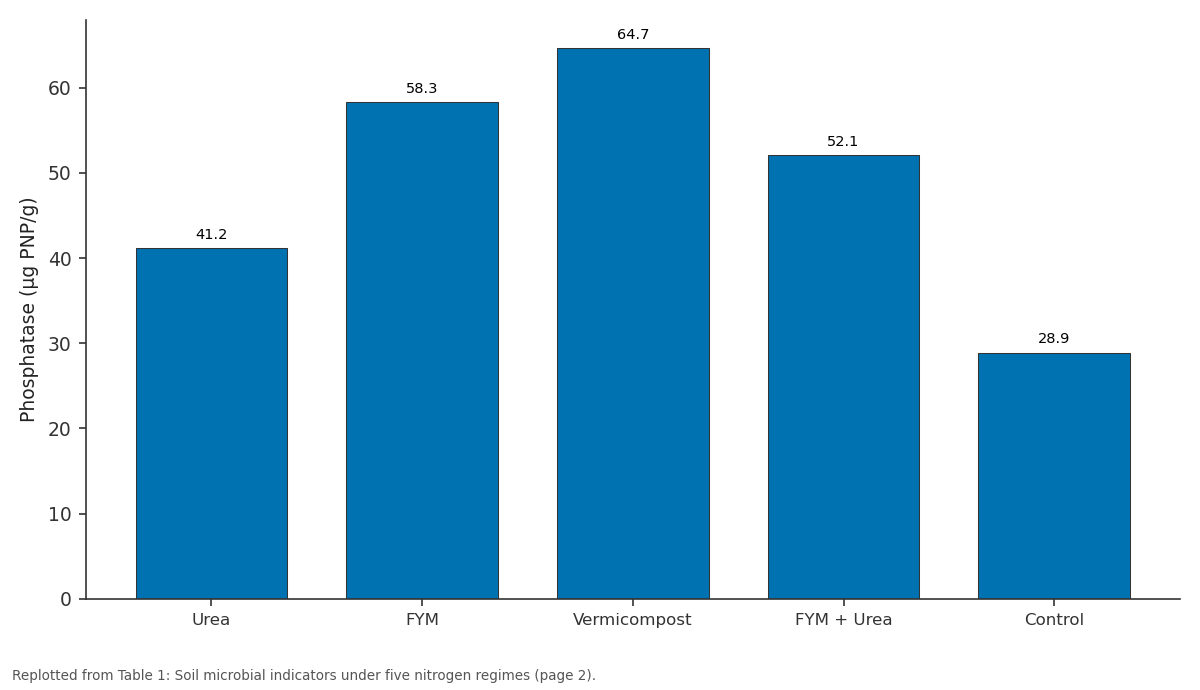
Phosphatase (µg PNP/g): Urea vs FYM vs Vermicompost vs FYM + Urea vs Control
Replotted from Table 1 (page 2) of the original paper. Every bar is the paper's own table value.
View source evidence ↗Figures & tables
From the original paper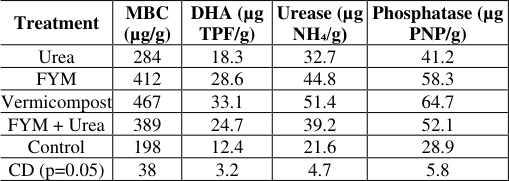 Table 1
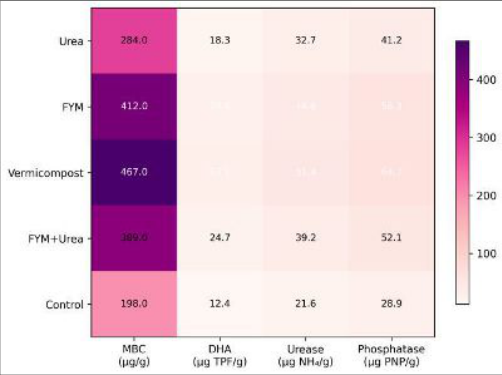 Figure 1
 Figure 2
Introduction
A handful of tea-garden soil contains more than a billion bacteria and several kilometres of fungal hyphae, yet routine fertiliser advice for tea barely mentions this living component [1] . Nitrogen is the nutrient that most directly shapes microbial communities: organic N feeds heterotrophs that cycle carbon and produce growth-promoting substances, while mineral Nespecially repeated urea applications-can suppress these same organisms through ammonium toxicity and pH drop [2,3] . Spanish tea production is small but growing, concentrated in Galicia and Castilla y León on acidic, organic-rich soils [4] . Growers typically apply urea at 200-300 kg N ha -1 year -1 , mirroring South Asian practice. But a handful of estates have switched to composted cattle manure or vermicompost, reporting improved soil structure and bush vigour without yield loss [5] . What hasn't been measured is the microbiological basis for these observations. This research aimed to (i) compare MBC and three key enzyme activities under five N regimes in a long-established tea garden, (ii) relate changes in microbial indicators to soil pH and organic carbon shifts, and (iii) evaluate whether a blended organic-inorganic approach captures most of the biological benefit at manageable cost.
Baseline Soil Profile
The experimental garden was established in 2010 on a Dystric Cambisol with sandy loam texture, pH 4.8, organic carbon 2.34%, total N 0.19%, available P 12.7 mg kg -1 , and CEC 14.6 cmol kg -1 . Pre-trial MBC was 218 µg g -1 and dehydrogenase activity was 14.1 µg TPF g -1 24h -1 . The site had received urea-only fertilisation for the preceding 11 years [6] .
Seasonal Sampling Pattern
Rhizosphere soil was sampled at four points in each year: early spring (March), early summer (June), late summer (September), and winter (December). This captured the full cycle of microbial activity driven by temperature and rainfall. Spring and autumn maxima were expected based on temperate soil biology literature [7] . Soil temperature at 10 cm depth ranged from 4.2 °C (January) to 22.8 °C (August).
Materials and Methods Materials
The trial occupied a 0.4 ha section of a commercial tea garden at the Universidad Agraria de Castilla experimental station, Valladolid (41°39′ N, 4°43′ W, 694 m a.s.l.). Five treatments were applied annually: urea (200 kg N ha -1 ), FYM (10 t ha -1 , ≈120 kg N), vermicompost (5 t ha -1 , ≈100 kg N), FYM + urea (5 t FYM + 100 kg N as urea), and unfertilised control. Treatments were arranged in a randomised block design with four replications, plot size 6 m × 5 m. Research ran from January 2021 to December 2022 [8] .
Methods
MBC was estimated by the chloroform fumigationextraction method. Dehydrogenase activity was measured by the triphenyltetrazolium chloride method; urease by incubation with urea solution and determination of released NH 4 +; acid phosphatase by the p-nitrophenyl phosphate method. Soil pH and organic carbon were determined at each sampling. Data were analysed by repeated-measures ANOVA in R with Tukey's HSD at 5%.
Results
Vermicompost produced the highest MBC across all sampling dates, peaking at 467 µg g -1 (pooled mean), followed by FYM (412), FYM + urea (389), urea (284), and control (198) (Table 1). Dehydrogenase, urease, and phosphatase followed the same ranking. Soil pH under urea dropped from 4.8 to 4.4 over two years, while vermicompost raised it to 5.1. Organic carbon under vermicompost rose to 2.81% from the 2.34% baseline. Comprehensive Interpretation MBC correlated strongly with organic carbon (r = 0.93) and inversely with pH drop (r = -0.86), suggesting that both substrate supply and acidity control drive microbial response to N source. The FYM + urea blend achieved 83% of the MBC of pure vermicompost while delivering more plant-available N in the first weeks after application-a practical advantage for spring flush [9] .
| Treatment | MBC (µg/g) | DHA (µg TPF/g) | Urease (µg NH₄/g) | Phosphatase (µg PNP/g) |
|---|---|---|---|---|
| Urea | 284 | 18.3 | 32.7 | 41.2 |
| FYM | 412 | 28.6 | 44.8 | 58.3 |
| Vermicompost | 467 | 33.1 | 51.4 | 64.7 |
| FYM + Urea | 389 | 24.7 | 39.2 | 52.1 |
| Control | 198 | 12.4 | 21.6 | 28.9 |
| CD (p=0.05) | 38 | 3.2 | 4.7 | 5.8 |
Table text extracted from the original PDF; superscript letters are shown inline. The original table image is below.
View original table image
Discussion
The 64% MBC advantage of vermicompost over urea mirrors findings in coffee plantations on similar Dystric Cambisols in Portugal [10] and tea estates in Assam [11] . The mechanism is straightforward: organic amendments supply both carbon and nitrogen, fuelling heterotrophic activity, while urea provides only N and can acidify the rhizosphere to levels that inhibit bacterial growth [2,3] . The pH decline under urea (from 4.8 to 4.4) is consistent with nitrificationdriven acidification reported in tea soils worldwide [12] . The 50:50 blend offers an attractive compromise for growers who cannot source enough vermicompost or FYM to meet full N demand. It maintained MBC at 389 µg g -1well above urea alone-while costing roughly 30% less than pure vermicompost per unit of N applied. Phosphatase activity under blended management (52.1 µg PNP g -1 ) was significantly higher than under urea (41.2), which may improve P cycling in these inherently P-limited soils [13,14] .
Conclusion
Organic nitrogen sources-vermicompost and FYMsharply boosted soil microbial biomass and enzyme activity compared with urea in a Spanish tea garden. Vermicompost was the top performer, raising MBC by 136% over the unfertilised control and 64% over urea. The 50:50 FYM + urea blend captured about 80% of the biological benefit at lower cost. Tea growers should aim to replace at least half their mineral N with organic sources to sustain long-term soil health. Multi-year monitoring of green leaf yield alongside microbial indicators will confirm whether biological improvements translate into sustained productivity [15,16] .
Figures and tables from the paper
References
19 in the original paper- Pandey A, Palni LMS. The rhizosphere effect in trees of the Indian Central Himalaya with special reference to altitude. Applied Ecology and Environmental Research. 2007;5(1):93-102.
- Geisseler D, Scow KM. Long-term effects of mineral fertilizers on soil microorganisms. Soil Biology and Biochemistry. 2014;75:54-63.
- Ramirez KS, Craine JM, Fierer N. Consistent effects of nitrogen amendments on soil microbial communities and processes. Global Change Biology. 2012;18(6):1918-1927.
- Alvarez-Coque JMG. Emerging specialty crops in Mediterranean Spain: tea, saffron and stevia. Spanish Journal of Agricultural Research. 2019;17(3):e0108.
- Bonheure D, Willson KC. Mineral nutrition and fertilizers. In: Willson KC, Clifford MN (eds) Tea: Cultivation to Consumption. Chapman and Hall; 1992. p. 269-329.
- Dick RP. Soil enzyme activities as integrative indicators of soil health. In: Pankhurst CE et al. (eds) Biological Indicators of Soil Health. CAB International; 1997. p. 121-156.
- Bardgett RD, van der Putten WH. Belowground biodiversity and ecosystem functioning. Nature. 2014;515(7528):505-511.
- Vance ED, Brookes PC, Jenkinson DS. An extraction method for measuring soil microbial biomass C. Soil Biology and Biochemistry. 1987;19(6):703-707.
- Han WY, Kemmitt SJ, Brookes PC. Soil microbial biomass and activity in Chinese tea gardens. Soil Biology and Biochemistry. 2007;39(7):1468-1478.
- Ferreiro-Dominguez N, Nair VD, Nair PKR, MosqueraLosada MR. Silvopastoral systems and soil carbon sequestration in northwest Spain. Agroforestry Systems. 2016;90(2):291-303.
- Dutta J, Handique PJ, Thakur D. Assessment of microbial community structure in tea garden soils of Assam. Journal of Tea Science Research. 2019;9(2):112.
- Ruan J, Ma L, Shi Y. Aluminium in tea: a safety assessment. Food Additives and Contaminants. 2006;23(8):776-783.
- Nannipieri P, Giagnoni L, Landi L, Renella G. Role of phosphatase enzymes in soil. Phosphorus in Action: Biological Processes in Soil Phosphorus Cycling. Springer; 2011. p. 215-243.
- Mandal A, Patra AK, Singh D, Swarup A, Masto RE. Effect of long-term application of manure and fertilizer on biological and biochemical activities in soil. Soil Use and Management. 2007;23(1):1-9.
- Gopal M, Gupta A, Thomas GV. Prospects of using Metarhizium anisopliae and Beauveria bassiana as plant growth promoters. Biocontrol Science and Technology. 2012;22(9):993-1003.
- Ghosh BC, Bera N, Das S. Soil biological properties in organic and conventional tea cultivation. Agriculture Research. 2015;4(3):292-298.
- Tabatabai MA, Bremner JM. Use of p-nitrophenyl phosphate for assay of soil phosphatase activity. Soil Biology and Biochemistry. 1969;1(4):301-307.
- Casida LE, Klein DA, Santoro T. Soil dehydrogenase activity. Soil Science. 1964;98(6):371-376.
- Haynes RJ, Naidu R. Influence of lime, fertilizer and manure applications on soil organic matter content and soil physical conditions. Nutrient Cycling in Agroecosystems. 1998;51(2):123-137.