
Research article · 2025 · Full text
International Journal of Agriculture and NutritionFarmer perceptions and adoption barriers for conservation agriculture in dryland systems
Volume 7(2) · Pages 79–82 · DOI: 10.33545/26646064.2025.v7.i2b.459 ↗
Research areasAgricultural Innovations and PracticesSoil Management and Crop YieldAgricultural Development and Management
Abstract
Author-writtenConservation Agriculture (CA) has been promoted as a pathway to sustainable dryland farming, yet adoption rates remain below 5% across most of semi-arid Russia. This research investigated farmer perceptions of CA and identified adoption barriers among 180 dryland farmers in Saratov Oblast using structured interviews and a Likert-based perception survey. CA adopters (n = 42) scored soil health (4.3/5) and economic benefit (4.1/5) significantly higher than non-adopters (2.8 and 2.3 respectively). The leading barriers were lack of knowledge (78.4% of non-adopters), unavailability of specialised seeding equipment (62.3%), and concerns about weed pressure without tillage (54.7%). Discriminant analysis correctly classified 84.2% of respondents into adopter/non-adopter groups based on six perception dimensions. Extension programmes that combine on-farm demonstrations with equipment-sharing cooperatives may accelerate CA uptake in Russian dryland systems.
Summary
Source-checkedPlain-language reading of the full paper, prepared with AI and checked against the text. Each point links to the authors' own words.
Why it matters
- Conservation Agriculture (CA) is seen as a way to make dryland farming sustainable, but it is adopted by fewer than 5% of farmers in most semi-arid regions of Russia. View evidence ↗
- CA is based on three principles: minimum soil disturbance, permanent organic soil cover, and crop rotation, which are intended to rebuild soil carbon, conserve moisture, and reduce erosion. View evidence ↗
- To understand why CA adoption is low, it is necessary to examine social, institutional, and economic factors rather than just the agronomic results. View evidence ↗
The question
- The study aimed to identify the barriers to adoption and investigate how 180 dryland farmers in Saratov Oblast perceive Conservation Agriculture. View evidence ↗
What they did
- The researchers used stratified random sampling based on farm size to select 180 dryland farmers from the Novouzensk, Ozinki, and Aleksandrov Gay districts of Saratov Oblast. View evidence ↗
- Between April and July 2023, farmers were surveyed using a tool with 36 Likert-scale items (1-5) covering six dimensions of perception and demographic data. View evidence ↗
- The study categorized 42 farmers as adopters (those using at least two CA principles for 3 or more years) and 138 as non-adopters (those using conventional tillage). View evidence ↗
- The analysis involved Mann-Whitney U tests for perception scores, a frequency-ranked checklist of 12 constraints for barriers, and discriminant analysis to group respondents. View evidence ↗
What they found
- Farmers who adopted CA rated soil health (4.3/5) and economic benefit (4.1/5) significantly higher than those who did not (2.8 and 2.3, respectively). View evidence ↗
- Adopters had more positive perceptions across almost all dimensions, but non-adopters scored input cost reduction higher, indicating a belief that CA requires expensive specialized equipment. View evidence ↗
- The primary barriers for non-adopters were a lack of knowledge (78.4%), unavailable specialized seeding equipment (62.3%), and worries about weed pressure (54.7%). View evidence ↗
- Discriminant analysis correctly classified 84.2% of respondents, suggesting that farmer perceptions are strong predictors of whether they will adopt CA. View evidence ↗
What it means
- The study is limited by its cross-sectional design, which cannot prove causation, potential self-selection bias among adopters, and a sample from Saratov that may not represent all Russian dryland regions. View evidence ↗
Visual summary
2 visualsIllustrations explain the paper; charts are replotted from the paper's own table values.
Barriers to CA Adoption
AI-generated conceptual illustration (dryland farmland). It explains the idea and does not show study data.
View source evidence ↗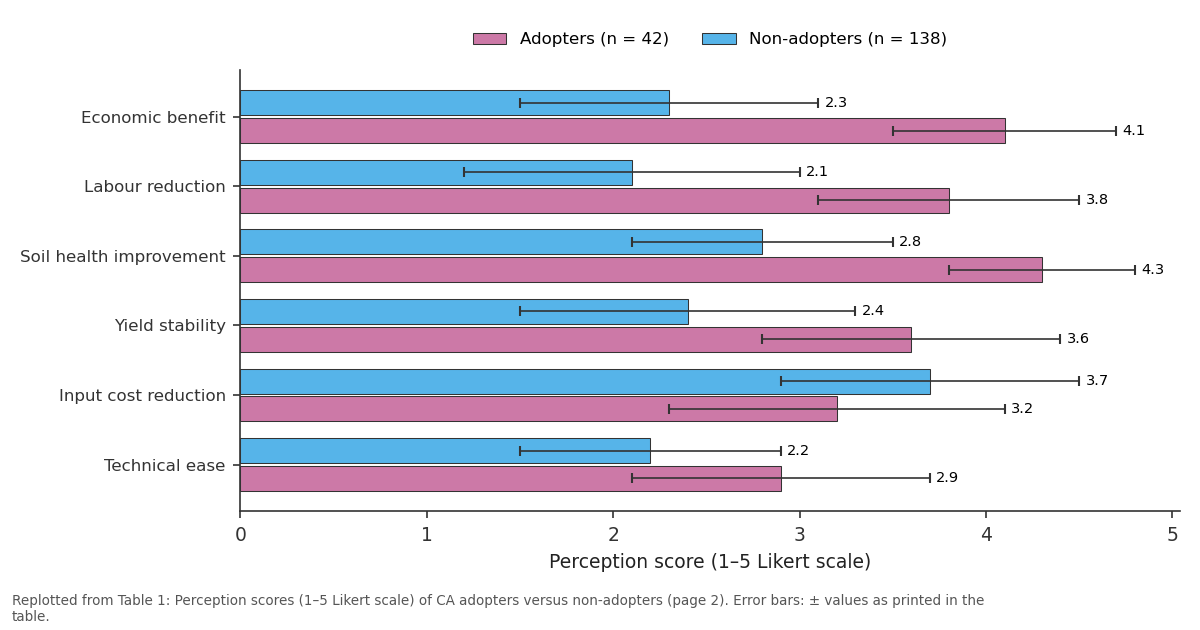
Adopters (n = 42) and Non-adopters (n = 138): Economic benefit vs Labour reduction vs Soil health improvement vs Yield stability vs Input cost reduction
Replotted from Table 1 (page 2) of the original paper. Every bar is the paper's own table value.
View source evidence ↗Figures & tables
From the original paper Table 1
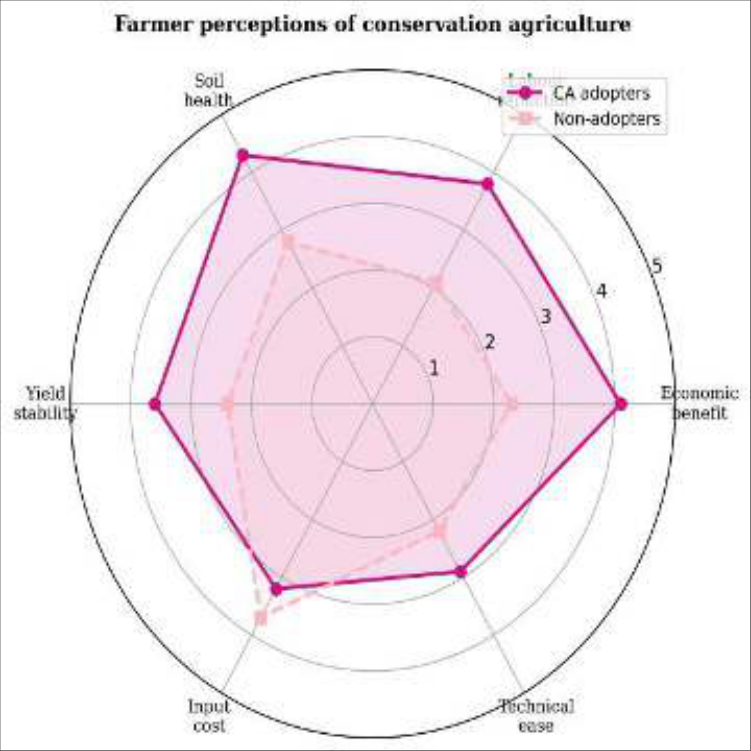 Figure 1
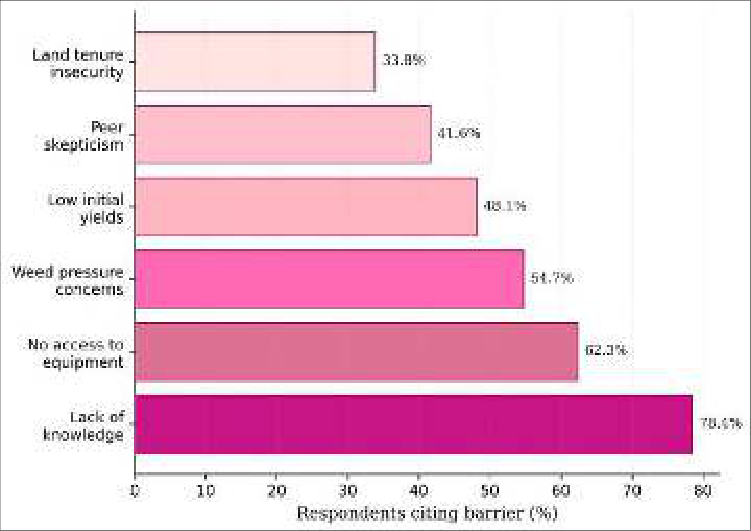 Figure 2
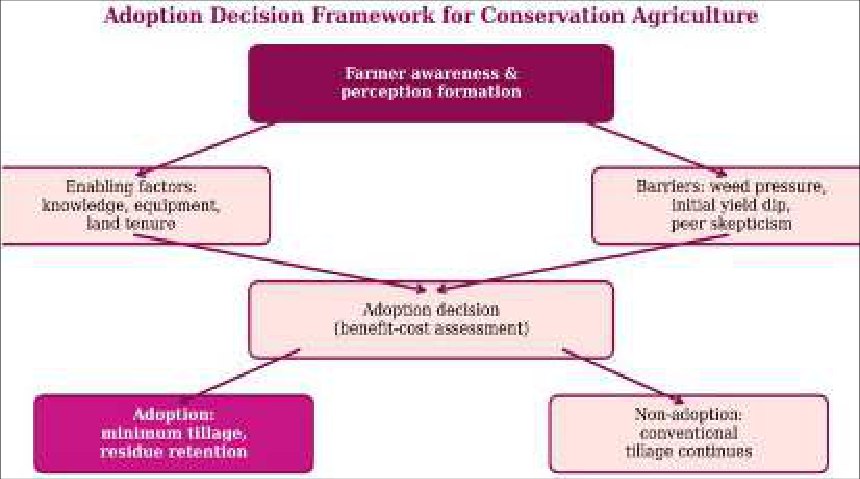 Figure 3
Introduction
When researchers at a demonstration plot in Saratov Oblast showed farmers that wheat could be sown directly into standing stubble without ploughing, the most common reaction was disbelief. "But the weeds will eat everything," one farmer objected [1]. That anecdote captures the core challenge facing Conservation Agriculture (CA) adoption in Russia's drylands: the science may support it, but farmer beliefs often don't. CA rests on three linked principles minimum soil disturbance, permanent organic soil cover, and crop rotation [2]. On paper, these practices reduce erosion, conserve moisture, and rebuild soil carbon [3].
Yet globally, CA covers only about 180 million hectares, concentrated in the Americas and Australia, while adoption in the former Soviet Union remains negligible [4]. Understanding why requires looking beyond agronomic performance to the social, economic, and institutional factors that shape farmer decision-making [5]. This research used a structured survey to quantify perceptions and identify barriers among dryland farmers in Saratov Oblast, one of Russia's main wheat-producing regions [6]. Theoretical framework The research drew on Rogers' (2003) Diffusion of Innovations theory, which identifies five innovation attributes influencing adoption: relative advantage, compatibility, complexity, trialability, and observability [7].
Perception variables were mapped onto these attributes. The Technology Acceptance Model was also considered, where perceived usefulness and perceived ease of use drive adoption intention [5].
Material And Methods
Material A total of 180 dryland farmers in three districts of Saratov Oblast (Novouzensk, Ozinki, Aleksandrov Gay) were selected by stratified random sampling based on farm size. The survey instrument contained 36 Likert items (1-5 scale) across six perception dimensions plus demographic variables. Fieldwork was conducted between April and July 2023. Ethical clearance was obtained from the Volga Institute Research Ethics Board [8].
IJAN 2025; 7(2): 79-82 Maxim Belyakov Department of Organic Farming, Volga Institute of Agricultural Sciences, Saratov, Russia Zoya Karpov Department of Organic Farming, Volga Institute of Agricultural Sciences, Saratov, Russia Maxim Belyakov Department of Organic Farming, Volga Institute of Agricultural Sciences, Saratov, Russia https://www.agriculturejournal.net
Methods
Face-to-face interviews were conducted in Russian by trained enumerators. Adopters were defined as farmers practising at least two of three CA principles for ≥3 years (n = 42); non-adopters practised conventional tillage (n = 138). Perception scores were compared using Mann-Whitney U tests. Adoption barriers were assessed through a checklist of 12 pre-identified constraints ranked by frequency.
Discriminant analysis classified respondents into adopter/non-adopter groups. Cronbach's alpha for the perception instrument was 0.87. Data were analysed in SPSS 28 [7, 8].
Results
Table 1: Perception scores (1–5 Likert scale) of CA adopters versus non-adopters Perception dimension Adopters (n = 42) Non-adopters (n = 138) p-value Economic benefit 4.1 ± 0.6 2.3 ± 0.8 < 0.001 Labour reduction 3.8 ± 0.7 2.1 ± 0.9 < 0.001 Soil health improvement 4.3 ± 0.5 2.8 ± 0.7 < 0.001 Yield stability 3.6 ± 0.8 2.4 ± 0.9 < 0.01 Input cost reduction 3.2 ± 0.9 3.7 ± 0.8 0.02 Technical ease 2.9 ± 0.8 2.2 ± 0.7 < 0.01 Adopters scored significantly higher on all dimensions except input cost, where non-adopters scored higher reflecting the perception that CA requires expensive specialised equipment (Table 1). Fig 1: Radar chart of farmer perception scores across six dimensions for CA adopters and non-adopters https://www.agriculturejournal.net Fig 2: Adoption barriers cited by non-adopters, ranked by frequency Fig 3: Adoption decision framework for conservation agriculture in dryland systems
| Perception dimension | Adopters (n = 42) | Non-adopters (n = 138) | p-value |
|---|---|---|---|
| Economic benefit | 4.1 ± 0.6 | 2.3 ± 0.8 | < 0.001 |
| Labour reduction | 3.8 ± 0.7 | 2.1 ± 0.9 | < 0.001 |
| Soil health improvement | 4.3 ± 0.5 | 2.8 ± 0.7 | < 0.001 |
| Yield stability | 3.6 ± 0.8 | 2.4 ± 0.9 | < 0.01 |
| Input cost reduction | 3.2 ± 0.9 | 3.7 ± 0.8 | 0.02 |
| Technical ease | 2.9 ± 0.8 | 2.2 ± 0.7 | < 0.01 |
Table text extracted from the original PDF; superscript letters are shown inline. The original table image is below.
View original table image
Discussion
The knowledge gap as the top barrier (78.4%) echoes findings from sub-Saharan Africa and South Asia [2, 5]. Russian extension services were largely dismantled after the Soviet era and have only partially recovered, leaving many farmers without access to technical advice on alternative practices [6]. The equipment barrier is specific to the Russian context, where no-till seeders are imported and expensive; promoting equipment-sharing cooperatives could address this [4]. The fact that non-adopters scored input cost higher than adopters suggests a perception bias: those who haven't tried CA overestimate its costs.
On-farm demonstrations showing actual input savings could correct this misconception [7]. The discriminant analysis correctly classifying 84.2% of respondents indicates that perceptions are strong predictors of adoption behaviour, supporting targeted extension messaging. Limitations The cross-sectional design captures associations but not causation. Self-selection bias is likely adopters may have inherently more favourable attitudes.
The Saratov sample may not represent other Russian dryland regions with different institutional contexts.
Conclusion
Farmer perceptions of CA's benefits differed dramatically between adopters and non-adopters, with knowledge deficit, equipment access, and weed concerns as the main barriers. Extension strategies should prioritise on-farm demonstrations, equipment cooperatives, and integrated https://www.agriculturejournal.net 18. Wall PC. Tailoring conservation agriculture to the needs of small farmers in developing countries.
Journal of Crop Improvement. 2007;19(1-2):137-155. weed management training to accelerate adoption in Russian drylands.
References
17 in the original paper- Derpsch R, Friedrich T, Kassam A, Li H. Current status of adoption of no-till farming in the world and some of its main benefits. International Journal of Agricultural and Biological Engineering. 2010;3(1):1-25.
- Kassam A, Friedrich T, Derpsch R. Global spread of conservation agriculture. International Journal of Environmental Studies. 2019;76(1):29-51.
- Lal R. Soil carbon sequestration impacts on global climate change and food security. Science. 2004;304(5677):1623-1627.
- Suleimenov M, Oram P. Trends in feed, livestock production, and rangelands during the post-Soviet era in Central Asia. In: Eliazarov P (ed.). Post-Soviet Agriculture. Springer, Berlin. 2000; p.149-176.
- Knowler D, Bradshaw B. Farmers' adoption of conservation agriculture: a review and synthesis of recent research. Food Policy. 2007;32(1):25-48.
- Uzun V, Shagaida N, Lerman Z. Russian agriculture: growth and institutional challenges. Land Use Policy. 2019;83:475-487.
- Rogers EM. Diffusion of Innovations. Fifth edition. Free Press, New York. 2003.
- Likert R. A technique for the measurement of attitudes. Archives of Psychology. 1932;22(140):1-55.
- Erenstein O, Sayre K, Wall P, Hellin J, Dixon J. Conservation agriculture in maize- and wheat-based systems in the (sub)tropics. Field Crops Research. 2012;132:78-93.
- Pannell DJ, Llewellyn RS, Corbeels M. The farm-level economics of conservation agriculture for resource-poor farmers. Agriculture Ecosystems and Environment. 2014;187:52-64.
- Friedrich T, Derpsch R, Kassam A. Overview of the global spread of conservation agriculture. Field Actions Science Reports. 2012;Special Issue 6.
- Hobbs PR, Sayre K, Gupta R. The role of conservation agriculture in sustainable agriculture. Philosophical Transactions of the Royal Society B. 2008;363(1491):543-555.
- Giller KE, Witter E, Corbeels M, Tittonell P. Conservation agriculture and smallholder farming in Africa: the heretics' view. Field Crops Research. 2009;114(1):23-34.
- Corbeels M, de Graaff J, Ndah TH, Penot E, Baudron F, et al. Understanding the impact and adoption of conservation agriculture in Africa. Agriculture Ecosystems and Environment. 2014;187:155-170.
- Mazvimavi K, Twomlow S. Socioeconomic and institutional factors influencing adoption of conservation farming by vulnerable households in Zimbabwe. Agricultural Systems. 2009;101(1-2):20-29.
- Thierfelder C, Wall PC. Effects of conservation agriculture techniques on infiltration and soil water content in Zambia and Zimbabwe. Soil and Tillage Research. 2009;105(2):217-227.
- Lahmar R. Adoption of conservation agriculture in Europe: lessons of the KASSA project. Land Use Policy. 2010;27(1):4-10.