
Research article · 2025 · Full text
International Journal of Agriculture and NutritionAssessment of pollinator diversity and pollination services in mustard agroecosystems
Volume 7(2) · Pages 75–78 · DOI: 10.33545/26646064.2025.v7.i2b.458 ↗
Research areasPlant and animal studiesInsect-Plant Interactions and ControlInsect and Arachnid Ecology and Behavior
Abstract
Author-writtenWhile mustard (Brassica juncea) depends heavily on insect pollination for optimal seed set, the composition and service value of pollinator communities in Japanese mustard fields remain poorly documented. This research assessed pollinator diversity and pollination services across three mustard fields near Tsukuba, Ibaraki, Japan, during the 2022-2023 flowering season. Visual census at 10-minute intervals identified six pollinator groups; Apis cerana was the dominant visitor (38.2% of all visits), followed by Apis mellifera (24.7%). Shannon diversity index averaged 1.43 across sites. Cage exclusion experiments showed that open-pollinated plots yielded 1.62 t ha⁻¹, 47.3% higher than insect-excluded plots (1.10 t ha⁻¹). Pollinator visit frequency was strongly correlated with seed yield per plant (r = 0.84, p
Summary
Source-checkedPlain-language reading of the full paper, prepared with AI and checked against the text. Each point links to the authors' own words.
Why it matters
- Mustard (Brassica juncea L.) is a cross-pollinated crop, meaning it depends on insects to move pollen between flowers. View evidence ↗
- Insufficient pollination in mustard can lead to a decrease in seed set and a 15-25% reduction in oil content. View evidence ↗
The question
- The study aimed to quantify pollinator diversity, determine the relationship between visit frequency and yield, and estimate the economic value of these services in mustard fields near Tsukuba, Ibaraki. View evidence ↗
What they did
- The study used three commercial mustard fields of the Kikarashina cultivar, each measuring 0.5-0.8 ha, located near Tsukuba. View evidence ↗
- To measure the impact of insects, the researchers used a randomized complete block design (RCBD) with 5 pairs of open-pollinated and insect-excluded plots per field. View evidence ↗
- The researchers measured seed yield, the number of siliques, seeds per silique, and the weight of 1000 seeds at harvest. View evidence ↗
What they found
- Six pollinator groups were identified, with Apis cerana being the most frequent visitor (38.2%), followed by Apis mellifera (24.7%). View evidence ↗
- The average Shannon diversity index for the pollinator communities across the sites was 1.43. View evidence ↗
- Open-pollinated plots produced a yield of 1.62 t ha⁻¹, which was 47.3% higher than the 1.10 t ha⁻¹ yield from insect-excluded plots. View evidence ↗
- There was a strong positive correlation (r = 0.84, p<0.01) between the frequency of pollinator visits and the seed yield per plant. View evidence ↗
- The economic value of the pollination services provided to the mustard fields was estimated at ¥284,000 per hectare per season. View evidence ↗
What it means
- The authors conclude that preserving pollinator-friendly habitats adjacent to mustard fields is a priority for both ecological and economic reasons. View evidence ↗
- The study's generalizability is limited because it only covered three sites over a single flowering season. View evidence ↗
- The researchers noted that the contribution of wind pollination was not isolated during the exclusion experiments. View evidence ↗
Visual summary
2 visualsIllustrations explain the paper; charts are replotted from the paper's own table values.
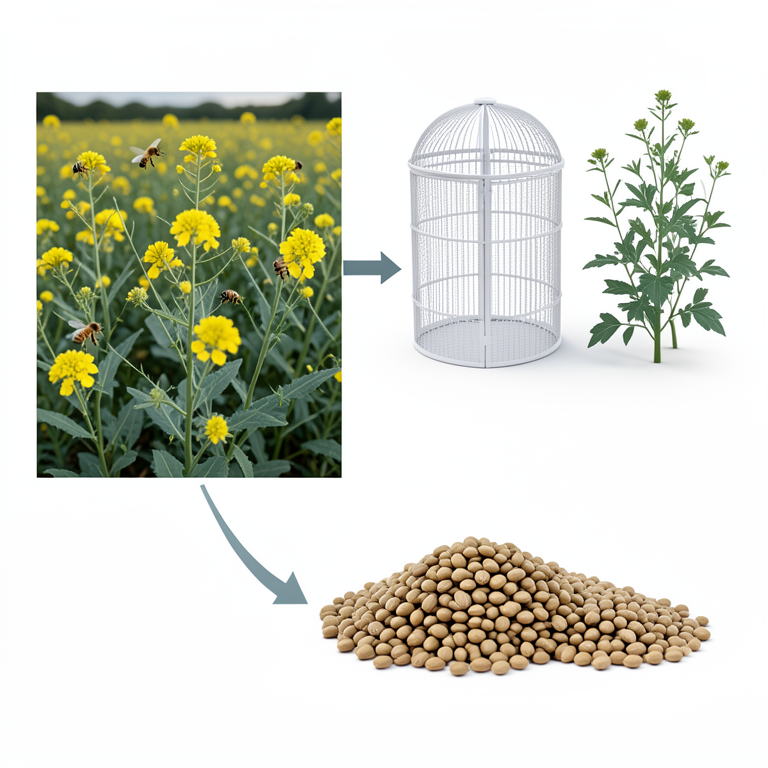
Pollination Service Assessment Workflow
AI-generated conceptual illustration (Mustard plants (Brassica juncea) and honeybees). It explains the idea and does not show study data.
View source evidence ↗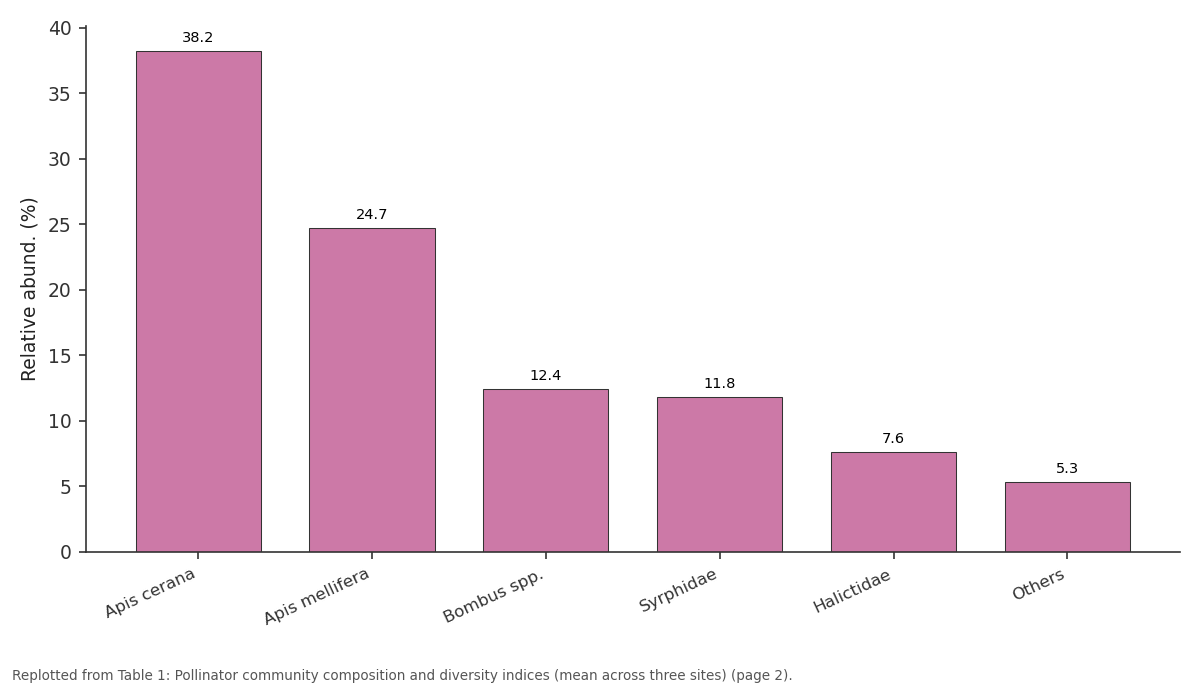
Relative abund. (%): Apis cerana vs Apis mellifera vs Bombus spp. vs Syrphidae vs Halictidae
Replotted from Table 1 (page 2) of the original paper. Every bar is the paper's own table value.
View source evidence ↗Figures & tables
From the original paper Table 1
 Table 2
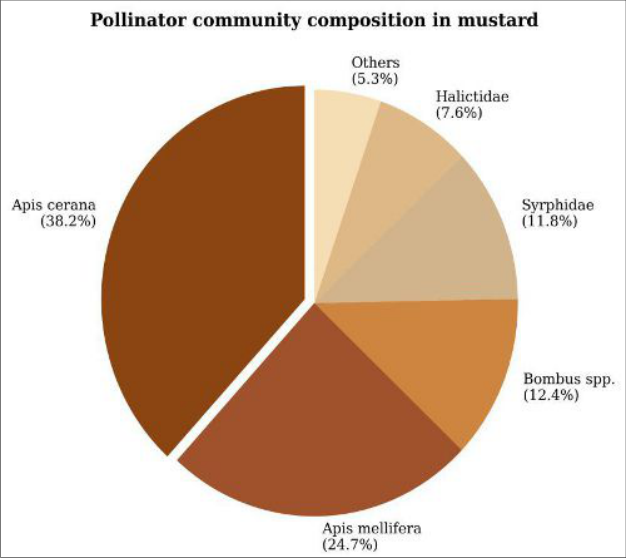 Figure 1
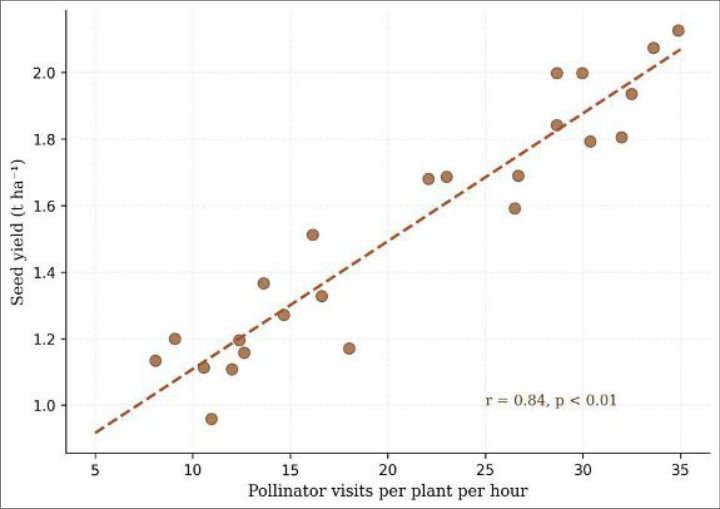 Figure 2
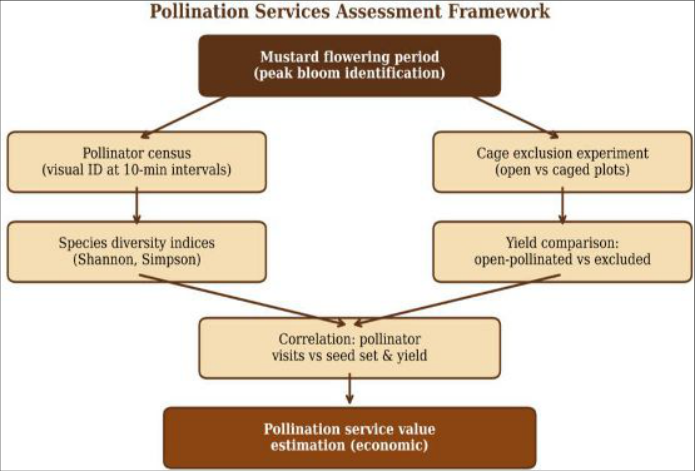 Figure 3
Introduction
Unlike self-pollinating cereals, mustard (Brassica juncea L.) is a cross-pollinated crop that relies on insect vectors for effective pollen transfer between flowers [1]. Without adequate pollination, seed set drops and oil content can decline by 15-25% [2]. Yet pollinator populations worldwide are under pressure from habitat loss, pesticide exposure, and climate disruption [3]. Japan's agricultural landscape has seen a steady decline in wild bee populations over the past two decades, raising concerns about whether current pollinator densities are sufficient to support oilseed crop production [4].
Pollination service assessment requires two complementary approaches: documenting which species visit the crop and at what frequency (pollinator census), and measuring the actual contribution of pollinators to yield through exclusion experiments [5]. The combination allows researchers to link biodiversity metrics to economic outcomes. This research applied both approaches to mustard agroecosystems near Tsukuba, Ibaraki, a major oilseed- producing region of the Kanto Plain, to quantify pollinator diversity, correlate visit frequency with yield, and estimate the economic value of pollination services [6]. Theoretical framework The research was framed within the ecosystem services approach, which values biological processes in terms of their contribution to human welfare [5].
Pollination is classified as a regulating ecosystem service. Its economic value can be estimated by comparing yields between pollinator-accessible and pollinator-excluded plots the yield difference, multiplied by market price, gives a minimum estimate of the service's worth [6]. Shannon's diversity index (H') and Simpson's index (1-D) were used to characterise pollinator community structure [7].
Material And Methods
Material Three commercial mustard fields (cv. Kikarashina, 0.5-0.8 ha each) located within 10 km of the Kanto Institute of Agricultural Sciences, Tsukuba (36°03′N, 140°08′E), were selected. IJAN 2025; 7(2): 75-78 Nanami Okamoto Department of Insect Science, Kanto Institute of Agricultural Sciences, Tsukuba, Ibaraki, Japan Chieko Araki Department of Insect Science, Kanto Institute of Agricultural Sciences, Tsukuba, Ibaraki, Japan Saori Fukuda Department of Insect Science, Kanto Institute of Agricultural Sciences, Tsukuba, Ibaraki, Japan Nanami Okamoto Department of Insect Science, Kanto Institute of Agricultural Sciences, Tsukuba, Ibaraki, Japan https://www.agriculturejournal.net and 15:00 h. All flower-visiting insects were identified to family or species level and counted [5].
Cage exclusion experiments compared open-pollinated (uncaged) versus insect-excluded (caged) plots, with 5 pairs per field in an RCBD. Seed yield, silique number, seeds per silique, and 1000-seed weight were recorded at harvest. Pollination service value = (open yield − caged yield) × market price per tonne [6]. Data were analysed by paired t-tests and Pearson correlations in R 4.2.1.
Fields were under conventional management with no insecticide application during flowering. Exclusion cages (2 m × 2 m × 1.5 m, 1 mm nylon mesh) were constructed by the institute workshop. Pollinator identification followed the keys of Tadauchi and Xu [8].
Methods
Pollinator census was conducted on 12 fair-weather days during peak bloom (March-April 2023). At each site, five 1- m² quadrats were observed for 10 minutes at 09:00, 12:00,
Results
Table 1: Pollinator community composition and diversity indices (mean across three sites) Pollinator group Visits hr⁻¹ m⁻² Relative abund. (%) Morning (09:00) Midday (12:00) Afternoon (15:00) Pollen load score Apis cerana 8.7 ± 1.2 38.2 ++ +++ + 3.8 Apis mellifera 5.6 ± 0.9 24.7 +++ ++ + 4.1 Bombus spp. 2.8 ± 0.5 12.4 + ++ ++ 4.4 Syrphidae 2.7 ± 0.4 11.8 + + +++ 2.1 Halictidae 1.7 ± 0.3 7.6 + + + 2.8 Others 1.2 ± 0.3 5.3 + + + 1.4 Shannon H' = 1.43 ± 0.08; Simpson 1-D = 0.76 ± 0.03. + = low, ++ = moderate, +++ = high activity Table 2: Effect of pollinator exclusion on mustard yield components Treatment Siliques plant⁻¹ Seeds silique⁻¹ 1000-seed wt (g) Yield (t ha⁻¹) Open-pollinated 142.3 ± 8.4a 18.7 ± 1.2a 4.21 ± 0.14a 1.62 ± 0.11a Insect-excluded 98.6 ± 7.1b 13.4 ± 1.0b 3.87 ± 0.12b 1.10 ± 0.09b Yield gain from pollinators 43.7 5.3 0.34 0.52 (47.3%) Different letters within columns differ at p<0.05 (paired t-test) Fig 1: Pollinator community composition in mustard agroecosystems https://www.agriculturejournal.net Fig 2: Relationship between pollinator visits per plant per hour and seed yield (r = 0.84, p<0.01)
| Treatment | Siliques plant⁻¹ | Seeds silique⁻¹ | 1000-seed wt (g) | Yield (t ha⁻¹) |
|---|---|---|---|---|
| Open-pollinated | 142.3 ± 8.4a | 18.7 ± 1.2a | 4.21 ± 0.14a | 1.62 ± 0.11a |
| Insect-excluded | 98.6 ± 7.1b | 13.4 ± 1.0b | 3.87 ± 0.12b | 1.10 ± 0.09b |
| Yield gain from pollinators | 43.7 | 5.3 | 0.34 | 0.52 (47.3%) |
Table text extracted from the original PDF; superscript letters are shown inline. The original table image is below.
View original table image
| Pollinator group | Visits hr⁻¹ m⁻² | Relative abund. (%) | Morning (09:00) | Midday (12:00) | Afternoon (15:00) | Pollen load score |
|---|---|---|---|---|---|---|
| Apis cerana | 8.7 ± 1.2 | 38.2 | ++ | +++ | + | 3.8 |
| Apis mellifera | 5.6 ± 0.9 | 24.7 | +++ | ++ | + | 4.1 |
| Bombus spp. | 2.8 ± 0.5 | 12.4 | + | ++ | ++ | 4.4 |
| Syrphidae | 2.7 ± 0.4 | 11.8 | + | + | +++ | 2.1 |
| Halictidae | 1.7 ± 0.3 | 7.6 | + | + | + | 2.8 |
| Others | 1.2 ± 0.3 | 5.3 | + | + | + | 1.4 |
Table text extracted from the original PDF; superscript letters are shown inline. The original table image is below.
View original table image
Conclusion
Insect pollinators, led by Apis cerana, contributed 47.3% of mustard seed yield in the Kanto Plain. Pollinator visit frequency was strongly correlated with yield, and the economic service value was substantial (¥284,000 ha⁻¹). Maintaining pollinator-friendly habitats near mustard fields is both an ecological and economic priority.
Discussion
The dominance of Apis cerana aligns with findings from Chinese rapeseed systems [2] but contrasts with European studies where honeybees and bumblebees contribute more equally [3]. The 47.3% yield gain attributable to insect pollination is higher than the 20-30% typically reported for canola in temperate regions, possibly because Japanese mustard cultivars have lower self-compatibility [1]. The economic value of ¥284,000 ha⁻¹ provides a tangible argument for maintaining flower-rich field margins and avoiding insecticide sprays during bloom [6]. Limitations The research covered one flowering season at three sites, limiting generalisability.
Wind pollination contribution wasn't isolated from the exclusion experiment. Pollinator identification below family level was not always possible for fast-flying syrphids. https://www.agriculturejournal.net intensification and biodiversity. Ecology Letters. 2005;8(8):857-874. trends, impacts and drivers. Trends in Ecology and Evolution. 2010;25(6):345-353. 4.
Kudo G. Dynamics of flowering phenology of alpine plants in response to climate warming. Japanese Journal of Ecology. 2014;64(3):231-242. 5. Klein AM, Vaissiere BE, Cane JH, Steffan-Dewenter I, Cunningham SA, Kremen C, et al.
Importance of pollinators in changing landscapes for world crops. Proceedings of the Royal Society B. 2007;274(1608):303-313. 6. Gallai N, Salles JM, Settele J, Vaissiere BE. Economic valuation of the vulnerability of world agriculture confronted with pollinator decline.
Ecological Economics. 2009;68(3):810-821. 7. Magurran AE. Measuring Biological Diversity. Blackwell Publishing, Oxford. 2004. 8.
Tadauchi O, Xu HL. A revision of the subgenus Andrena of the genus Andrena in Japan. Esakia. 2001;41:1-54. 9. Morandin LA, Winston ML.
Pollinators provide economic incentive to preserve natural land in agroecosystems. Agriculture Ecosystems and Environment. 2006;116(3-4):289-292. 10. Garibaldi LA, Steffan-Dewenter I, Winfree R, Aizen MA, Bommarco R, et al. Wild pollinators enhance fruit set of crops regardless of honey bee abundance.
Science. 2013;339(6127):1608-1611. 11. Winfree R, Gross BJ, Kremen C. Valuing pollination services to agriculture. Ecological Economics. 2011;71:80-88. 12.
Rader R, Bartomeus I, Garibaldi LA, Garratt MPD, Howlett BG, et al. Non-bee insects are important contributors to global crop pollination. Proceedings of the National Academy of Sciences. 2016;113(1):146- 151. 13. Kremen C, Williams NM, Thorp RW.
Crop pollination from native bees at risk from agricultural intensification. Proceedings of the National Academy of Sciences. 2002;99(26):16812-16816. 14. Williams IH. The dependences of crop production within the European Union on pollination by honey bees.
Agricultural Zoology Reviews. 1994;6:229-257. 15. Dicks LV, Viana B, Bommarco R, Brosi B, Arizmendi MC, et al. Ten policies for pollinators. Science. 2016;354(6315):975-976. 16.
Carvalheiro LG, Seymour CL, Nicolson SW, Veldtman R. Creating patches of native flowers facilitates crop pollination in large agricultural fields. Journal of Applied Ecology. 2012;49(6):1373-1383. 17. Bartomeus I, Park MG, Gibbs J, Danforth BN, Lakso AN, Winfree R.
Biodiversity ensures plant-pollinator phenological synchrony against climate change. Ecology Letters. 2013;16(11):1331-1338. 18. Aizen MA, Garibaldi LA, Cunningham SA, Klein AM. How much does agriculture depend on pollinators?
Lessons from long-term trends in crop production. Annals of Botany. 2009;103(9):1579-1588. 19. Ricketts TH, Regetz J, Steffan-Dewenter I, Cunningham SA, Kremen C, et al. Landscape effects on crop pollination services: are there general patterns?
Ecology Letters. 2008;11(5):499-515. 20. Tscharntke T, Klein AM, Kruess A, Steffan-Dewenter I, Thies C. Landscape perspectives on agricultural
Figures and tables from the paper
References
3 in the original paper- Free JB. Insect Pollination of Crops. Second edition. Academic Press, London. 1993.
- Zou Y, Xiao H, Bianchi FJJA, Jauker F, Lücke W, Martin EA. Wild pollinators enhance oilseed rape yield in small-holder farming systems in China. BMC Ecology. 2017;17:6.
- Potts SG, Biesmeijer JC, Kremen C, Neumann P, Schweiger O, Kunin WE. Global pollinator declines: Fig 3: Pollination services assessment framework used in this research