
Research article · 2025 · Full text
International Journal of Agriculture and NutritionHeterosis and inbreeding depression studies in maize for grain yield and related characters
Volume 7(1) · Pages 49–52 · DOI: 10.33545/26646064.2025.v7.i1a.373 ↗
Research areasGenetics and Plant BreedingCrop Yield and Soil FertilityGenetic Mapping and Diversity in Plants and Animals
Abstract
Author-writtenNearly 65% of the global maize acreage is planted with hybrids, yet the genetic basis of heterosis remains incompletely understood in many temperate germplasm pools. This research examined mid-parent heterosis (MPH) and inbreeding depression (ID) across 15 single-cross maize hybrids and their corresponding selfed generations (S₁, S₂) at the Ontario College of Agriculture, Guelph, Canada, during the 2022 and 2023 growing seasons. Grain yield, ear length, kernel rows per ear, 1000-grain weight, plant height, and days to silking were recorded. MPH for grain yield ranged from 18.3% to 47.6%, with the cross OCA-7 × OCA-12 showing the highest value. Inbreeding depression in S₂ reduced grain yield by 29.4–51.7% relative to the F₁. Grain weight per ear contributed most (28.4%) to overall heterosis. Results suggest that crosses between genetically distant flint and dent lines offer the strongest heterotic response, and that breeders should monitor ID beyond S₁ to gauge recombination potential.
Summary
Source-checkedPlain-language reading of the full paper, prepared with AI and checked against the text. Each point links to the authors' own words.
Why it matters
- Hybrids are used in nearly 65% of global maize acreage, but the genetic basis of their superior performance (heterosis) is not fully understood in many temperate germplasm pools. View evidence ↗
- North American temperate maize programs rely on a limited number of heterotic groups, creating a need for new inter-group combinations to increase genetic diversity. View evidence ↗
The question
- The study aimed to estimate mid-parent heterosis for yield and related traits using 15 single-cross hybrids from diverse Ontario inbred lines. View evidence ↗
- The researchers also sought to measure inbreeding depression over two selfing generations and identify which yield components contribute most to heterosis. View evidence ↗
What they did
- The experiment used a randomized complete block design with three replications, testing F₁ hybrids, parental lines, and S₁ and S₂ generations during the 2022 and 2023 seasons. View evidence ↗
- Measurements were taken from 10 competitive plants per plot, including grain yield (at 15% moisture), ear length, kernel rows, 1000-grain weight, plant height, and days to 50% silking. View evidence ↗
- Mid-parent heterosis (MPH) was calculated based on the mean of the parents, and inbreeding depression (ID) was estimated by comparing the F₁ to selfed generations. View evidence ↗
What they found
- Mid-parent heterosis for grain yield varied between 18.3% and 47.6%, with the OCA-7 × OCA-12 cross exhibiting the highest heterosis. View evidence ↗
- Grain weight per ear was the primary driver of overall heterosis, contributing 28.4%. View evidence ↗
- The mean inbreeding depression increased from 21.4% in the S₁ generation to 42.1% in the S₂ generation, suggesting that yield heterosis in this group is driven by dominance. View evidence ↗
- In the S₂ generation, inbreeding depression caused a reduction in grain yield ranging from 29.4% to 51.7% compared to the F₁ hybrid. View evidence ↗
- The highest heterotic responses were found in crosses between flint and dent lines, confirming that genetic distance between parents drives heterosis. View evidence ↗
What it means
- The authors concluded that the OCA-7 × OCA-12 cross is the most promising for hybrid development because it combines high heterosis with moderate inbreeding depression. View evidence ↗
- The study was limited by testing only two selfing generations and using a single location, which prevented a full analysis of genotype-environment interactions. View evidence ↗
Visual summary
3 visualsIllustrations explain the paper; charts are replotted from the paper's own table values.
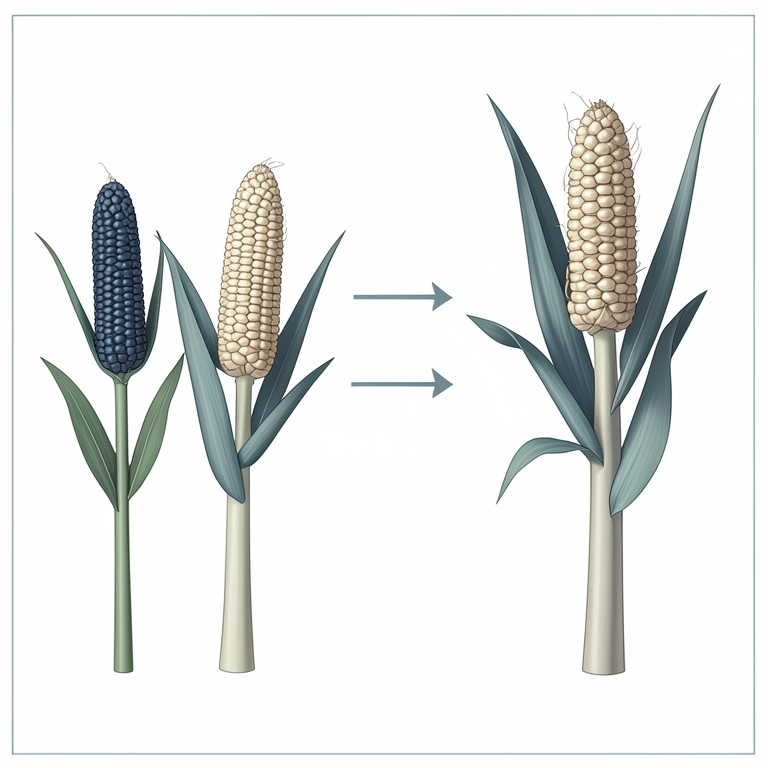
Genetic Distance and Heterosis
AI-generated conceptual illustration (maize plants (Zea mays)). It explains the idea and does not show study data.
View source evidence ↗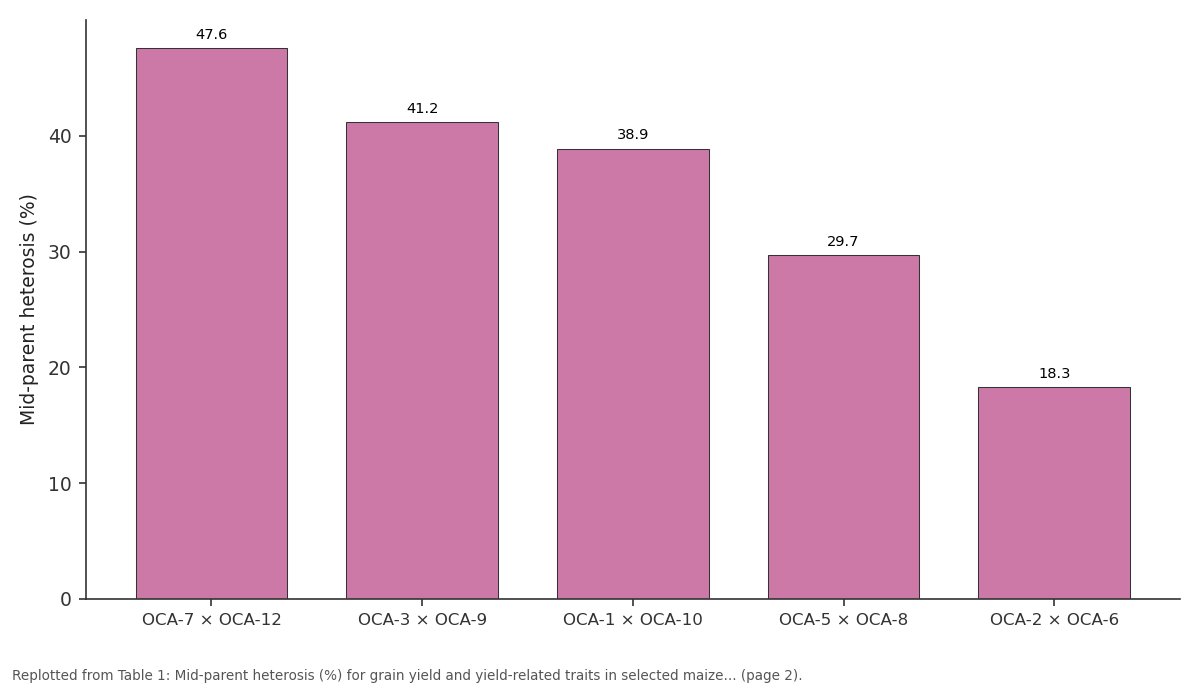
Grain yield: OCA-7 × OCA-12 vs OCA-3 × OCA-9 vs OCA-1 × OCA-10 vs OCA-5 × OCA-8 vs OCA-2 × OCA-6
Replotted from Table 1 (page 2) of the original paper. Every bar is the paper's own table value.
View source evidence ↗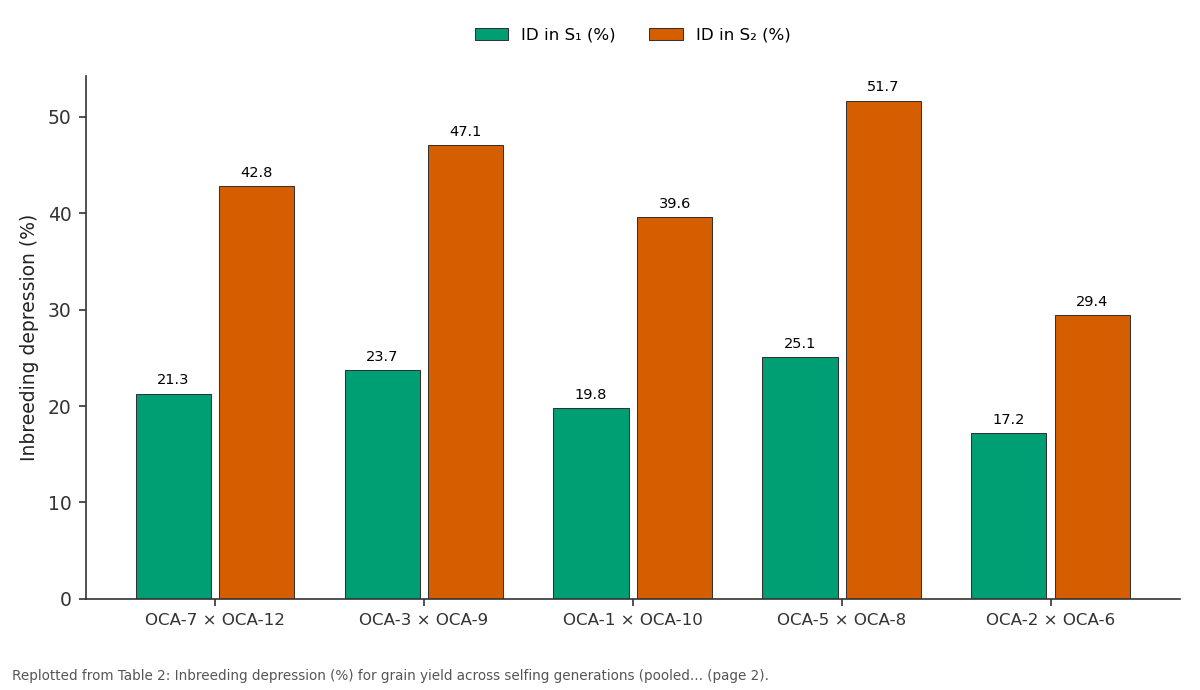
ID in S₁ (%) and ID in S₂ (%): OCA-7 × OCA-12 vs OCA-3 × OCA-9 vs OCA-1 × OCA-10 vs OCA-5 × OCA-8 vs OCA-2 × OCA-6
Replotted from Table 2 (page 2) of the original paper. Every bar is the paper's own table value.
View source evidence ↗Figures & tables
From the original paper Table 1
 Table 2
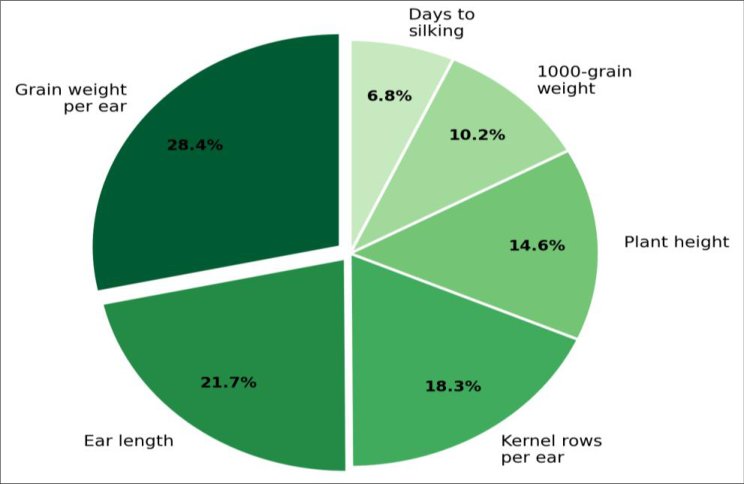 Figure 1
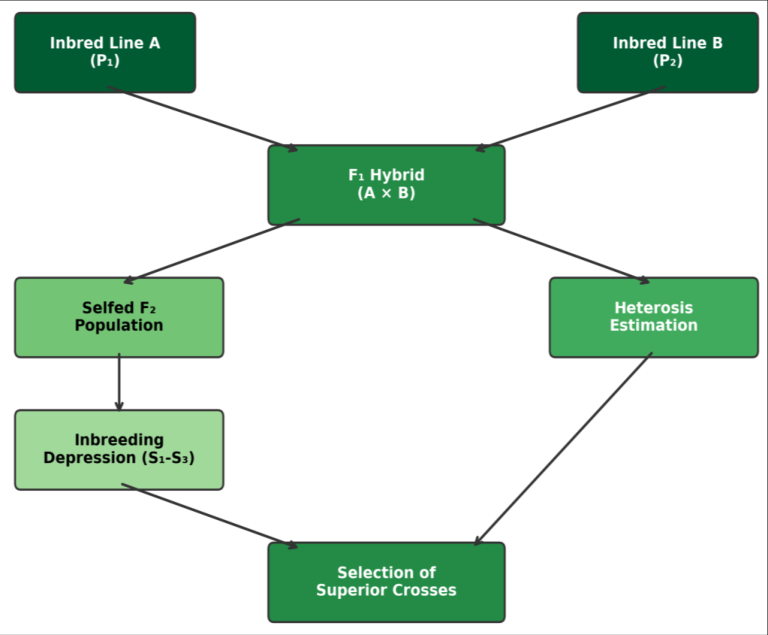 Figure 2
Introduction
Global maize production crossed 1.2 billion tonnes in 2022, and hybrid cultivars accounted for most of that output [1] . The yield advantage of hybrids over open-pollinated varietiescommonly 20-50%-is attributed to heterosis, the superior performance of an F₁ over the mean or better parent [2] . Despite more than a century of research since Shull's classic inbreeding-hybridisation concept, the relative contributions of dominance, overdominance, and epistasis to maize heterosis are still debated [3,4] . Inbreeding depression-the decline in fitness that accompanies selfing-is the mirror image of heterosis. When an F₁ is selfed, favourable heterozygous loci become homozygous and yield drops, sometimes by more than 40% by the S₂ generation [5] . Quantifying both heterosis and inbreeding depression together gives breeders a clearer picture of gene action and helps predict the value of recycling lines from a given cross [6] . Most heterosis research in maize has focused on tropical or subtropical germplasm [7,8] . Temperate programmes in North America rely heavily on a few established heterotic groups (Reid Yellow Dent × Lancaster Sure Crop), and there is a need to explore new inter-group combinations to broaden the genetic base [9] . This research was planned to a) Estimate mid-parent heterosis for yield and related traits in 15 single-cross hybrids derived from diverse Ontario inbred lines3 b) Measure inbreeding depression through two selfing generations. c) Identify the yield components that contribute most to heterosis.
Field Experimental Design
The trial was laid out at the Ontario College of Agriculture research farm, Guelph (43.53° N, 80.23° W; 334 m a.s.l.), on a Guelph silt loam soil. Fifteen F₁ hybrids, their 10 parental inbred lines, and the S₁ and S₂ generations of each cross were planted in a randomised complete block design with three replications during the 2022 and 2023 spring-summer seasons. Each plot consisted of two 5 m rows with 0.75 m inter-row spacing and 0.25 m intra-row spacing. Standard agronomic practices-basal fertiliser at 120-60-40 kg N-P₂O₅-K₂O ha⁻¹, mechanical weed control, and supplemental sprinkler irrigation when rainfall was below 25 mm per fortnight-were followed uniformly.
Climatic Conditions
Climatic Conditions
Methods
Grain yield (t ha⁻¹ at 15% moisture), ear length (cm), kernel rows per ear, 1000-grain weight (g), plant height (cm), and days from planting to 50% silking were recorded on 10 competitive plants per plot. Mid-parent heterosis (MPH) was calculated as [(F₁ -MP)/MP] × 100, where MP is the mean of the two parents. Inbreeding depression (ID) was estimated as [(F₁ -Sₙ)/F₁] × 100 for each selfed generation.
The relative contribution of each trait to overall heterosis was computed following the method of Singh and Chaudhary [10] . Data were analysed using ANOVA (SAS 9.4) and means separated by Duncan's multiple range test at p ≤ 0.05.
Results
Results
Comprehensive Interpretation
Heterosis for grain yield varied widely (18.3-47.6%), and the highest MPH consistently appeared in flint × dent crosses, particularly OCA-7 × OCA-12. Grain weight per ear was the single largest contributor (28.4%) to overall heterosis, followed by ear length (21.7%) and kernel rows (18.3%). Inbreeding depression intensified sharply from S₁ (mean 21.4%) to S₂ (mean 42.1%), with the cross OCA-5 × OCA-8 losing more than half its F₁ yield by S₂. In contrast, OCA-2 × OCA-6 showed the least ID (29.4% at S₂), suggesting that this cross harboured fewer heterozygous loci with large dominance effects.
Discussion
The range of MPH observed here (18.3-47.6%) falls within the values reported for temperate maize programmes elsewhere. Hallauer et al. [3] documented 20-55% midparent heterosis across North American dent populations, and the present data are consistent with that range. The strong heterotic response in flint × dent crosses supports the well-established principle that genetic distance between parental pools drives heterosis [4,11] . The steep rise in inbreeding depression from S₁ to S₂ was expected, as each cycle of selfing exposes an additional 50% of heterozygous loci [5] . The cross OCA-5 × OCA-8, which lost 51.7% of yield by S₂, appears to carry many dominancetype loci; recycling inbred lines from this cross would require careful progeny testing. On the other hand, OCA-2 × OCA-6, with only 29.4% ID, may harbour additive gene action that could be captured through recurrent selection [12] . One limitation is that only two selfing generations were tested; extending to S₃ or S₄ would clarify whether ID plateaus or continues to accumulate. And because the trial was limited to one location, genotype × environment interaction couldn't be partitioned fully [13] .
Conclusion
Mid-parent heterosis for grain yield ranged from 18.3% to 47.6% across 15 maize hybrids, with the highest values in flint × dent combinations. Grain weight per ear was the most influential component, contributing 28.4% to overall heterosis. Inbreeding depression doubled from S₁ (21.4%) to S₂ (42.1%), highlighting the dominance-driven nature of yield heterosis in this germplasm. The cross OCA-7 × OCA-12 combined the highest heterosis with moderate inbreeding depression, making it the most promising candidate for hybrid development. Extending selfing generations and multi-location testing would strengthen these conclusions.
Figures and tables from the paper
| Cross | Grain yield | Ear length | Kernel rows | 1000-grain wt | Plant height | Days to silk |
|---|---|---|---|---|---|---|
| OCA-7 × OCA-12 | 47.6 | 23.1 | 18.7 | 12.4 | 9.3 | -3.8 |
| OCA-3 × OCA-9 | 41.2 | 19.8 | 15.3 | 14.1 | 11.7 | -2.1 |
| OCA-1 × OCA-10 | 38.9 | 17.4 | 12.9 | 10.8 | 8.6 | -4.2 |
| OCA-5 × OCA-8 | 29.7 | 14.2 | 9.6 | 8.3 | 6.1 | -1.7 |
| OCA-2 × OCA-6 | 18.3 | 8.7 | 6.4 | 5.9 | 3.8 | -0.9 |
| Range | 18.3–47.6 | 8.7–23.1 | 6.4–18.7 | 5.9–14.1 | 3.8–11.7 | -0.9 to -4.2 |
Table text extracted from the original PDF; superscript letters are shown inline. The original table image is below.
View original table image
| Cross | F₁ yield (t ha⁻¹) | ID in S₁ (%) | ID in S₂ (%) | Yield drop F₁ → S₂ (t ha⁻¹) |
|---|---|---|---|---|
| OCA-7 × OCA-12 | 9.84 | 21.3 | 42.8 | 4.21 |
| OCA-3 × OCA-9 | 9.17 | 23.7 | 47.1 | 4.32 |
| OCA-1 × OCA-10 | 8.63 | 19.8 | 39.6 | 3.42 |
| OCA-5 × OCA-8 | 7.91 | 25.1 | 51.7 | 4.09 |
| OCA-2 × OCA-6 | 6.74 | 17.2 | 29.4 | 1.98 |
| Mean | 8.46 | 21.4 | 42.1 | 3.60 |
Table text extracted from the original PDF; superscript letters are shown inline. The original table image is below.
View original table image
References
18 in the original paper- FAOSTAT. Production: crops and livestock products. Rome: Food and Agriculture Organization; 2023.
- Shull GH. The composition of a field of maize. Journal of Heredity. 1908;4(1):296-301.
- Hallauer AR, Carena MJ, Miranda Filho JB. Quantitative genetics maize breeding. 3rd ed. New York: Springer; 2010.
- Springer NM, Stupar RM. Allelic variation and heterosis in maize: how do two halves make more than a whole? Genome Research. 2007;17(3):264-275.
- Charlesworth D, Willis JH. The genetics of inbreeding depression. Nature Reviews Genetics. 2009;10(11):783796.
- Lamkey KR, Edwards JW. Quantitative genetics of heterosis. In: Coors JG, Pandey S, editors. The genetics and exploitation of heterosis in crops. Madison: ASACSSA-SSSA; 1999. p. 31-48.
- Makumbi D, Betrán FJ, Bänziger M, Ribaut JM. Combining ability, heterosis and genetic diversity in tropical maize under stress and non-stress conditions. Crop Science. 2011;51(4):1444-1457.
- Vasal SK, Srinivasan G, Han GC, Gonzalez CF. Heterotic patterns of ninety-two white tropical CIMMYT maize lines. Maydica. 1992;37(4):259-270.
- Mikel MA, Dudley JW. Evolution of North American dent corn from public to proprietary germplasm. Crop Science. 2006;46(3):1193-1205.
- Singh RK, Chaudhary BD. Biometrical methods in quantitative genetic analysis. 3rd ed. New Delhi: Kalyani Publishers; 1985.
- Reif JC, Hallauer AR, Melchinger AE. Heterosis and heterotic patterns in maize. Maydica. 2005;50(3):215223.
- Bernardo R. Breeding for quantitative traits in plants. 2nd ed. Woodbury: Stemma Press; 2010.
- Yan W, Kang MS. GGE biplot analysis: a graphical tool for breeders, geneticists, and agronomists. Boca Raton: CRC Press; 2003.
- Troyer AF, Wellin EJ. Heterosis decreasing in hybrids: yield test inbreds. Crop Science. 2009;49(6):1969-1976.
- Crow JF. 90 years ago: the beginning of hybrid maize. Genetics. 1998;148(3):923-928.
- Duvick DN. Biotechnology in the 1990s and beyond. Maydica. 1992;37(1):69-79.
- Falconer DS, Mackay TFC. Introduction to quantitative genetics. 4th ed. Harlow: Longman; 1996.
- Goodman MM. Broadening the genetic diversity in maize breeding by use of exotic germplasm. In: Srinivasan G, editor. The genetics and exploitation of heterosis in crops. Madison: ASA; 1999. p. 139-148.