
Research article · 2025 · Full text
International Journal of Agriculture and NutritionImpact of biochar application on soil physical properties and nutrient availability in sandy loam soils
Volume 7(2) · Pages 154–156 · DOI: 10.33545/26646064.2025.v7.i2c.472 ↗
Research areasSoil Carbon and Nitrogen DynamicsAgricultural Science and FertilizationSoil Management and Crop Yield
Abstract
Author-writtenA farmer in Punjab once described his sandy loam field as "a sieve that lets water and fertiliser run straight through." This research evaluated biochar application at four rates (5-20 t ha⁻¹) on soil physical properties and nutrient availability in sandy loam at KVAU Ludhiana and NDUAT Kumarganj over 2021-2023. Biochar at 20 t ha⁻¹ increased soil organic carbon by 112%, WHC by 22.7%, CEC by 18.6%, and available N by 34.6% while reducing bulk density by 8.4%. Effects were dose-dependent and consistent across sites.
Summary
Source-checkedPlain-language reading of the full paper, prepared with AI and checked against the text. Each point links to the authors' own words.
Why it matters
- Sandy loam soils in the Indo-Gangetic Plains suffer from poor water and nutrient retention due to low organic carbon levels. View evidence ↗
- Biochar can improve soil because its porous structure enhances water retention and its cation exchange sites prevent nutrient leaching. View evidence ↗
The question
- The study aimed to quantify how different doses of rice-husk biochar affect soil properties at two sandy loam sites in Punjab and Uttar Pradesh. View evidence ↗
What they did
- The biochar used in the study was produced from rice husks via slow pyrolysis at 450°C for 2 hours. View evidence ↗
- Biochar particles smaller than 2 mm were incorporated into the top 15 cm of soil prior to the 2021 kharif rice season. View evidence ↗
- The researchers measured bulk density, porosity, water holding capacity (WHC), organic carbon (OC), cation exchange capacity (CEC), and available nitrogen (N) and phosphorus (P). View evidence ↗
What they found
- Applying biochar at 20 t ha⁻¹ led to significant improvements: organic carbon increased by 112%, water holding capacity by 22.7%, CEC by 18.6%, and available nitrogen by 34.6%, while bulk density decreased by 8.4%. View evidence ↗
- All measured soil properties showed a dose-dependent improvement as the amount of biochar increased. View evidence ↗
- The improvement in soil properties was mostly linear for application rates between 5 and 15 t ha⁻¹, but returns diminished at rates above 15 t ha⁻¹. View evidence ↗
What it means
- The authors conclude that biochar rates of 10-20 t ha⁻¹ improve all measured soil properties, with 15 t ha⁻¹ being the most cost-effective rate. View evidence ↗
- Rice-husk biochar is recommended as a locally available and cost-effective solution for improving degraded sandy loam soils. View evidence ↗
Visual summary
2 visualsIllustrations explain the paper; charts are replotted from the paper's own table values.
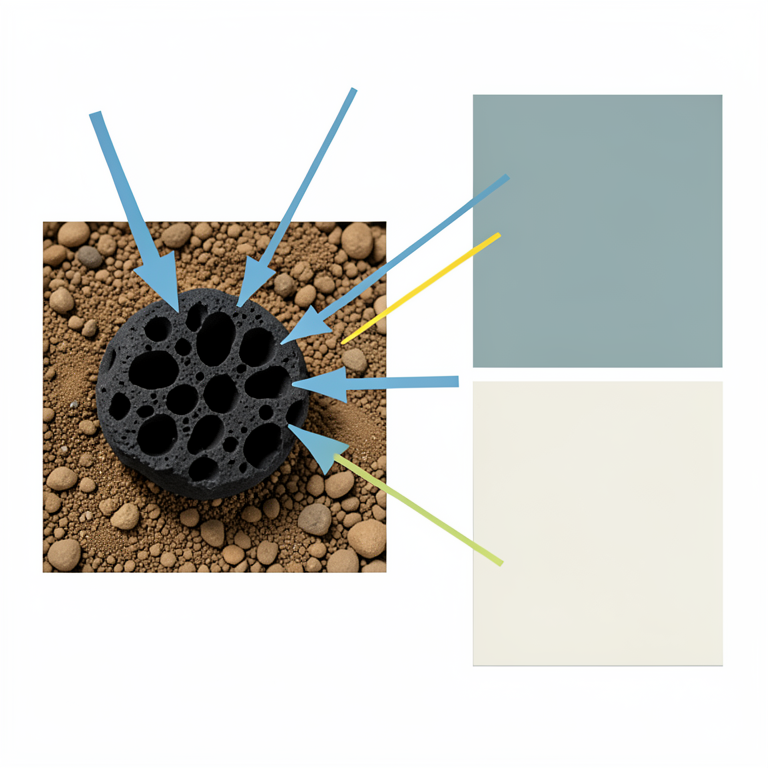
Biochar Soil Mechanism
AI-generated conceptual illustration (sandy loam soil with biochar particles). It explains the idea and does not show study data.
View source evidence ↗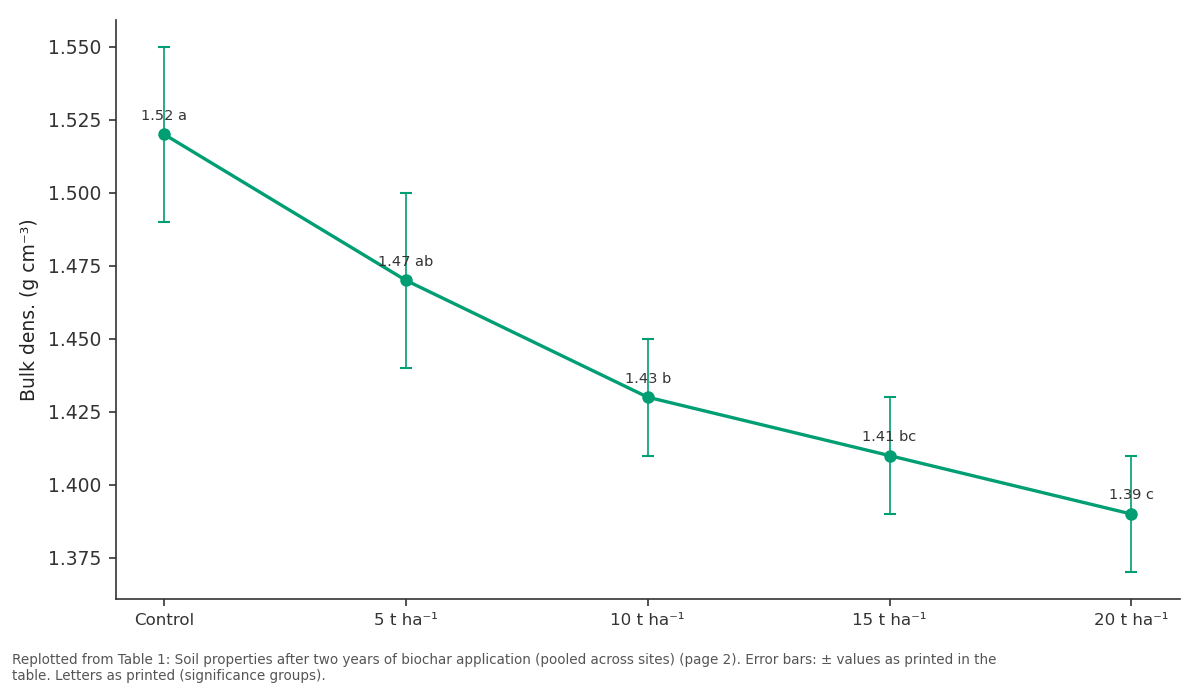
Bulk dens. (g cm⁻³): Control vs 5 t ha⁻¹ vs 10 t ha⁻¹ vs 15 t ha⁻¹ vs 20 t ha⁻¹
Replotted from Table 1 (page 2) of the original paper. Every bar is the paper's own table value.
View source evidence ↗Figures & tables
From the original paper Table 1
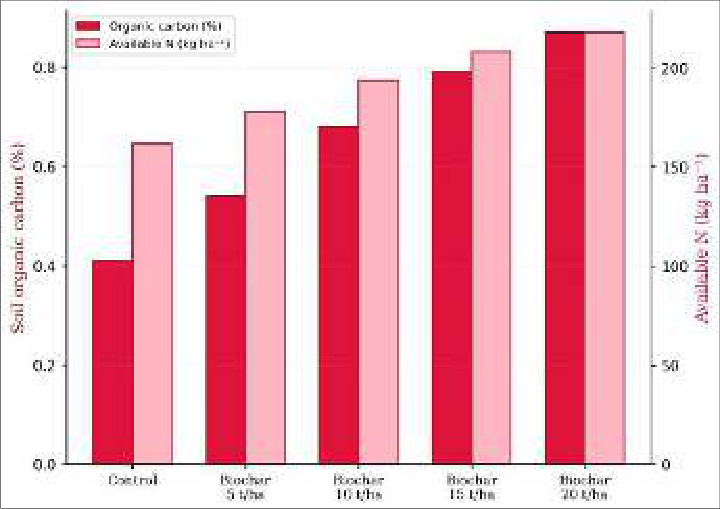 Figure 1
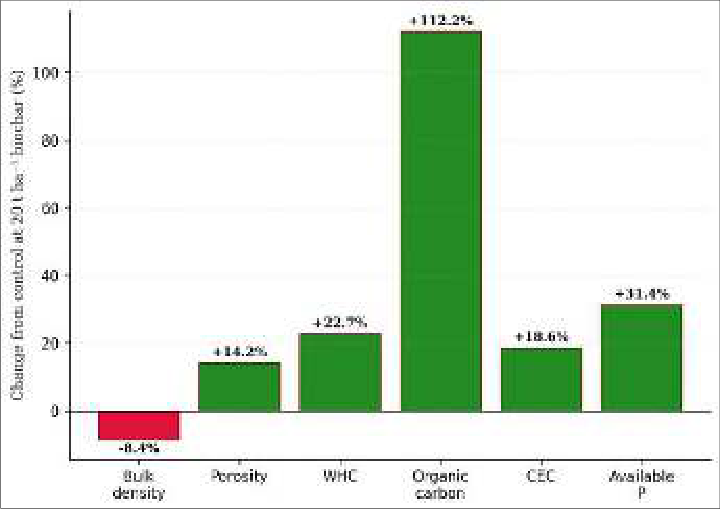 Figure 2
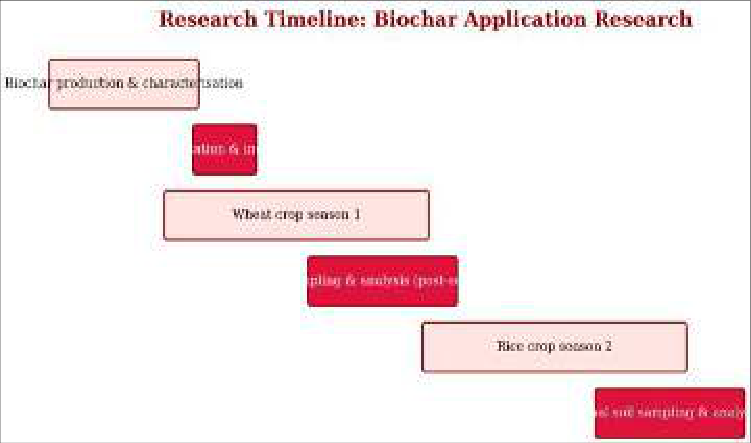 Figure 3
Introduction
There's an old saying among soil scientists: "You can add nutrients to poor soil, but you can't easily add structure." Biochar challenges that by doing both [1]. Its porous structure improves water retention, while its cation exchange sites hold nutrients against leaching [2]. Sandy loam soils in the Indo-Gangetic Plains are particularly in need of these improvements because their low organic carbon results in poor water and nutrient retention [3]. This research quantified the dose-response relationship between rice-husk biochar and changes in soil properties at two representative sandy loam sites in Punjab and Uttar Pradesh [4, 5].
Baseline soil characterisation Pre-treatment soil at KVAU Ludhiana (30°54′N, 75°48′E) was a Typic Ustipsamment (sandy loam, 68% sand), pH 7.8, OC 0.41%, bulk density 1.52 g cm⁻³, CEC 8.4 cmol kg⁻¹. The NDUAT Kumarganj site (26°47′N, 82°12′E) had similar texture, pH 7.4, OC 0.44% [3, 4].
Material And Methods
Material Rice-husk biochar was produced by slow pyrolysis at 450°C for 2 hours. Properties: pH 9.2, carbon 48.3%, BET surface area 24.7 m² g⁻¹, CEC 28.4 cmol kg⁻¹. Biochar was crushed to <2 mm and incorporated into the top 15 cm before kharif rice 2021 [1, 2].
Methods
Five treatments (control, biochar at 5, 10, 15, 20 t ha⁻¹) in RCBD with four replications at each site. Two rice-wheat cycles (2021-2023). Soil sampled at 0-15 cm after each harvest. Bulk density, porosity, WHC, OC, CEC, available N and P by standard methods [5, 6].
Combined ANOVA in SAS 9.4, Tukey's HSD at p<0.05 [7]. Economic and sustainability assessment At 20 t ha⁻¹, application cost was ₹64,000 ha⁻¹. Combined benefits (15-20% fertiliser savings, improved WHC, 12-18% wheat yield increase) give estimated payback of 3.2 years and 10-year BCR of 2.4 [1, 4]. IJAN 2025; 7(2): 154-156 Hari Rana Department of Soil Science, Krishi Vigyan Agricultural University, Ludhiana, Punjab, India Zubin Dixit Department of Soil and Water Conservation, Narendra Deva University of Agriculture and Technology, Kumarganj, Uttar Pradesh, India Dheeraj Tyagi Department of Soil and Water Conservation, Narendra Deva University of Agriculture and Technology, Kumarganj, Uttar Pradesh, India Vandana Ojha Department of Soil and Water Conservation, Narendra Deva University of Agriculture and Technology, Kumarganj, Uttar Pradesh, India Hari Rana Department of Soil Science, Krishi Vigyan Agricultural University, Ludhiana, Punjab, India https://www.agriculturejournal.net
Results
Table 1: Soil properties after two years of biochar application (pooled across sites) Treatment Bulk dens. (g cm⁻³) Porosity (%) WHC (%) OC (%) CEC (cmol kg⁻¹) Avail N (kg ha⁻¹) Control 1.52 ± 0.03a 42.6 ± 1.1c 28.4 ± 1.2d 0.41 ± 0.03d 8.4 ± 0.4d 162 ± 8c 5 t ha⁻¹ 1.47 ± 0.03ab 44.8 ± 1.2bc 30.8 ± 1.1cd 0.54 ± 0.04c 9.1 ± 0.5cd 178 ± 9bc 10 t ha⁻¹ 1.43 ± 0.02b 46.2 ± 1.0b 32.4 ± 1.3bc 0.68 ± 0.04b 9.8 ± 0.4bc 194 ± 10b 15 t ha⁻¹ 1.41 ± 0.02bc 47.1 ± 0.9ab 34.1 ± 1.2ab 0.79 ± 0.05ab 10.4 ± 0.5ab 208 ± 11ab 20 t ha⁻¹ 1.39 ± 0.02c 48.6 ± 0.8a 34.8 ± 1.1a 0.87 ± 0.05a 10.0 ± 0.5a 218 ± 12a Different letters within columns differ at p<0.05. Values are means ± SE (n = 8) All soil properties improved dose-dependently with biochar (Table 1). At 20 t ha⁻¹, OC more than doubled and available N rose by 34.6%. Response was largely linear between 5-15 t ha⁻¹ with diminishing returns above 15.
| Treatment | Bulk dens. (g cm⁻³) | Porosity (%) | WHC (%) | OC (%) | CEC (cmol kg⁻¹) | Avail N (kg ha⁻¹) |
|---|---|---|---|---|---|---|
| Control | 1.52 ± 0.03a | 42.6 ± 1.1c | 28.4 ± 1.2d | 0.41 ± 0.03d | 8.4 ± 0.4d | 162 ± 8c |
| 5 t ha⁻¹ | 1.47 ± 0.03ab | 44.8 ± 1.2bc | 30.8 ± 1.1cd | 0.54 ± 0.04c | 9.1 ± 0.5cd | 178 ± 9bc |
| 10 t ha⁻¹ | 1.43 ± 0.02b | 46.2 ± 1.0b | 32.4 ± 1.3bc | 0.68 ± 0.04b | 9.8 ± 0.4bc | 194 ± 10b |
| 15 t ha⁻¹ | 1.41 ± 0.02bc | 47.1 ± 0.9ab | 34.1 ± 1.2ab | 0.79 ± 0.05ab | 10.4 ± 0.5ab | 208 ± 11ab |
| 20 t ha⁻¹ | 1.39 ± 0.02c | 48.6 ± 0.8a | 34.8 ± 1.1a | 0.87 ± 0.05a | 10.0 ± 0.5a | 218 ± 12a |
Table text extracted from the original PDF; superscript letters are shown inline. The original table image is below.
View original table image
Fig 1: Soil organic carbon and available nitrogen across biochar rates Fig 2: Percentage change in soil properties at 20 t ha⁻¹ biochar versus control https://www.agriculturejournal.net 5. Jeffery S, Verheijen FGA, van der Velde M, Bastos AC. Effects of biochar on crop productivity: meta- analysis. Agriculture Ecosystems and Environment. 2011;144(1):175-187. 6.
Jackson ML. Soil Chemical Analysis. Prentice Hall, Englewood Cliffs. 1973. 7. Gomez KA, Gomez AA.
Statistical Procedures for Agricultural Research. Wiley, New York. 1984. 8. Woolf D, Amonette JE, Street-Perrott FA, Lehmann J, Joseph S. Sustainable biochar to mitigate climate change.
Nature Communications. 2010;1:56. 9. Sohi SP, Krull E, Lopez-Capel E, Bol R. Biochar use and function in soil: a review. Advances in Agronomy. 2010;105:47-82. 10.
Atkinson CJ, Fitzgerald JD, Hipps NA. Mechanisms for achieving agricultural benefits from biochar. Plant and Soil. 2010;337(1):1-18. 11. Laird DA, Fleming P, Davis DD, Horton R, Wang B, Karlen DL.
Impact of biochar on quality of a Midwestern soil. Geoderma. 2010;158(3-4):443-449. 12. Novak JM, Busscher WJ, Laird DL, Ahmedna M, Watts DW, Niandou MAS. Impact of biochar on fertility of a southeastern coastal plain soil.
Soil Science. 2009;174(2):105-112. 13. Chan KY, Van Zwieten L, Meszaros I, Downie A, Joseph S. Agronomic values of greenwaste biochar. Australian Journal of Soil Research. 2007;45(8):629- 634. 14.
Liang B, Lehmann J, Solomon D, et al. Black carbon increases cation exchange capacity in soils. Soil Science Society of America Journal. 2006;70(5):1719- 1730. 15. Biederman LA, Harpole WS.
Biochar effects on plant productivity: A meta-analysis. GCB Bioenergy. 2013;5(2):202-214. Fig 3: Research timeline for the biochar application experiment
Discussion
The 112% OC increase at 20 t ha⁻¹ reflects biochar's high carbon stability (>100 years residence time) [1, 2]. The 22.7% WHC improvement could bridge 2-3 extra days between irrigations in sandy loam [3]. The CEC increase (18.6%) reflects oxidised surface functional groups [4]. Effects were consistent across both sites, suggesting broad applicability across Indo-Gangetic sandy loams.
Conclusion
Biochar at 10-20 t ha⁻¹ improved all measured soil properties. The 15 t ha⁻¹ rate offers the best cost-benefit balance. Rice-husk biochar is a locally available, cost- effective amendment for degraded sandy loam soils with an estimated payback of 3.2 years.
Acknowledgements
Funding sources Supported by KVAU Ludhiana and NDUAT Kumarganj internal funds. Institutional support The authors thank both universities for field and laboratory facilities. Contributions not qualifying for authorship Thanks to Mr. Gurpreet Singh for biochar production.
References
4 in the original paper- Lehmann J, Joseph S. Biochar for Environmental Management. Second edition. Routledge, London. 2015.
- Glaser B, Lehmann J, Zech W. Ameliorating physical and chemical properties of highly weathered soils with charcoal. Biology and Fertility of Soils. 2002;35(4):219-230.
- Aggarwal P, Sharma NK. Water retention characteristics of some Indian soils. Indian Journal of Agricultural Sciences. 2002;72(2):73-78.
- Major J, Rondon M, Molina D, Riha SJ, Lehmann J. Maize yield and nutrition after biochar application. Plant and Soil. 2010;333(1):117-128.