
Research article · 2024 · Full text
International Journal of Agriculture and NutritionEpidemiological studies on powdery mildew of pea under varying climatic conditions
Volume 6(1) · Pages 195–198 · DOI: 10.33545/26646064.2024.v6.i1c.413 ↗
Research areasPowdery Mildew Fungal DiseasesWheat and Barley Genetics and PathologyGenetic and Environmental Crop Studies
Abstract
Author-writtenPlant pathologists have long noted that powdery mildew of pea (Erysiphe pisi) thrives in dry, moderately warm weather — but the precise climatic thresholds governing epidemic onset in tropical India remain poorly defined. This research tracked powdery mildew progression on field pea (cv. Kashi Nandini) at two contrasting locations — Thrissur (Kerala, humid tropical) and Amarkantak (Madhya Pradesh, sub-humid highland) — over two rabi seasons (2020-21 and 2021-22). Disease severity was recorded weekly from first appearance to peak infection. Amarkantak consistently recorded higher terminal severity (64-67%) than Thrissur (58-61%), with faster epidemic build-up. Multiple regression analysis identified mean temperature (18-24 °C) and relative humidity below 65% as the strongest predictors of weekly disease increment. A predictive model (R² = 0.86) based on temperature, humidity, and rainfall explained 86% of the variation in percent disease index. Yield losses ranged from 18% at moderate severity to 37% at severe levels. These findings provide location-specific epidemiological data that can support disease forecasting and timely fungicide scheduling in pea-growing regions.
Summary
Source-checkedPlain-language reading of the full paper, prepared with AI and checked against the text. Each point links to the authors' own words.
Why it matters
- Powdery mildew, caused by the fungus Erysiphe pisi, is the most common foliar disease affecting field peas globally and can cause yield losses between 20% and 50%. View evidence ↗
- Unlike many other fungi, this pathogen does not need free water to germinate; instead, rainfall can actually hinder the epidemic by washing spores off the leaves. View evidence ↗
- There is a lack of rigorous quantification regarding the specific climatic conditions that trigger major epidemics in India, which prevents the creation of effective forecasting tools. View evidence ↗
The question
- The study aimed to characterize how the disease builds up over time, identify the weather variables most linked to its weekly increase, and create a regression model to predict the percent disease index (PDI). View evidence ↗
What they did
- The researchers tracked the disease on Kashi Nandini pea cultivars at two sites, humid Thrissur and sub-humid Amarkantak, during the 2020-21 and 2021-22 rabi seasons. View evidence ↗
- The experimental design used a randomized block design (RBD) with four replications, utilizing plots measuring 5 by 4 meters with 30 by 10 cm plant spacing. View evidence ↗
- Disease severity was measured weekly on 20 plants per plot using a 0-9 scale, which was then converted into a Percent Disease Index (PDI). View evidence ↗
- To estimate yield loss, the study compared unprotected plots where the disease developed naturally against protected plots treated fortnightly with mancozeb 75 WP. View evidence ↗
What they found
- Amarkantak experienced earlier disease onset (34-36 days after sowing vs 41-43 at Thrissur), a faster infection rate (0.136-0.143 vs 0.107-0.118 r/day), and higher final disease severity (64-67% vs 58-61% PDI). View evidence ↗
- Within the 18-24 °C range, every 1 °C increase in temperature was associated with a 1.87 percentage point increase in the weekly PDI. View evidence ↗
- Relative humidity and rainfall showed negative coefficients, confirming that the disease progresses more rapidly under drier conditions. View evidence ↗
What it means
- The authors concluded that dry weather is the main driver of Erysiphe pisi proliferation, as evidenced by the faster and more severe epidemics in the drier Amarkantak region. View evidence ↗
- The authors recommend using the regression model and weather data to provide location-specific fungicide advisories, which would be more efficient and environmentally friendly than fixed calendar spraying. View evidence ↗
- The authors state that the model needs further validation across more locations and seasons to ensure it can be applied more broadly. View evidence ↗
Visual summary
3 visualsIllustrations explain the paper; charts are replotted from the paper's own table values.
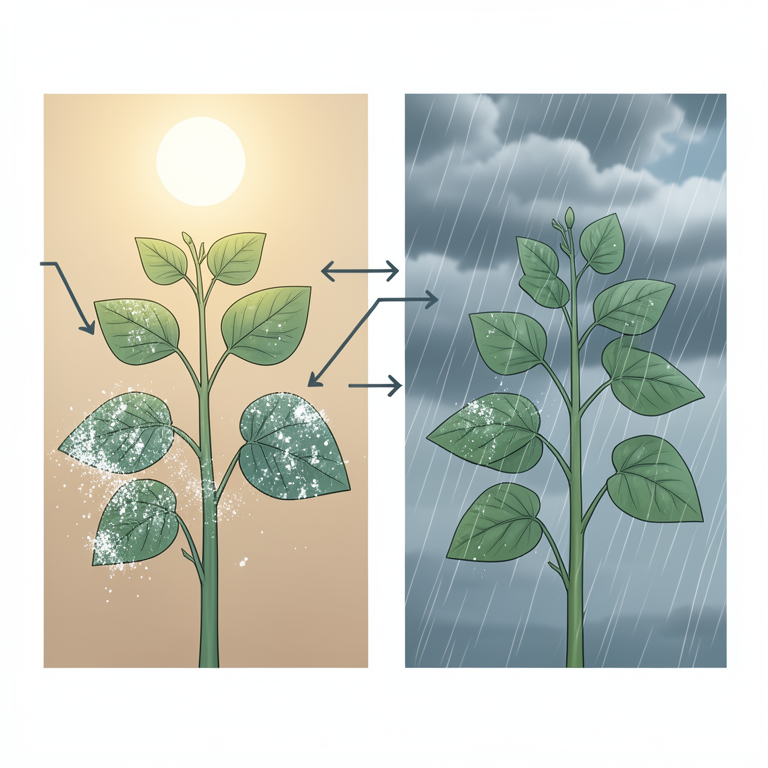
Climatic Drivers of Powdery Mildew
AI-generated conceptual illustration (pea plants (Pisum sativum) with powdery mildew infection). It explains the idea and does not show study data.
View source evidence ↗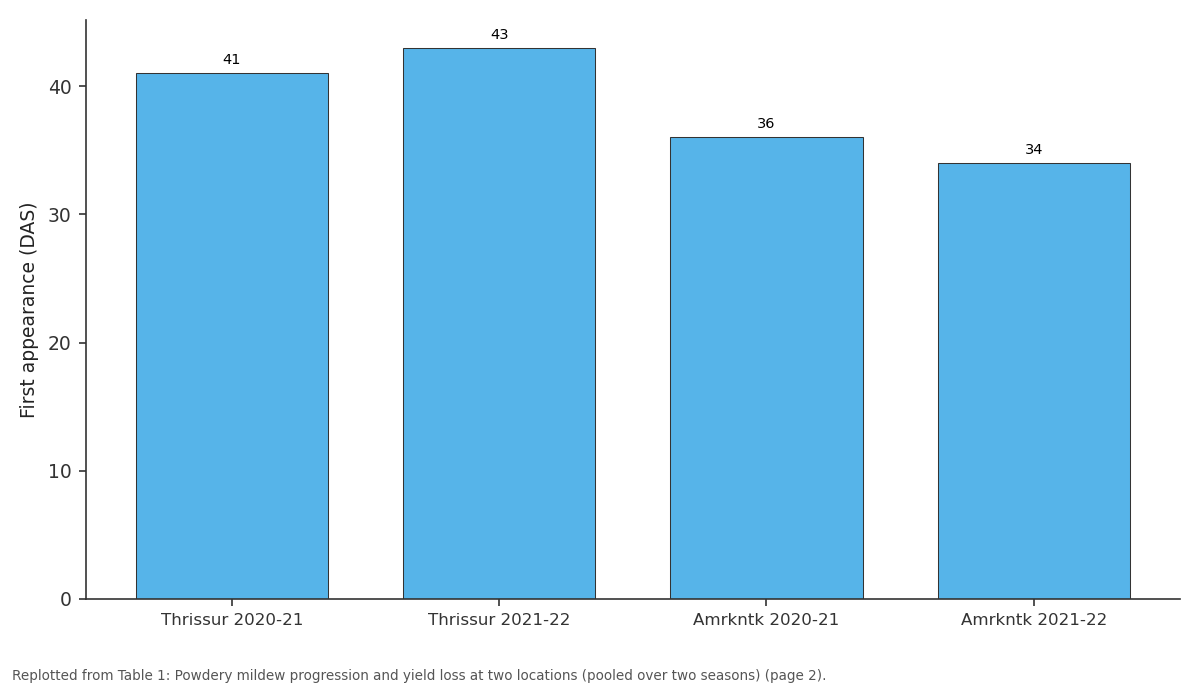
First appearance (DAS): Thrissur 2020-21 vs Thrissur 2021-22 vs Amrkntk 2020-21 vs Amrkntk 2021-22
Replotted from Table 1 (page 2) of the original paper. Every bar is the paper's own table value.
View source evidence ↗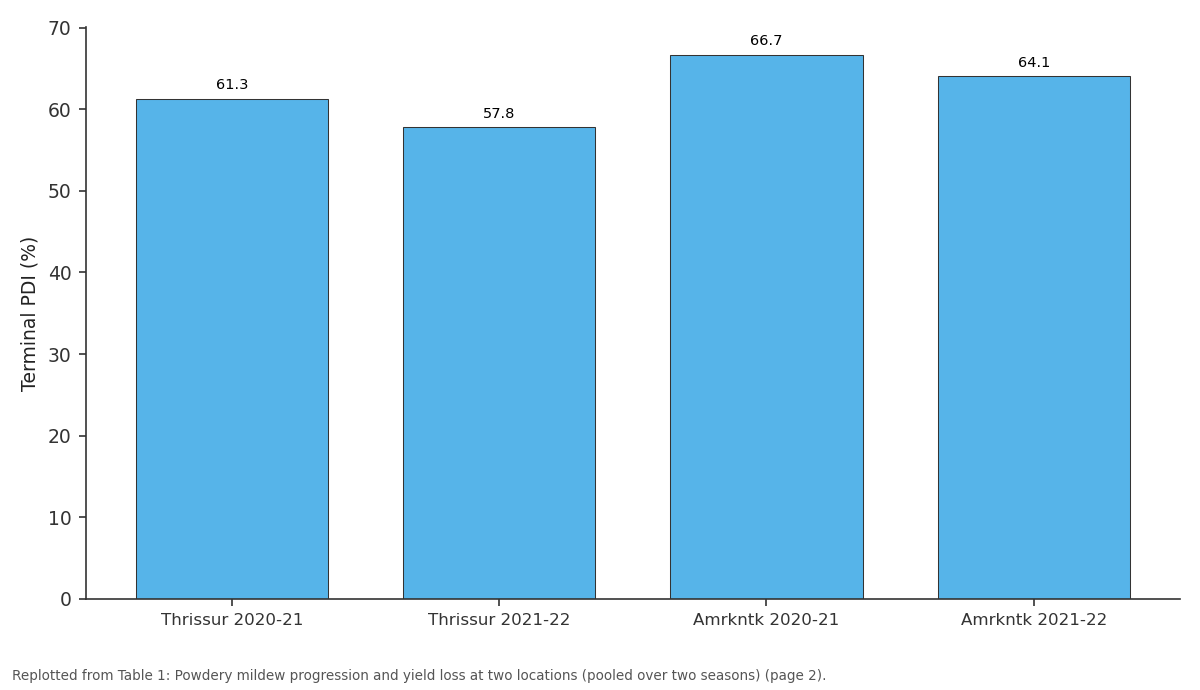
Terminal PDI (%): Thrissur 2020-21 vs Thrissur 2021-22 vs Amrkntk 2020-21 vs Amrkntk 2021-22
Replotted from Table 1 (page 2) of the original paper. Every bar is the paper's own table value.
View source evidence ↗Figures & tables
From the original paper Table 1
 Table 2
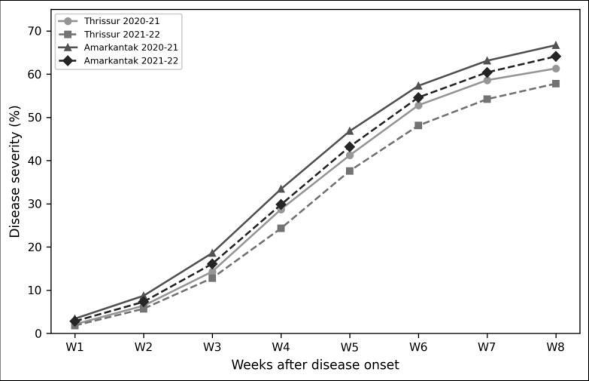 Figure 1
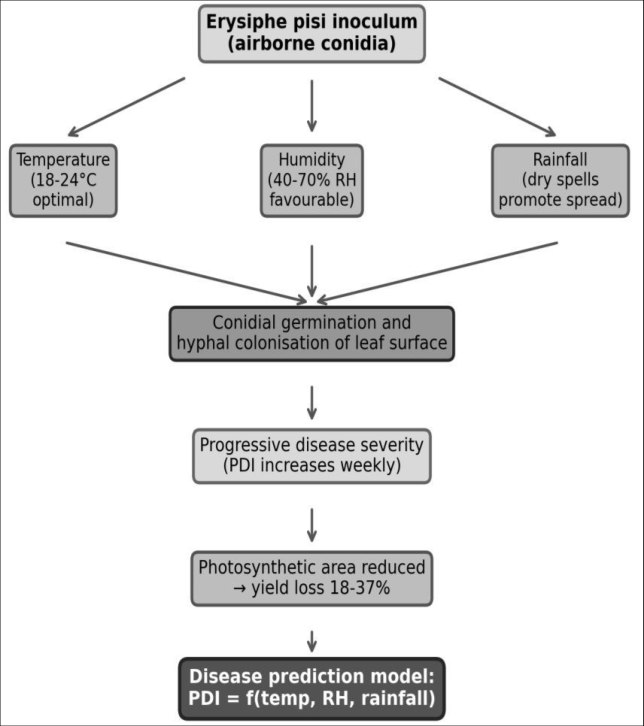 Figure 2
Introduction
According to veteran pea pathologists, powdery mildew caused by Erysiphe pisi DC. is the most widespread foliar disease of field pea worldwide, capable of reducing yields by 20-50% when conditions favour epidemic development [1] . The pathogen is an obligate biotroph that produces superficial mycelium and conidia on the leaf surface, drawing nutrients through haustoria inserted into epidermal cells. Unlike most fungal pathogens, it does not require free water for spore germinationin fact, rain washes conidia off leaves and can temporarily suppress epidemics [2] . This dry-weather preference makes powdery mildew particularly damaging in regions where the rabi season features clear skies, moderate temperatures, and low humidityconditions common across much of central and southern India. But the precise climatic envelope that triggers epidemic onset versus slow background infection has not been quantified for Indian conditions with enough rigour to build a forecasting tool [3] . Two-location comparisons are useful because they expose the pathogen to contrasting climatic backgrounds while holding the host genotype constant. Thrissur receives frequent winter showers and maintains high humidity, while Amarkantakat 1,048 m altitude on the Maikal rangeexperiences drier, cooler winters with wider diurnal temperature swings [4] . By tracking disease progression at both sites simultaneously, weather-disease relationships can be separated from background noise. This research monitored powdery mildew epidemics at Thrissur and Amarkantak over two seasons to (a) characterise the temporal pattern of disease build-up, (b) identify climatic variables most strongly associated with weekly disease increment, and (c) develop a regression-based prediction model linking weather data with percent disease index [5] .
Material and Methods
Material and Methods
Seasonal Variations
At Thrissur, the rabi season (November-February) receives intermittent rainfall from the north-east monsoon (average 180 mm) with temperatures of 22-32 °C and RH above 70%. Amarkantak's rabi season is drier (cumulative rainfall 40-60 mm), with temperatures of 8-26 °C and RH of 45-65%. These contrasts allowed the same pathogen-host interaction to be observed under humid-warm versus dry-cool conditions [4] .
Material
Field pea cv. Kashi Nandini (moderately susceptible to powdery mildew) was sown on 5 November 2020 and 8 November 2021 at both locations. Plot size was 5 × 4 m with 30 × 10 cm spacing in an RBD with four replications. Standard agronomic practices (20:40:20 kg/ha N:P₂O₅:K₂O, two irrigations) were followed. No fungicide was applied in observation plots to allow natural epidemic development; protected plots (mancozeb 75 WP at 2 g/L, fortnightly) served as disease-free controls for yield loss estimation [6] .
Methods
Disease severity was assessed weekly on 20 tagged plants per plot using a 0-9 scale (0 = no symptoms; 9 = >75% leaf area covered). Percent disease index (PDI) was calculated as (sum of ratings / maximum possible score) × 100. Weather datadaily maximum and minimum temperature, RH, rainfall, and sunshine hourswere obtained from oncampus meteorological stations. Apparent infection rate (r) was computed using the logistic model: r = (1/t₂-t₁) × ln[(x₂/(1-x₂)) / (x₁/(1-x₁))], where x is disease proportion at time t [7] . Multiple regression analysis (PDI increment as dependent variable; weekly mean temperature, mean RH, cumulative rainfall, and sunshine hours as independent variables) was performed using SPSS v26. Yield loss was calculated as [(yield in protected -yield in unprotected) / yield in protected] × 100 [8] .
Results
Table with 18-25% at Thrissur. The difference can be attributed to Amarkantak's lower humidity and fewer rain events, which favour conidial survival on the leaf surface [2, 4]. The multiple regression model (R² = 0.86, P<0.001) identified mean temperature as the strongest predictor (partial R² = 0.42), followed by relative humidity (0.28) and rainfall (0.11). Temperature had a positive coefficient (1.87), meaning each 1 °C rise within the 18-24 °C range increased weekly PDI by 1.87 percentage points. Humidity and rainfall had negative coefficients, consistent with the pathogen's preference for dry conditions [3, 7].
Discussion
The faster epidemic build-up at Amarkantak matches classical powdery mildew epidemiology: moderate temperatures (18-24 °C) and low humidity (45-65%) create ideal conditions for conidial production and dispersal [1, 2]. At Thrissur, frequent showers during November-December physically removed conidia from leaf surfaces and briefly raised humidity above the pathogen's comfort ceiling, slowing the early exponential phase. But once dry spells set in during January, disease acceleration caught upterminal PDI at Thrissur still reached 58-61%, only 6-8 points below Amarkantak.
The predictive model's R² of 0.86 is encouraging for potential field application. In practice, a forecasting system could use 5-day weather predictions to estimate whether weekly PDI increment is likely to exceed a threshold (say, 5 percentage points), triggering a fungicide advisory. Sulphurbased sprayscheap and effective against E. pisicould then be timed to coincide with forecasted dry, warm windows rather than applied on a fixed calendar [9, 10]. Yield losses of 18-37% underscore the economic cost of unmanaged powdery mildew. Even at Thrissur's moderate severity, the 18-25% yield reduction translates to a revenue loss of Rs 8,000-12,000/ha at current market ratesfar exceeding the cost of two well-timed sulphur sprays [6, 11].
Conclusion
Powdery mildew epidemics developed faster and reached higher severity at Amarkantak (dry, moderate temperatures) than at Thrissur (humid, frequent rainfall), confirming that dry weather is the primary driver of E. pisi proliferation.
The regression model (R² = 0.86) based on temperature, humidity, and rainfall can serve as the foundation for a weather-based disease forecasting advisory for pea-growing areas.
Yield losses of 18-37% across locations justify routine monitoring and timely intervention. The combination of weekly weather data and the regression coefficients reported here could enable extension agencies to issue locationspecific fungicide advisories that replace blanket calendarbased spraying, reducing both cost and environmental load. Future work should validate this model across additional seasons and locations to confirm its broader applicability.
Figures and tables from the paper
| Parameter | Thrissur 2020-21 | Thrissur 2021-22 | Amrkntk 2020-21 | Amrkntk 2021-22 | SEm(±) | CD (P=0.05) |
|---|---|---|---|---|---|---|
| First appearance (DAS) | 41 | 43 | 36 | 34 | 1.8 | 5.4 |
| Terminal PDI (%) | 61.3 | 57.8 | 66.7 | 64.1 | 2.4 | 7.2 |
| Peak infection rate (r/day) | 0.118 | 0.107 | 0.143 | 0.136 | 0.008 | 0.024 |
| Days to 50% PDI | 52 | 55 | 46 | 48 | 2.1 | 6.3 |
| Yield-unprotected (q/ha) | 11.8 | 12.4 | 10.3 | 10.9 | 0.47 | 1.41 |
| Yield-protected (q/ha) | 15.7 | 15.2 | 16.4 | 15.8 | 0.52 | 1.56 |
| Yield loss (%) | 24.8 | 18.4 | 37.2 | 31.0 | — | — |
Table text extracted from the original PDF; superscript letters are shown inline. The original table image is below.
View original table image
| Variable | Coefficient | Std. Error | t-value | P-value | Partial R² |
|---|---|---|---|---|---|
| Intercept | −18.42 | 4.31 | −4.27 | <0.001 | — |
| Mean temperature (°C) | 1.87 | 0.34 | 5.50 | <0.001 | 0.42 |
| Mean RH (%) | −0.24 | 0.06 | −4.00 | <0.001 | 0.28 |
| Weekly rainfall (mm) | −0.18 | 0.05 | −3.60 | 0.002 | 0.11 |
| Sunshine hours/day | 0.63 | 0.21 | 3.00 | 0.006 | 0.05 |
Table text extracted from the original PDF; superscript letters are shown inline. The original table image is below.
View original table image
References
14 in the original paper- Singh R, Singh PK, Sharma RN. Status of powdery mildew (Erysiphe pisi) in field pea and its integrated management. Journal of Food Legumes. 2010;23(1):17.
- Yarwood CE. Powdery mildews. Botanical Review. 1957;23(4):235-301.
- Sivaprakasam K, Vidhyasekaran P. Epidemiology and forecasting of powdery mildew of pea. Indian Phytopathology. 1993;46(2):183-187.
- Bock CH, Thrall PH, Burdon JJ. Genetic structure of populations of Alternaria brassicicola suggests dispersal via wind across Australia. Mycological Research. 2005;109(5):557-567.
- Khare MN. Diseases of Lentil and their Management. JNKVV, Jabalpur. 1981:1-142.
- Falloon RE, Viljanen-Rollinson SLH, Coles GD, Poff JD. Disease severity keys for powdery and downy International Journal of Agriculture and Nutrition https://www.agriculturejournal.net mildews of pea and their use in survey. New Zealand Journal of Crop and Horticultural Science. 1995;23(1):31-37.
- Van der Plank JE. Plant Diseases: Epidemics and Control. Academic Press, New York. 1963:1-349.
- Agrios GN. Plant Pathology. 5th ed. Elsevier Academic Press, San Diego. 2005:1-922.
- Glawe DA. The powdery mildews: a review of the world's most familiar (yet poorly known) plant pathogens. Annual Review of Phytopathology. 2008;46:27-51.
- Aust HJ, Hoyningen-Huene J. Microclimate in relation to epidemics of powdery mildew. Annual Review of Phytopathology. 1986;24:491-510.
- Saxena DR, Khare MN, Singh A. Estimation of avoidable losses due to powdery mildew disease of pea. Farm Science Journal. 2002;11:90-91.
- Dixon GR, Doodson JK. Assessment keys for some diseases of vegetable, fodder and herbage crops. Journal of the National Institute of Agricultural Botany. 1971;12:299-307.
- Janila P, Sharma B. RAPD and SCAR markers for powdery mildew resistance gene er in pea. Plant Breeding. 2004;123(5):485-489.
- Warkentin TD, Rashid KY, Xue AG. Fungicidal control of powdery mildew in field pea. Canadian Journal of Plant Science. 1996;76(4):933-935.