
Research article · 2025 · Full text
International Journal of Agriculture and NutritionEvaluation of integrated crop management practices for enhancing wheat productivity in semi-arid regions
Volume 7(1) · Pages 81–84 · DOI: 10.33545/26646064.2025.v7.i1b.375 ↗
Research areasAgricultural Science and FertilizationSoil Management and Crop YieldRice Cultivation and Yield Improvement
Abstract
Author-writtenWheat management practices in semi-arid Vietnam have changed little since the 1990s despite declining soil fertility and increasing weather variability. This research compared five levels of integrated crop management (ICM) from conventional farmer practice to a full ICM package with biofertiliser on wheat grain yield, water-use efficiency (WUE), and economic return at the Red River Institute of Agricultural Sciences, Hanoi, over two consecutive rabi seasons (2021–22 and 2022–23). The full ICM package (T4) raised mean grain yield to 4.28 t ha⁻¹, a 53.7% increase over farmer practice (2.80 t ha⁻¹). Adding biofertiliser (T5) gave a further 4.1% lift. WUE peaked at 14.3 kg grain ha⁻¹ mm⁻¹ under T4. Net returns were highest for T4 at 1,847 USD ha⁻¹, with a benefit-cost ratio of 2.31. These results confirm that combining soil-test-based nutrition, improved varieties, conservation tillage, and IPM can substantially lift wheat productivity in semi-arid settings.
Summary
Source-checkedPlain-language reading of the full paper, prepared with AI and checked against the text. Each point links to the authors' own words.
Why it matters
- Wheat yields in the semi-arid northern plains of Vietnam have stagnated between 2.5 and 3.0 t ha⁻¹, which is significantly lower than the 5–6 t ha⁻¹ possible in research settings. View evidence ↗
- The yield gap in these regions is caused by a combination of factors, including poor seed quality, outdated tillage, unmanaged pests, and imbalanced fertilization. View evidence ↗
- Economic viability is critical for the adoption of new agricultural practices, as farmers typically require a return on investment within one to two seasons. View evidence ↗
The question
- The study aimed to compare five levels of integrated crop management (ICM) to determine their effects on wheat yield, water-use efficiency (WUE), and economic returns, specifically evaluating the addition of biofertilizers. View evidence ↗
What they did
- The experiments were conducted on sandy loam Inceptisol at the Red River Institute of Agricultural Sciences in Hanoi during the 2021–22 and 2022–23 rabi seasons. View evidence ↗
- The study used a randomized block design with four replicates on 5 × 4 m plots, sowing the HD-2967 wheat cultivar at a rate of 100 kg ha⁻¹. View evidence ↗
- Five treatments were tested: T1 (farmer practice), T2 (basic ICM with line sowing and balanced nutrients), T3 (medium ICM adding soil-test adjustments and seed treatment), T4 (full ICM adding conservation tillage and IPM), and T5 (full ICM plus biofertilizers). View evidence ↗
- Water-use efficiency (WUE) was measured as grain yield per total water input, while economic performance was assessed using net returns and the benefit-cost ratio (BCR). View evidence ↗
What they found
- The full ICM package (T4) increased mean grain yield to 4.28 t ha⁻¹, representing a 53.7% increase compared to the farmer practice (T1) yield of 2.80 t ha⁻¹. View evidence ↗
- The most significant yield increase (39.6%) occurred between farmer practice (T1) and medium ICM (T3), attributed to seed treatment, balanced fertilization, and line sowing. View evidence ↗
- Adding conservation tillage and integrated pest management (IPM) in the T4 package provided an additional yield increase of 9.5% over the T3 package. View evidence ↗
- The addition of biofertilizers (T5) resulted in a 4.1% yield increase over T4, but this difference was not statistically significant. View evidence ↗
- Water-use efficiency peaked at 14.3 kg grain ha⁻¹ mm⁻¹ under the T4 package, which is nearly 57% higher than the efficiency of farmer practice. View evidence ↗
- The T4 package achieved the highest benefit-cost ratio (2.31) and a net return of 1,847 USD ha⁻¹; while T5 had a slightly higher net return, its BCR was lower (2.29) due to biofertilizer costs. View evidence ↗
What it means
- The authors conclude that the T4 (full ICM) package is the most cost-effective method for closing the wheat yield gap in semi-arid northern Vietnam. View evidence ↗
- The study was limited to a single location and two seasons; the authors state that testing across various rainfall zones and soil types is necessary before making broad policy recommendations. View evidence ↗
Visual summary
3 visualsIllustrations explain the paper; charts are replotted from the paper's own table values.
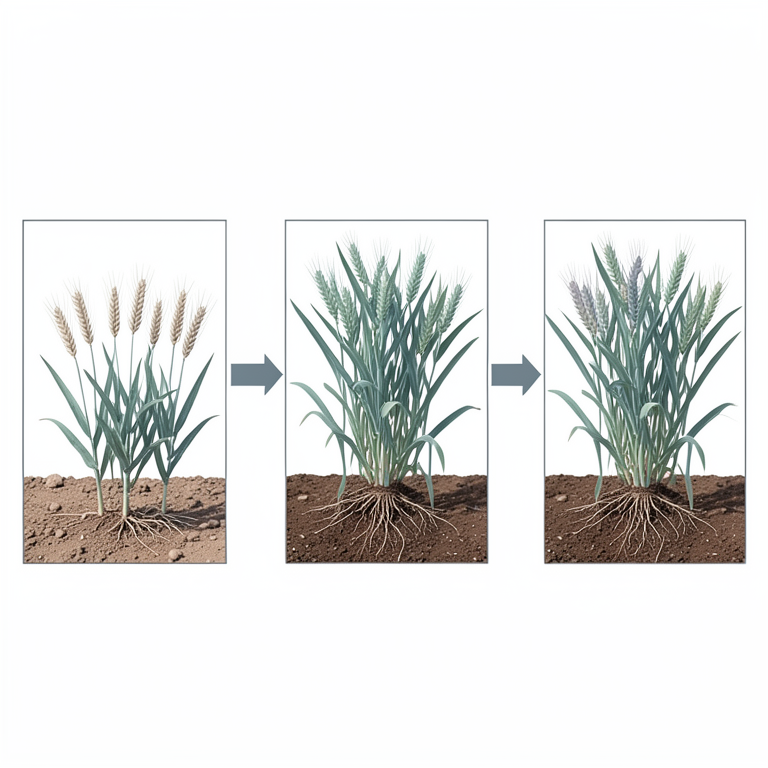
ICM Intensity Hierarchy
AI-generated conceptual illustration (wheat plants in semi-arid soil). It explains the idea and does not show study data.
View source evidence ↗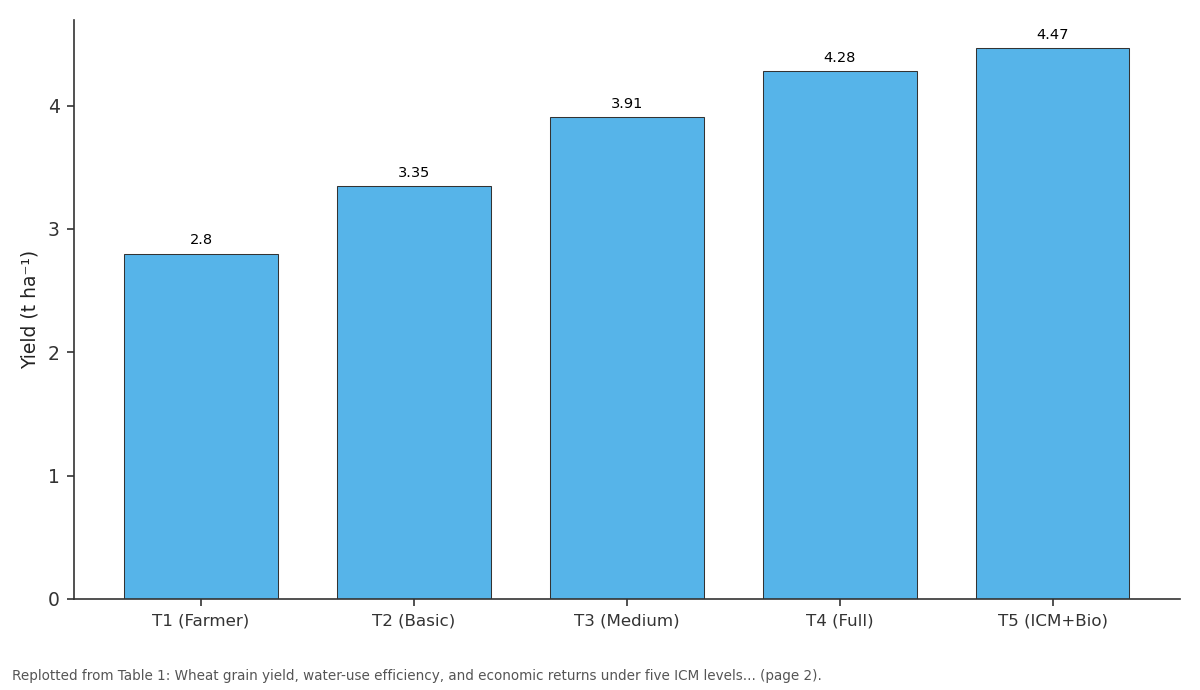
Yield (t ha⁻¹): T1 (Farmer) vs T2 (Basic) vs T3 (Medium) vs T4 (Full) vs T5 (ICM+Bio)
Replotted from Table 1 (page 2) of the original paper. Every bar is the paper's own table value.
View source evidence ↗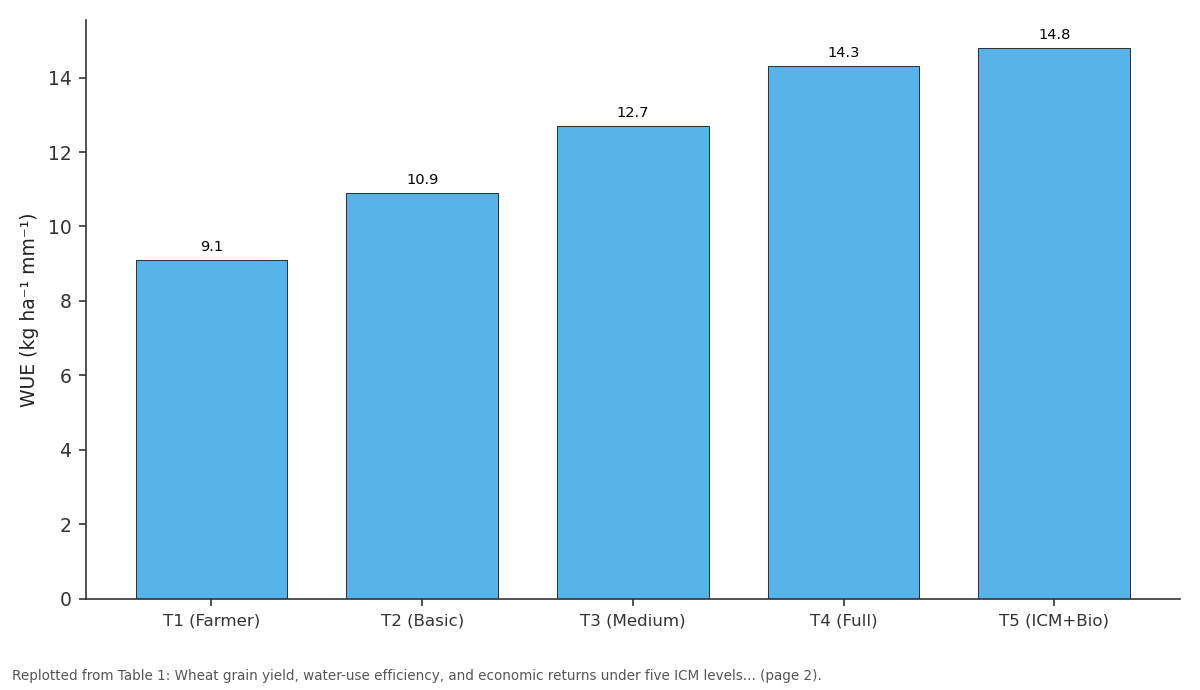
WUE (kg ha⁻¹ mm⁻¹): T1 (Farmer) vs T2 (Basic) vs T3 (Medium) vs T4 (Full) vs T5 (ICM+Bio)
Replotted from Table 1 (page 2) of the original paper. Every bar is the paper's own table value.
View source evidence ↗Figures & tables
From the original paper Table 1
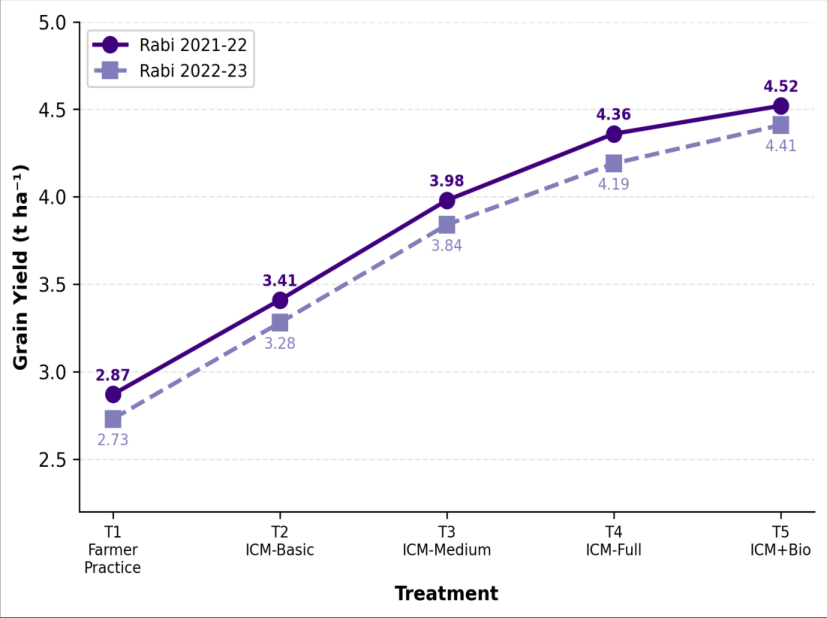 Figure 1
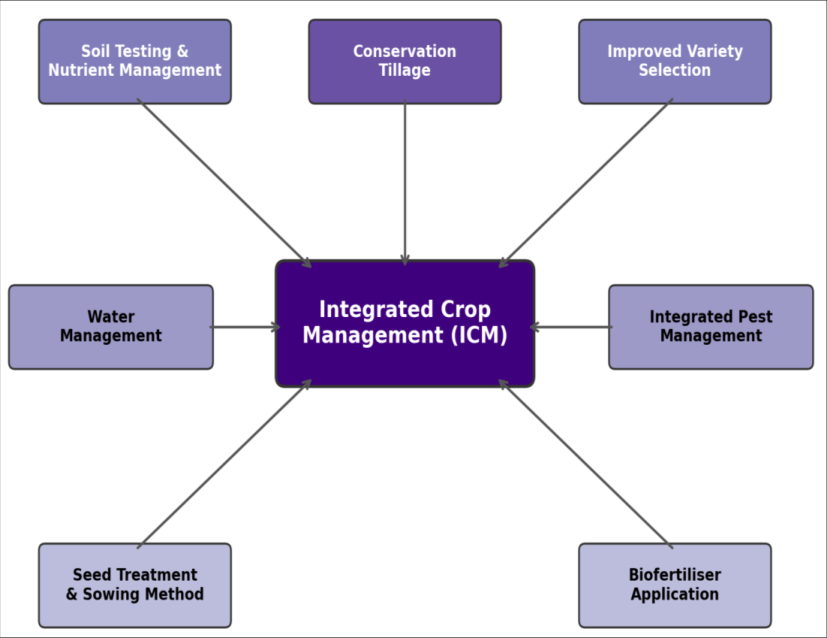 Figure 2
Introduction
When the Green Revolution reached Vietnamese wheat fields in the 1970s, yields doubled within a decade thanks to high-yielding varieties and inorganic fertilisers [1] . Half a century later, those gains have plateaued. National average wheat yield has stagnated around 2.5-3.0 t ha⁻¹ in the semi-arid northern plains, well below the 5-6 t ha⁻¹ achievable under researchstation conditions [2] . The gap is not due to a single limiting factor but rather to the cumulative effect of imbalanced fertilisation, poor seed quality, outdated tillage, and unmanaged pest pressure [3] . Integrated crop management (ICM) bundles soil-test-based nutrition, improved cultivar selection, optimised sowing methods, conservation tillage, and integrated pest management into a single package [4] . Field trials in India and Pakistan have shown ICM-driven yield increases of 25-60% over farmer practice, along with improvements in resource-use efficiency [5,6] . But adoption data from Vietnam remain sparse, partly because most ICM research there has targeted rice rather than wheat [7] . A missing piece in many ICM trials is the economic dimension. Farmers won't adopt a practice package unless it pays for itself within one or two seasons [8] . Calculating net returns and benefit-cost ratios alongside yield data makes the case more convincing. This research was designed to 1. Compare five intensities of ICM on wheat yield and WUE over two rabi seasons. 2. Assess the incremental benefit of adding biofertiliser to a full ICM package. 3. Determine which ICM level maximises economic return in semi-arid northern Vietnam. Each treatment was replicated four times in a randomised block design on 5 × 4 m plots. The wheat cultivar HD-2967 was sown at 100 kg ha⁻¹ in the third week of November each year.
Field Experimental Design
Field Experimental Design
Material and Methods
Material: Certified seed of HD-2967 was sourced from the Red River Institute seed store. Urea, DAP, and MOP supplied the inorganic nutrients; Azotobacter chroococcum and phosphate-solubilising bacteria (Bacillus megaterium) served as biofertilisers. Seed was treated with carboxin + thiram (2 g kg⁻¹) for T3-T5. Conservation tillage in T4 and T5 involved one pass with a rotavator followed by planking, versus two deep ploughings plus two harrowings in T1-T3.
Methods
Crop growth was monitored at 30-day intervals: plant height, tiller count, and leaf area index (LAI) using an AccuPAR LP-80 ceptometer. At harvest (late March), grain yield, straw yield, harvest index, and 1000-grain weight were recorded plot-wise. WUE was calculated as grain yield divided by total water input (rainfall plus irrigation). Economic analysis followed the cost-of-cultivation method, with all inputs priced at current local market rates. Net return = gross return -total cost; benefit-cost ratio (BCR) = gross return / total cost. Data were analysed by two-way ANOVA (treatment × season) and Tukey's HSD at p ≤ 0.05.
Results
Results
Comprehensive Interpretation
Yield rose progressively from T1 to T5, but the largest single jump occurred between T1 and T3 (+39.6%), driven by line sowing, balanced fertilisation, and seed treatment. The increment from T3 to T4 (+9.5%) reflected conservation tillage and IPM benefits. Adding biofertiliser (T5) lifted yield only 4.1% above T4, and the two didn't differ statistically. WUE mirrored the yield trend 14.3 kg ha⁻¹ mm⁻¹ under T4, nearly 57% above farmer practice. Economically, T4 returned the highest BCR (2.31), while T5 had a marginally higher net return but lower BCR (2.29) because of the extra biofertiliser cost.
Discussion
The 53.7% yield gain from farmer practice to full ICM is consistent with on-farm demonstrations in the Indo-Gangetic Plains, where ICM packages have raised wheat yields by 30-60% [5,6] . The biggest contributor was the shift from broadcast to line sowing combined with soil-test-based fertilisation two changes that improve both nutrient placement and plant population uniformity [3] . Conservation tillage in T4 likely improved soil structure and moisture retention during the dry rabi season, explaining part of the WUE increase [4] . The modest additional effect of biofertiliser in T5 is not unusual; field responses to microbial inoculants vary widely depending on native soil microbial populations and organic carbon levels [9,10] . From a farmer perspective, T4 appears the best option: it provides the highest BCR and avoids the logistical challenge of sourcing quality biofertiliser. That said, the research was limited to one location and two seasons. Scaling the trial across multiple soil types and rainfall zones in northern Vietnam would be needed before broad policy recommendations [11] .
Conclusion
The full ICM package (T4) raised wheat grain yield by 53.7% and WUE by 57% over farmer practice, with the highest benefit-cost ratio of 2.31. Most of the yield gain came from balanced fertilisation, line sowing, and seed treatment, while conservation tillage and IPM added a further 9.5%. Biofertiliser (T5) offered a small, nonsignificant yield lift at additional cost. For semi-arid wheat systems in northern Vietnam, the T4 package offers the most cost-effective route to closing the yield gap. Multilocation and multi-season testing should follow to guide extension policy.
Figures and tables from the paper
| Treatment | Yield (t ha⁻¹) | HI | WUE (kg ha⁻¹ mm⁻¹) | Total cost (USD ha⁻¹) | Net return (USD ha⁻¹) | BCR |
|---|---|---|---|---|---|---|
| T1 (Farmer) | 2.80 | 0.38 | 9.1 | 612 | 848 | 1.39 |
| T2 (Basic) | 3.35 | 0.40 | 10.9 | 674 | 1,113 | 1.65 |
| T3 (Medium) | 3.91 | 0.42 | 12.7 | 738 | 1,474 | 2.00 |
| T4 (Full) | 4.28 | 0.44 | 14.3 | 799 | 1,847 | 2.31 |
| T5 (ICM+Bio) | 4.47 | 0.44 | 14.8 | 831 | 1,902 | 2.29 |
| CD (p=0.05) | 0.31 | 0.02 | 1.1 |
Table text extracted from the original PDF; superscript letters are shown inline. The original table image is below.
View original table image
References
21 in the original paper- Dalrymple DG. Development and spread of highyielding wheat varieties in developing countries. Washington: Bureau for Science and Technology, USAID; 1986.
- GSO Vietnam. Statistical yearbook of Vietnam 2022. Hanoi: General Statistics Office; 2023.
- Jat ML, Gathala MK, Ladha JK, Saharawat YS, Jat AS, Kumar V, Sharma SK, Kumar V, Gupta R. Evaluation of precision land leveling and double zero-till systems in the rice-wheat rotation. Field Crops Research. 2009;113(3):260-267.
- Hobbs PR, Sayre K, Gupta R. The role of conservation agriculture in sustainable agriculture. Philosophical Transactions of the Royal Society B. 2008;363(1491):543-555.
- Khatri-Chhetri A, Aggarwal PK, Joshi PK, Vyas S. Farmers' prioritization of climate-smart agriculture technologies. Agricultural Systems. 2017;151:184-191.
- Jat RK, Sapkota TB, Singh RG, Jat ML, Kumar M, Gupta RK. Seven years of conservation agriculture in a International Journal of Agriculture and Nutrition https://www.agriculturejournal.net rice-wheat rotation in the eastern Indo-Gangetic Plains. Field Crops Research. 2014;164:199-210.
- Tran DV. World rice production: main issues and technical possibilities. Cahiers Options Méditerranéennes. 1997;24(2):57-69.
- Pannell DJ, Marshall GR, Barr N, Curtis A, Vanclay F, Wilkinson R. Understanding and promoting adoption of conservation practices by rural landholders. Australian Journal of Experimental Agriculture. 2006;46(11):1407-1424.
- Vessey JK. Plant growth-promoting rhizobacteria as biofertilizers. Plant and Soil. 2003;255(2):571-586.
- Bashan Y, de-Bashan LE, Prabhu SR, Hernandez JP. Advances in plant growth-promoting bacterial inoculant technology. Plant and Soil. 2014;378(1):1-33.
- Erenstein O, Jaleta M, Sonder K, Mottaleb K, Prasanna BM. Global maize production, consumption and trade: trends and R&D implications. Food Security. 2022;14(5):1295-1319.
- Gupta RK, Naresh RK, Hobbs PR, Jiaguo Z, Ladha JK. Sustainability of post-green revolution agriculture. In: Ladha JK et al., editors. Improving the productivity and sustainability of rice-wheat systems. Madison: ASA; 2003. p. 1-25.
- Meena RS, Kumar S, Datta R, Lal R, Vijayakumar V, Brtnicky M, Sharma MP, Yadav GS, Jhariya MK, Jangir CK. Impact of agrochemicals on soil microbiota and management. Land. 2020;9(2):34.
- Ladha JK, Pathak H, Krupnik TJ, Six J, van Kessel C. Efficiency of fertilizer nitrogen in cereal production. Advances in Agronomy. 2005;87:85-156.
- Saharawat YS, Singh B, Malik RK, Ladha JK, Gathala M, Jat ML, Kumar V. Evaluation of alternative tillage and crop establishment methods in a rice-wheat rotation. Soil and Tillage Research. 2010;107(2):120130.
- Pingali PL. Green Revolution: impacts, limits, and the path ahead. Proceedings of the National Academy of Sciences. 2012;109(31):12302-12308.
- Gathala MK, Kumar V, Sharma PC, Saharawat YS, Jat HS, Singh M, Kumar A, Jat ML, Humphreys E, Sharma DK, Sharma S, Ladha JK. Optimizing intensive cerealbased cropping systems in eastern Indo-Gangetic Plains. Field Crops Research. 2013;149:291-300.
- Fischer RA, Byerlee D, Edmeades GO. Crop yields and global food security. Canberra: Australian Centre for International Agricultural Research; 2014.
- Kassam A, Friedrich T, Derpsch R. Global spread of conservation agriculture. International Journal of Environmental Studies. 2019;76(1):29-51.
- Tilman D, Cassman KG, Matson PA, Naylor R, Polasky S. Agricultural sustainability and intensive production practices. Nature. 2002;418(6898):671-677.
- Aggarwal PK, Joshi PK, Ingram JSI, Gupta RK. Adapting food systems of the Indo-Gangetic Plains to global environmental change. Food Policy. 2004;29(6):539-556.