
Research article · 2025 · Full text
International Journal of Agriculture and NutritionResponse of maize to customized fertilizer blends based on soil test values
Volume 7(6) · Pages 35–37 · DOI: 10.33545/26646064.2025.v7.i6a.416 ↗
Research areasAgricultural Science and FertilizationCrop Yield and Soil FertilityPlant Growth and Agriculture Techniques
Abstract
Author-writtenAbout 68% of India’s arable soils show multi-nutrient deficiencies, yet blanket fertiliser recommendations remain the norm. This research evaluated three soil-test-based (STB) customized fertiliser blends against the recommended dose of fertiliser (RDF) and an unfertilised control on maize at the Nagaland University research farm, Medziphema, during Kharif 2022 and 2023. A randomised complete block design with four replications was used. Soil samples taken before sowing were analysed for available N, P, K, S, and Zn, and blend ratios were adjusted to close the gap between soil supply and crop demand. STB-1 (balanced NPKSZn) raised grain yield to 6.83 t ha-1, 23.7% above RDF (5.52 t ha-1). Nutrient uptake in STB-1 reached 148.6 kg N, 31.4 kg P, and 97.2 kg K ha-1. Post-harvest soil fertility improved under STB blends, with available N increasing by 14-19% over the control. The benefit-cost ratio was highest for STB-1 (2.47) followed by STB-2 (2.29). Results indicate that site-specific nutrient management through customized blends can raise maize productivity while maintaining soil health.
Summary
Source-checkedPlain-language reading of the full paper, prepared with AI and checked against the text. Each point links to the authors' own words.
Why it matters
- A significant portion of India's arable soils, approximately 68%, suffer from multiple nutrient deficiencies, but farmers typically follow general fertilizer recommendations. View evidence ↗
- Ignoring local soil nutrient status across 120 million hectares of Indian cropland results in an estimated annual loss of USD 1.2 billion due to wasted inputs. View evidence ↗
- The soils in Nagaland are acidic (pH 4.8-5.6) with high organic matter and variable phosphorus availability, which can affect how efficiently fertilizers work. View evidence ↗
The question
- The study aimed to compare three soil-test-based (STB) fertilizer blends against the recommended dose of fertilizer (RDF) for maize, evaluating their impact on yield, nutrient uptake, soil fertility, and economic returns in north-eastern India. View evidence ↗
What they did
- The experiment used maize hybrid 'Vivek QPM-9' grown during the Kharif seasons of 2022 and 2023 at the Nagaland University research farm in Medziphema. View evidence ↗
- The study employed a randomized complete block design with four replications, testing three customized blends (STB-1, STB-2, STB-3), a standard recommended dose (RDF), and an unfertilized control. View evidence ↗
- Customized blends were created by mechanically mixing urea, single superphosphate, muriate of potash, bentonite sulphur, and zinc sulphate heptahydrate. View evidence ↗
- Statistical analysis was performed using ANOVA in R (v4.3.1), with mean comparisons conducted via Tukey’s HSD at a significance level of p = 0.05. View evidence ↗
What they found
- The highest total nutrient uptake was observed in the STB-1 treatment, with values of 148.6 kg N, 31.4 kg P, and 97.2 kg K ha-1. View evidence ↗
- Apparent nitrogen recovery was most efficient under STB-1 (47.3%), compared to STB-2 (42.8%) and RDF (38.1%). View evidence ↗
- Phosphorus recovery was higher under STB-1 (21.6%) than under RDF (16.4%), which the authors attribute to the inclusion of sulphur and zinc. View evidence ↗
- Post-harvest soil fertility was improved by STB blends, specifically increasing available nitrogen by 14-19% compared to the control. View evidence ↗
- The STB-1 blend provided the best economic return with a benefit-cost ratio of 2.47, followed by STB-2 at 2.29. View evidence ↗
What it means
- The authors recommend that farmers in north-eastern India move away from blanket fertilizer recommendations toward site-specific blends based on routine soil testing. View evidence ↗
- A primary limitation to the adoption of this method is the lack of blending infrastructure, requiring investment in village-level mixing units for scaling. View evidence ↗
- The authors suggest that future research should expand to more soil types and include long-term monitoring of biological health indicators and soil organic carbon. View evidence ↗
Visual summary
3 visualsIllustrations explain the paper; charts are replotted from the paper's own table values.
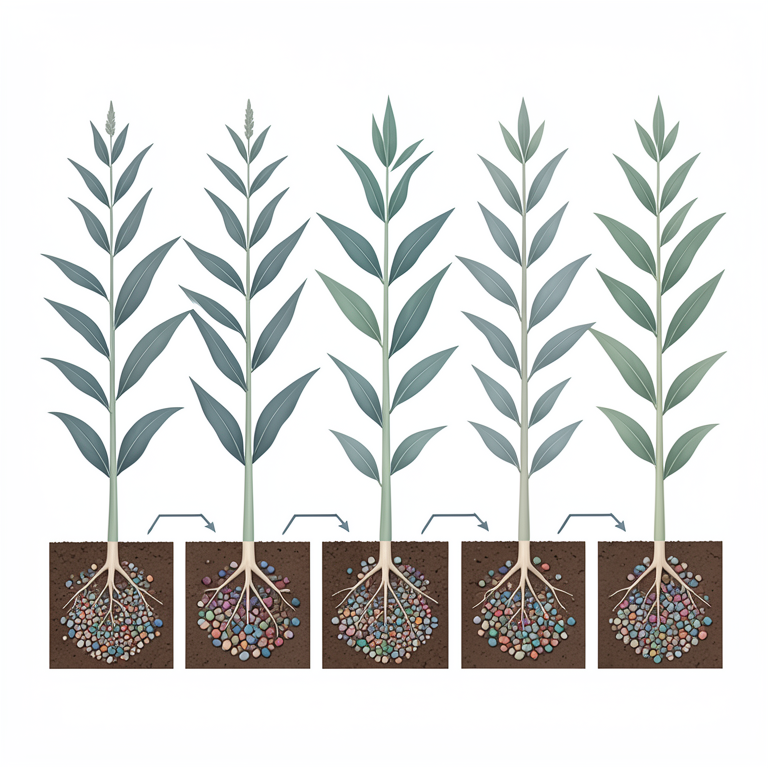
Experimental Treatment Comparison
AI-generated conceptual illustration (maize plants). It explains the idea and does not show study data.
View source evidence ↗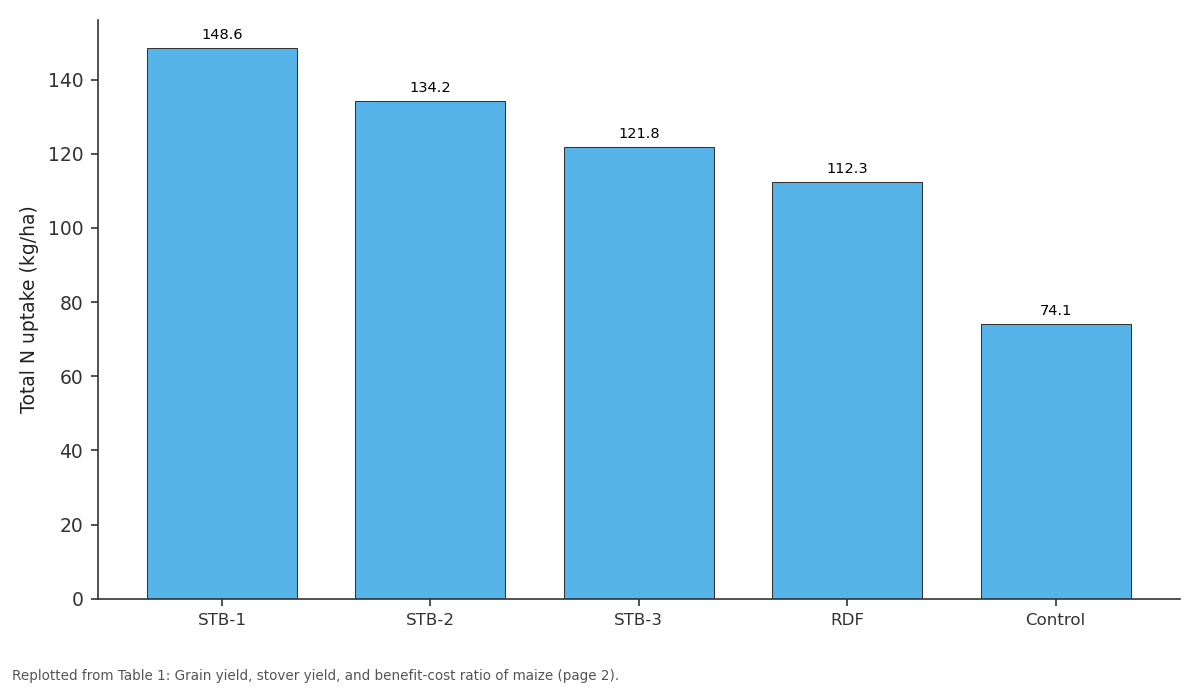
Total N uptake (kg/ha): STB-1 vs STB-2 vs STB-3 vs RDF vs Control
Replotted from Table 1 (page 2) of the original paper. Every bar is the paper's own table value.
View source evidence ↗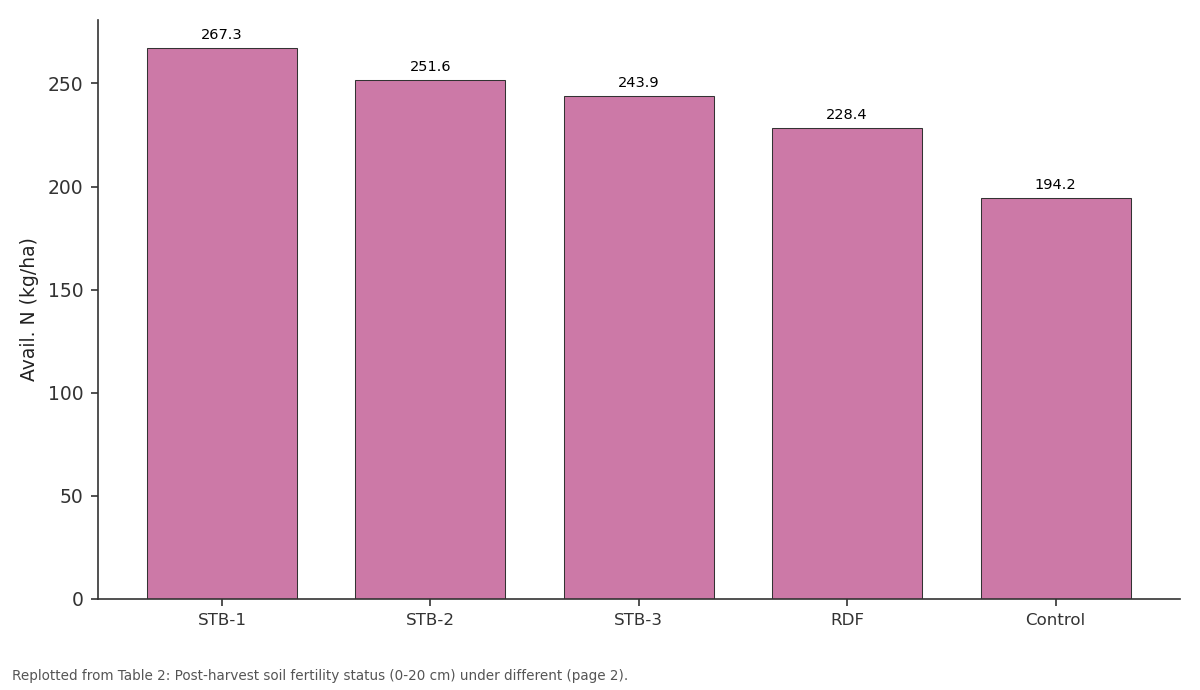
Avail. N (kg/ha): STB-1 vs STB-2 vs STB-3 vs RDF vs Control
Replotted from Table 2 (page 2) of the original paper. Every bar is the paper's own table value.
View source evidence ↗Figures & tables
From the original paper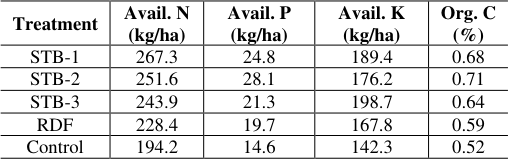 Table 2
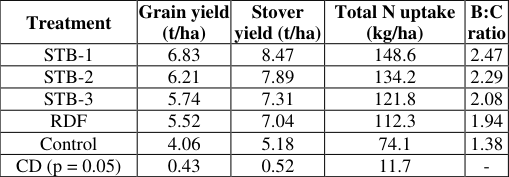 Table 1
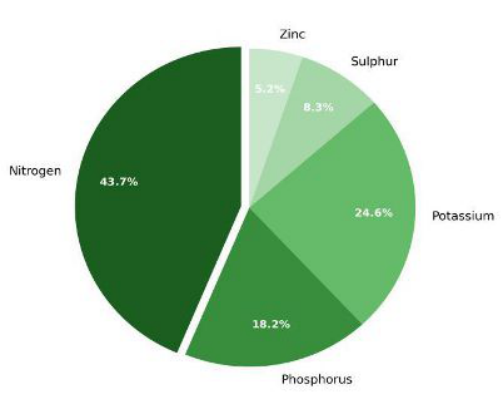 Figure 1
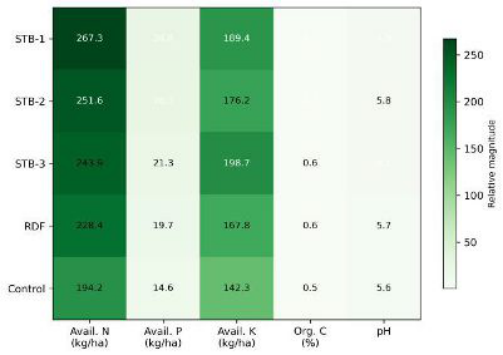 Figure 2
Introduction
Roughly 120 million hectares of cropland in India receive fertiliser doses that ignore local soil nutrient status, a disconnect that costs farmers an estimated USD 1.2 billion per year in wasted inputs [1] . Maize (Zea mays L.) is the third most cultivated cereal in the country, and its demand for nitrogen alone ranges from 150 to 200 kg ha -1 depending on yield target and soil reserve [2] . When a single blanket recommendation is applied across diverse soil types, some fields receive more nutrient than the crop can use while others stay deficient, leading to uneven yields and environmental losses [3] . Soil-test-based fertilisation attempts to close this gap by matching nutrient supply to crop demand on a field-by-field basis [4] . The concept isn't new-targeted nutrient management has been promoted since the 1970s-but the recent availability of portable soil testing kits and GPS-linked sampling has made it more practical at scale [5] . Customized fertiliser blends take the idea further by physically mixing granular nutrients in proportions dictated by soil analysis, so that a single product delivers the exact balance each field needs [6] . Reports from rice and wheat systems in the Indo-Gangetic Plains showed that customized blends raised yield by 8-15% over blanket recommendations while cutting nutrient surplus [7] . However, validation data for maize on the acidic, hill soils of north-eastern India remain thin. Nagaland's soils are characterised by low pH (4.8-5.6), high organic matter, and variable phosphorus availability, conditions that may alter fertiliser efficiency [8] . This research was designed to (i) compare three soil-test-based blends with the standard RDF for maize at Medziphema, (ii) assess nutrient uptake and post-harvest soil fertility, and (iii) determine the economic advantage of customized blending under north-eastern Indian conditions.
Baseline Soil Analysis
Pre-sowing composite soil samples (0-20 cm depth) were collected from each block and analysed following standard protocols. The experimental soil was acidic (pH 5.3), with medium organic carbon (0.61%), low available nitrogen (187.4 kg ha -1 ), medium available phosphorus (16.2 kg P 2 O 5 ha -1 ), and medium available potassium (154.8 kg K 2 O ha -1 ). Available sulphur was 9.7 mg kg -1 and DTPA-extractable zinc was 0.54 mg kg -1 , both below critical limits for maize. Blend formulations were calculated using the targeted yield equation adjusted for these baseline values [9] . [10] .
Materials and Methods
Materials and Methods
Materials
Materials
Methods
Customized blends were prepared by mechanically mixing urea, single superphosphate, muriate of potash, bentonite sulphur, and zinc sulphate heptahydrate in proportions matching each treatment. Half the nitrogen was applied as basal and the remainder top-dressed at the V8 stage. Plant and grain samples were digested in di-acid mixture and analysed for N (micro-Kjeldahl), P (vanadomolybdate), and K (flame photometry) [11] . Post-harvest soil samples were analysed using the same methods as baseline. Grain yield was recorded from the net plot area and adjusted to 15% moisture. Data were subjected to ANOVA in R (v4.3.1) and means were compared using Tukey's HSD at p = 0.05.
Nutrient Budget
Apparent nutrient recovery was calculated as (uptake in fertilised plot-uptake in control)/nutrient applied × 100. STB-1 achieved the highest apparent N recovery (47.3%), followed by STB-2 (42.8%) and RDF (38.1%). Phosphorus recovery was 21.6% under STB-1 versus 16.4% under RDF, reflecting the benefit of balanced sulphur and zinc supply in unlocking fixed phosphorus in acidic soils [12] . The nutrient balance (applied minus removed) was slightly positive for N and K in all STB treatments, indicating sustainable nutrient cycling.
Results
Grain yield differed markedly among treatments in both seasons (Table 1). STB-1 produced 6.83 t ha -1 (pooled mean), which was 23.7% higher than RDF and 68.4% higher than the unfertilised control. STB-2 and STB-3 fell between these extremes. Stover yield followed a similar pattern. Total nutrient uptake was greatest under STB-1, reaching 148.6 kg N, 31.4 kg P, and 97.2 kg K ha -1 .
| Treatment | Grain yield (t/ha) | Stover yield (t/ha) | Total N uptake (kg/ha) | B:C ratio |
|---|---|---|---|---|
| STB-1 | 6.83 | 8.47 | 148.6 | 2.47 |
| STB-2 | 6.21 | 7.89 | 134.2 | 2.29 |
| STB-3 | 5.74 | 7.31 | 121.8 | 2.08 |
| RDF | 5.52 | 7.04 | 112.3 | 1.94 |
| Control | 4.06 | 5.18 | 74.1 | 1.38 |
| CD (p = 0.05) | 0.43 | 0.52 | 11.7 | - |
Table text extracted from the original PDF; superscript letters are shown inline. The original table image is below.
View original table image
Comprehensive Interpretation
The superiority of STB-1 appears to stem from two factors: adequate sulphur supply that improved nitrogen-use efficiency, and zinc addition that may have activated phosphorus-mobilising enzymes in the rhizosphere [13] . The post-harvest soil data (Table 2) show that STB treatments maintained or raised available nutrient pools relative to the control, whereas RDF left some nutrients below the initial baseline, pointing to a mining effect under imbalanced fertilisation.
| Treatment | Avail. N (kg/ha) | Avail. P (kg/ha) | Avail. K (kg/ha) | Org. C (%) |
|---|---|---|---|---|
| STB-1 | 267.3 | 24.8 | 189.4 | 0.68 |
| STB-2 | 251.6 | 28.1 | 176.2 | 0.71 |
| STB-3 | 243.9 | 21.3 | 198.7 | 0.64 |
| RDF | 228.4 | 19.7 | 167.8 | 0.59 |
| Control | 194.2 | 14.6 | 142.3 | 0.52 |
Table text extracted from the original PDF; superscript letters are shown inline. The original table image is below.
View original table image
Discussion
23.7% yield advantage of STB-1 over RDF is consistent with reports from customized blend trials on rice in Odisha (19-27% gain) and wheat in Bihar (14-22% gain) [7,14] . The mechanism appears straightforward: when sulphur and zinc, which are deficient in most acidic north-eastern soils, are supplied alongside NPK, the crop can assimilate nitrogen more efficiently because sulphur is a structural component of proteins and zinc catalyses several N-metabolism enzymes [13] . That STB-2 also outperformed RDF, though by a smaller margin, suggests that even a partial correction of secondary and micronutrient deficiency brings measurable returns. The control plots, yielding just 4.06 t ha -1 , underline the inherent fertility constraints of these soils and the absolute need for external nutrient input [8] . Post-harvest soil fertility under STB-1 exceeded the initial baseline for available N and P, indicating that the crop didn't deplete the soil pool despite higher offtake. This likely reflects improved root proliferation and rhizosphere microbial activity under balanced nutrition, an effect documented in long-term fertility trials elsewhere [15,16] . The benefit-cost ratio of 2.47 for STB-1 is attractive for smallholders, though the availability of custom-blending infrastructure in remote areas of Nagaland may limit immediate adoption. Public-private partnerships to set up village-level blending units could bridge this gap [17] .
Conclusion
Soil-test-based customized fertiliser blends raised maize grain yield by up to 23.7% over the blanket RDF and improved nutrient uptake, apparent recovery, and postharvest soil fertility on the acidic soils of Nagaland. STB-1, which supplied the full complement of N, P, K, S, and Zn based on soil analysis, was the top performer in both yield and economic terms (B:C = 2.47). Even the lower-input STB-3 blend outperformed RDF, confirming that correcting secondary and micronutrient gaps matters more than simply raising NPK rates. For farmers in north-eastern India, these results support shifting from one-size-fits-all fertiliser advice to sitespecific blends prepared after routine soil testing. The practical bottleneck is blending infrastructure; scaling this approach will need investment in village-level mixing units. Future research should test customized blends across a wider range of soil types and include long-term monitoring of soil organic carbon and biological health indicators.
Figures and tables from the paper
References
19 in the original paper- Datta SP, Saharan N, Rattan RK. Micronutrient deficiency in Indian soils and their management. Indian Journal of Fertilisers. 2018;14(4):62-73.
- Jat ML, Satyanarayana T, Majumdar K, Parihar CM, Jat SL. Fertiliser best management practices for maize systems. Indian Journal of Agronomy. 2013;58(4):452460.
- Shukla AK, Behera SK, Pakhre A, Chaudhari SK. Micronutrient deficiencies vis-a-vis food and nutritional security of India. Indian Journal of Fertilisers. 2018;14(12):52-67.
- Drinkwater LE, Snapp SS. Nutrients in agroecosystems: rethinking the management paradigm. Advances in Agronomy. 2007;92:163-186.
- Pampolino MF, Witt C, Pasuquin JM, Johnston A, Fisher MJ. Development approach and evaluation of the Nutrient Expert software. Computers and Electronics in Agriculture. 2012;88:103-110.
- Chander G, Wani SP, Sahrawat KL, Kamdi PJ, Pal CK, Pal DK. Balanced and integrated nutrient management for enhanced crop productivity. Archives of Agronomy and Soil Science. 2013;59(10):1313-1334.
- Sapkota TB, Jat ML, Jat RK, Kapoor P, Stirling C. Yield estimation and food security in the Indo-Gangetic Plains. Global Food Security. 2016;10:54-62.
- Sharma UC, Singh RP. Acid soils of India: their chemistry, catenary relationships and key management practices. Advances in Agronomy. 2002;78:345-399.
- Ramamurthy V, Naidu LGK, Ramesh Kumar SC, Srinivas S, Hegde R. Soil-based nutrient management in Karnataka. Current Science. 2009;97(9):1355-1361.
- Kumar R, Kumawat N, Sahu YK. Seed treatment with biocontrol agents for sustainable maize production. Journal of Applied and Natural Science. 2017;9(3):1642-1647.
- Tandon HLS. Methods of analysis of soils, plants, waters and fertilisers. Fertiliser Development and Consultation Organisation. New Delhi; 2005.
- Fageria NK, Baligar VC, Clark RB. Micronutrients in crop production. Advances in Agronomy. 2002;77:185268.
- Cakmak I. Enrichment of cereal grains with zinc: agronomic or genetic biofortification? Plant and Soil. 2008;302(1):1-17.
- Singh VK, Dwivedi BS, Shukla AK, Chauhan YS, Yadav RL. Diversification of rice with pigeonpea in a rice-wheat cropping system. Field Crops Research. 2005;94(1):64-74.
- Blair N, Faulkner RD, Till AR, Poulton PR. Long-term management impacts on soil C, N and physical fertility. Soil and Tillage Research. 2006;91(1-2):30-38.
- Lal R. Restoring soil quality to mitigate soil degradation. Sustainability. 2015;7(5):5875-5895.
- Jha D, Chand R. Fertiliser policy issues and challenges. Indian Journal of Agricultural Economics. 2001;56(3):281-294.
- Tiwari KN. Soil potassium status and crop response to potash application in India. Better Crops. 2004;88(4):69.
- Meena RS, Kumar S, Datta R, Lal R, Vijayakumar V, Brtnicky M. Impact of agrochemicals on soil microbiota and management. Land. 2020;9(2):34.