
Research article · 2024 · Full text
International Journal of Agriculture and NutritionNutrient uptake pattern and fertilizer response of high-yielding finger millet genotypes
Volume 6(1) · Pages 191–194 · DOI: 10.33545/26646064.2024.v6.i1c.412 ↗
Research areasAgricultural Science and FertilizationCrop Yield and Soil FertilityAgricultural Productivity and Crop Improvement
Abstract
Author-writtenA single hectare of finger millet can extract over 80 kg of potassium from the soil — yet most fertiliser recommendations for this crop ignore genotypic differences in nutrient demand. This research compared the nutrient uptake pattern and fertiliser response of four finger millet genotypes (GPU 28, GPU 67, KMR 204, VR 847) under four fertiliser levels (0, 50, 100, 150% of recommended dose) at Bundelkhand University of Agricultural Sciences, Jhansi, during Kharif 2021. GPU 67 recorded the highest grain yield (34.7 q/ha at 100% RDF), nitrogen uptake (74.8 kg/ha), and agronomic efficiency (12.3 kg grain/kg nutrient). KMR 204 was least responsive, with a flat yield curve beyond 50% RDF. Potassium uptake exceeded nitrogen uptake in all genotypes, confirming the crop's characteristically high K demand. Nutrient use efficiency declined at 150% RDF across all genotypes, indicating diminishing returns from over-fertilisation. GPU 67 appears best suited for intensive management, while KMR 204 may fit low-input systems where fertiliser cost is a constraint.
Summary
Source-checkedPlain-language reading of the full paper, prepared with AI and checked against the text. Each point links to the authors' own words.
Why it matters
- Finger millet is a critical staple crop for dryland farmers in central and southern India and ranks as the third most-produced millet worldwide. View evidence ↗
- There is a significant gap between national average yields (17 q/ha) and the potential yield (over 40 q/ha), largely due to inefficient nutrient management. View evidence ↗
- Standard fertilizer recommendations ignore genotypic differences in root architecture and nutrient efficiency, which can lead to varied crop responses to the same dose. View evidence ↗
The question
- The study aimed to characterize nutrient uptake patterns, quantify efficiency, and identify the best genotype-fertilizer combinations to maximize yield for four finger millet genotypes. View evidence ↗
What they did
- The experiment tested four genotypes (GPU 28, GPU 67, KMR 204, and VR 847) at the BUAS research farm in Jhansi, starting July 12, 2021. View evidence ↗
- Four fertilizer levels were applied: no fertilizer (F0), 50% of the recommended dose (F1), 100% (F2), and 150% (F3). View evidence ↗
- The study employed a factorial randomized block design (RBD) with three replications in plots measuring 4 x 3 meters. View evidence ↗
- Nutrient analysis involved micro-Kjeldahl for nitrogen, vanadomolybdate colorimetry for phosphorus, flame photometry for potassium, and atomic absorption spectrophotometry for zinc and iron. View evidence ↗
What they found
- At 100% of the recommended dose, GPU 67 had the highest grain yield and nutrient uptake, with nitrogen uptake (74.8 kg/ha) being 21.8% higher than that of KMR 204 (61.4 kg/ha). View evidence ↗
- Agronomic efficiency decreased as fertilizer doses increased; however, GPU 67 at 50% RDF showed a higher nitrogen agronomic efficiency (13.8 kg grain/kg N) than KMR 204 at any tested dose. View evidence ↗
- Iron uptake (278-347 g/ha) was approximately 1.5 times higher than zinc uptake, which corresponds to the high iron concentration in the grain. View evidence ↗
What it means
- The authors conclude that GPU 67 is the most nutrient-responsive genotype for intensive management, while KMR 204 is better suited for low-input systems due to its low responsiveness beyond 50% RDF. View evidence ↗
- Because potassium uptake consistently exceeded nitrogen uptake, the authors recommend increasing potassium fertilizer recommendations for high-yielding production. View evidence ↗
- The authors recommend moving away from blanket fertilizer recommendations toward genotype-specific scheduling for farmers in Bundelkhand. View evidence ↗
Visual summary
3 visualsIllustrations explain the paper; charts are replotted from the paper's own table values.
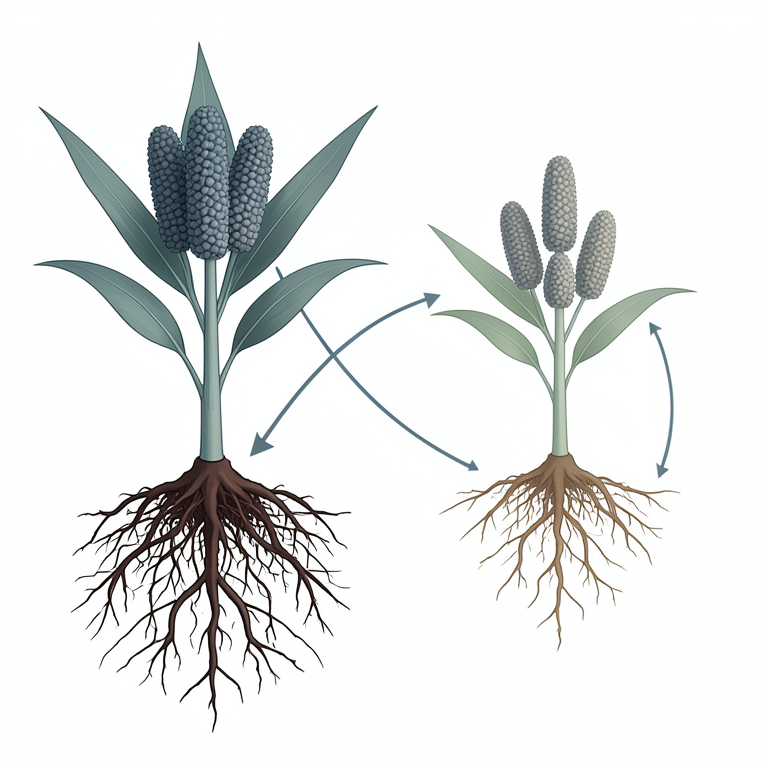
Genotype-Specific Nutrient Response
AI-generated conceptual illustration (finger millet plants). It explains the idea and does not show study data.
View source evidence ↗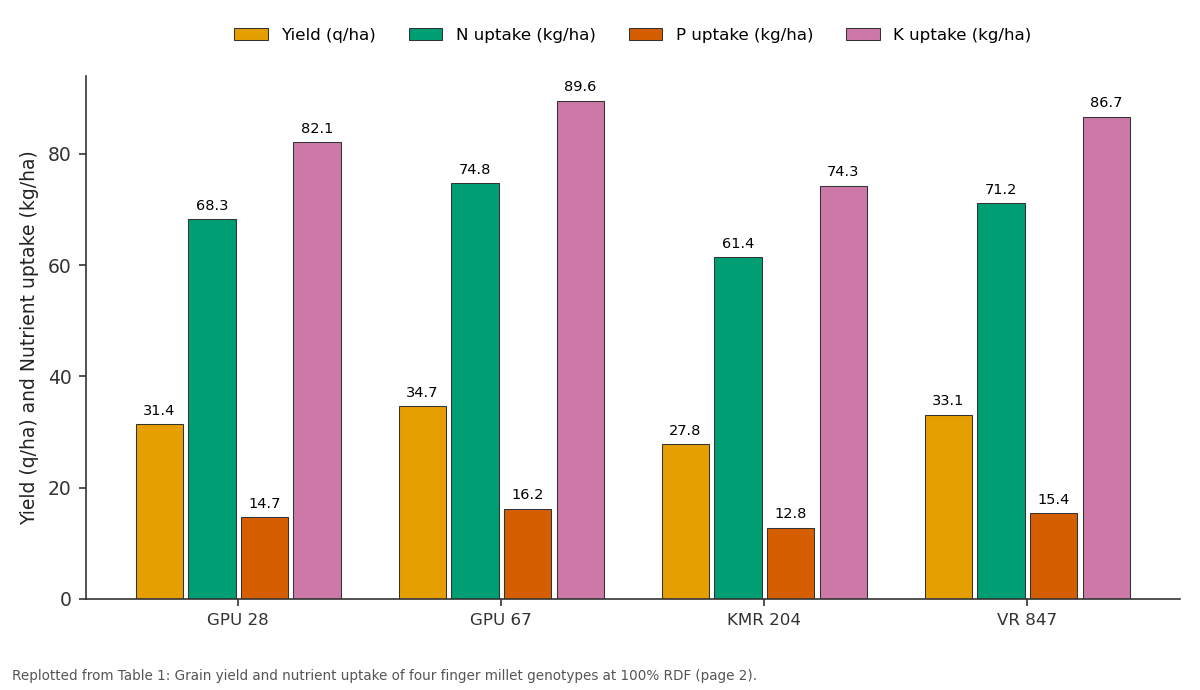
Yield (q/ha) and N uptake (kg/ha) and more: GPU 28 vs GPU 67 vs KMR 204 vs VR 847
Replotted from Table 1 (page 2) of the original paper. Every bar is the paper's own table value.
View source evidence ↗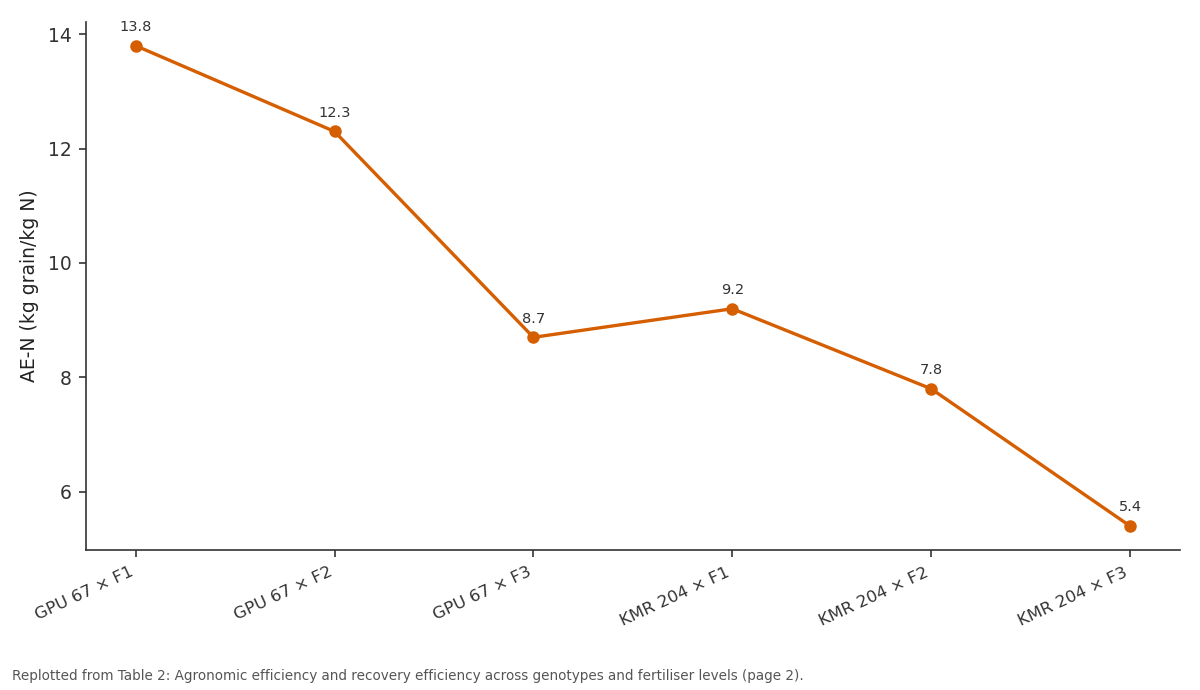
AE-N: GPU 67 × F1 vs GPU 67 × F2 vs GPU 67 × F3 vs KMR 204 × F1 vs KMR 204 × F2
Replotted from Table 2 (page 2) of the original paper. Every bar is the paper's own table value.
View source evidence ↗Figures & tables
From the original paper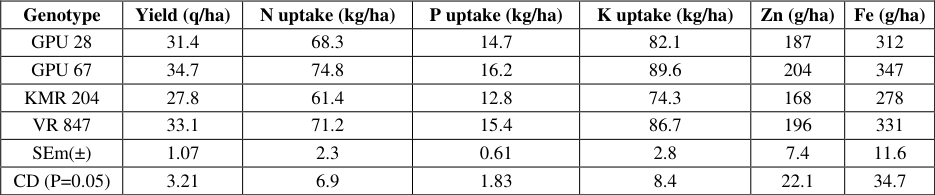 Table 1
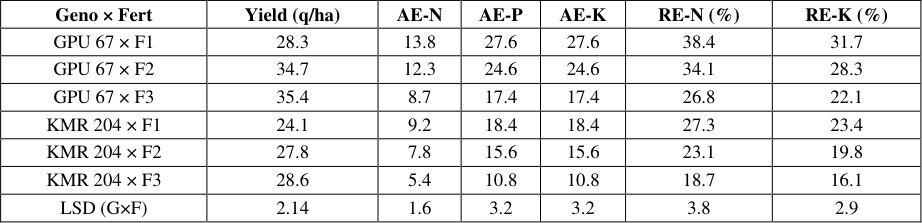 Table 2
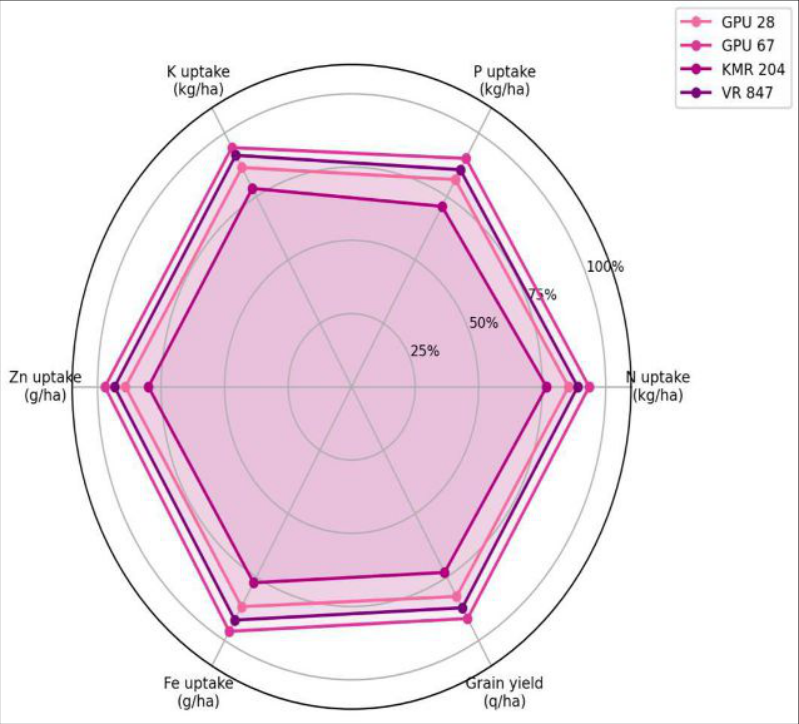 Figure 1
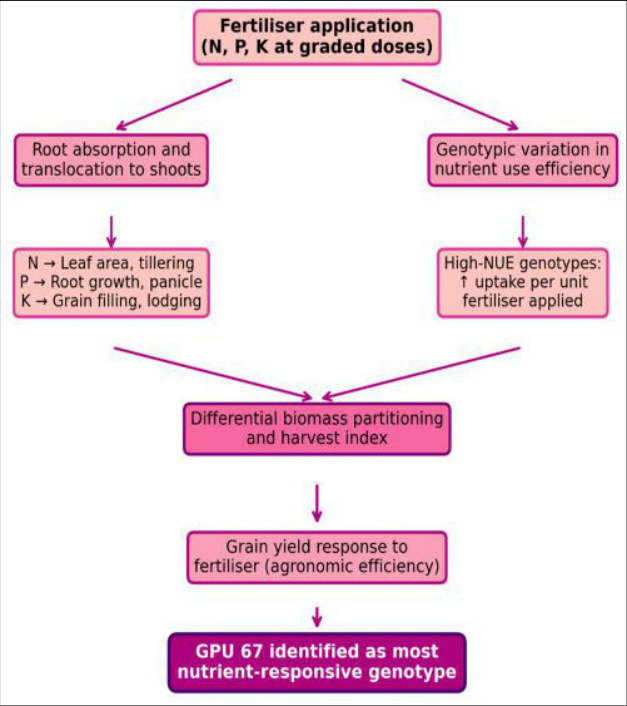 Figure 2
Introduction
When agronomists at ICAR's Bengaluru centre first tested GPU 67 against older finger millet lines, they noticed something unexpected: the genotype didn't just yield more grainit pulled markedly more nitrogen and potassium from the same soil. This observation, repeated across locations, hinted that nutrient uptake capacity itself might be a selectable trait worth targeting in breeding programmes [1] . But the idea has never been tested formally under the red laterite and alluvial conditions of Bundelkhand, where finger millet occupies roughly 15,000 hectares of kharif dryland. Finger millet (Eleusine coracana L. Gaertn.) is the third most-produced millet globally and a staple for dryland farmers across southern and central India. Its nutritional richnessparticularly its 3-4% calcium content, the highest among cerealshas brought renewed attention under the International Year of Millets campaign [2] . Yet average yields hover around 17 q/ha nationally, against a demonstrated potential exceeding 40 q/ha on research stations, and inefficient nutrient management is a major contributor to this gap [3] . The standard fertiliser recommendation (40:20:20 or 60:30:30 kg/ha N:P₂O₅:K₂O, depending on the state) treats all genotypes alike. But genotypes differ in root architecture, mycorrhizal association, and internal nutrient remobilisation efficiencydifferences that translate into varied responses to the same fertiliser dose [4] . A genotype with high nutrient uptake efficiency may extract adequate nutrition from a modest dose, while a less efficient one may need a heavier application to achieve the same yield. This research evaluated four released finger millet genotypes under graded fertiliser levels at Jhansi to (a) characterise their nutrient uptake patterns for N, P, K, Zn, and Fe, (b) quantify the agronomic and recovery efficiency of applied nutrients, and (c) identify genotype-dose combinations that maximise yield per unit nutrient invested [5] .
Material and Methods
Material and Methods
Nutrient Budget
Soil samples (0-20 cm) were collected before sowing and after harvest from each plot. Available N (alkaline permanganate), P (Olsen's method), and K (ammonium acetate) were determined. Nutrient uptake in grain and straw was calculated as concentration × dry matter yield. Agronomic efficiency (AE = kg grain increase per kg nutrient applied) and apparent recovery efficiency (RE = nutrient uptake increase per kg nutrient applied × 100) were computed for each genotypedose combination [6] . Half the N and full P and K were applied basally; remaining N was top-dressed at tillering [7] .
Material
Material
Methods
The experiment used a factorial RBD with three replications; each plot was 4 × 3 m. Plant height, tiller count, and ear-head length were recorded at harvest. Grain and straw yields were determined on a whole-plot basis. Tissue N was measured by micro-Kjeldahl, P by vanadomolybdate colorimetry, and K by flame photometry. Micronutrients (Zn, Fe) were determined by atomic absorption spectrophotometry after di-acid digestion. Data were analysed by two-way ANOVA (genotype × fertiliser) and means compared using LSD at P ≤ 0.05 [8] .
Results
Table GPU 67 outperformed all genotypes in grain yield and nutrient uptake at 100% RDF. Its N uptake (74.8 kg/ha) was 21.8% higher than KMR 204 (61.4 kg/ha). K uptake exceeded N uptake in every genotypeby 17-21% -confirming finger millet's characteristically heavy potassium demand. Fe uptake (278-347 g/ha) was roughly 1.5 times Zn uptake, reflecting the crop's high grain Fe concentration [1,3] . Agronomic efficiency declined with increasing fertiliser dose across all genotypes. GPU 67 at 50% RDF achieved AE-N of 13.8 kg grain/kg Nhigher than KMR 204 at any dose. At 150% RDF, GPU 67 yielded only 0.7 q/ha more than at 100% RDF, while KMR 204 gained a negligible 0.8 q/ha, confirming diminishing returns from over-fertilisation. Recovery efficiency of N dropped from 38.4% (F1) to 26.8% (F3) in GPU 67, indicating that surplus nitrogen was lost to leaching or denitrification [4,6] . Discussion GPU 67's superior nutrient uptake aligns with its known vigorous root system and higher mycorrhizal colonisation reported by Ramakrishnan et al. (2019) [1] . A larger root network accesses a wider soil volume, absorbing more N and K per unit timea trait that translates directly into higher tissue concentrations and ultimately greater biomass. The 21.8% N uptake advantage over KMR 204 parallels the 24.8% grain yield difference, suggesting that N acquisition is a key yield determinant in these genotypes.
The high K uptake (74-90 kg/ha) underscores a nutritional reality often overlooked in finger millet agronomy: current K recommendations (20-30 kg/ha K₂O) supply only a fraction of what the crop removes. Over repeated cycles without adequate K replenishment, soil K reserves will decline, eventually limiting yield even in genotypes with high uptake capacity [9,10] .
The diminishing AE at 150% RDF is a practical warning against blanket over-fertilisation. GPU 67 gained less than 1 q/ha from the extra 50% dose, while the additional fertiliser cost (approximately Rs 2,400/ha) far exceeded the marginal revenue. KMR 204's flat response beyond 50% RDF suggests that its yield ceiling is determined by nonnutritional factorsprobably limited tillering capacity and smaller ear-head sizethat can't be overcome by adding more fertiliser [5,11] .
Conclusion
GPU 67 emerged as the most nutrient-responsive finger millet genotype, combining the highest grain yield (34.7 q/ha), greatest N and K uptake, and best agronomic efficiency at 100% RDF. KMR 204, by contrast, showed low responsiveness beyond 50% RDF, making it better suited for low-input dryland systems. Potassium uptake exceeded nitrogen uptake in all genotypes, highlighting the need to revise K recommendations upward for high-yielding finger millet production. The sharp decline in nutrient use efficiency at 150% RDF confirms that overfertilisation wastes resources without meaningful yield gain. Genotype-specific fertiliser schedulingrather than blanket recommendationsshould be the target for extension advice in finger millet-growing regions of Bundelkhand.
Figures and tables from the paper
| Genotype | Yield (q/ha) | N uptake (kg/ha) | P uptake (kg/ha) | K uptake (kg/ha) | Zn (g/ha) | Fe (g/ha) |
|---|---|---|---|---|---|---|
| GPU 28 | 31.4 | 68.3 | 14.7 | 82.1 | 187 | 312 |
| GPU 67 | 34.7 | 74.8 | 16.2 | 89.6 | 204 | 347 |
| KMR 204 | 27.8 | 61.4 | 12.8 | 74.3 | 168 | 278 |
| VR 847 | 33.1 | 71.2 | 15.4 | 86.7 | 196 | 331 |
| SEm(±) | 1.07 | 2.3 | 0.61 | 2.8 | 7.4 | 11.6 |
| CD (P=0.05) | 3.21 | 6.9 | 1.83 | 8.4 | 22.1 | 34.7 |
Table text extracted from the original PDF; superscript letters are shown inline. The original table image is below.
View original table image
| Geno × Fert | Yield (q/ha) | AE-N | AE-P | AE-K | RE-N (%) | RE-K (%) |
|---|---|---|---|---|---|---|
| GPU 67 × F1 | 28.3 | 13.8 | 27.6 | 27.6 | 38.4 | 31.7 |
| GPU 67 × F2 | 34.7 | 12.3 | 24.6 | 24.6 | 34.1 | 28.3 |
| GPU 67 × F3 | 35.4 | 8.7 | 17.4 | 17.4 | 26.8 | 22.1 |
| KMR 204 × F1 | 24.1 | 9.2 | 18.4 | 18.4 | 27.3 | 23.4 |
| KMR 204 × F2 | 27.8 | 7.8 | 15.6 | 15.6 | 23.1 | 19.8 |
| KMR 204 × F3 | 28.6 | 5.4 | 10.8 | 10.8 | 18.7 | 16.1 |
| LSD (G×F) | 2.14 | 1.6 | 3.2 | 3.2 | 3.8 | 2.9 |
Table text extracted from the original PDF; superscript letters are shown inline. The original table image is below.
View original table image
References
18 in the original paper- Ramakrishnan M, Ceasar SA, Duraipandiyan V, Vinod KK, Kalpana K, Al-Dhabi NA, Ignacimuthu S. Tracing QTLs for leaf blast resistance and agronomic performance of finger millet. Molecular Breeding. 2019;39:132.
- Gupta SM, Arora S, Mirza N, Pande A, Lata C, Puranik S, Kumar J, Kumar A. Finger millet: a "certain" crop for an "uncertain" future and a solution to food insecurity and hidden hunger under stressful environments. Frontiers in Plant Science. 2017;8:643.
- Sakamma S, Umesh KB, Girish MR, Ravi SC, Satishkumar M, Bellundagi V. Finger millet (Eleusine coracana L. Gaertn.) production system: status, potential, constraints and implications for improving small farmer welfare. Journal of Agricultural Science. 2018;10(10):162-179.
- Moll RH, Kamprath EJ, Jackson WA. Analysis and interpretation of factors which contribute to efficiency of nitrogen utilisation. Agronomy Journal. 1982;74(3):562-564.
- Sood S, Kant L, Pattanayak A, Kumar A. Finger millet breeding: current scenario and future thrust. In: Patil JV (ed). Millets and Sorghum. Wiley-Blackwell, Oxford. 2018:351-378.
- Dobermann A. Nutrient use efficiency: measurement and management. In: Krauss A et al. (eds). Fertiliser Best Management Practices. IFA, Paris. 2007:1-28.
- BUAS. Package of Practices for Kharif Crops of Bundelkhand. University Extension Publication, Jhansi. 2020:1-68.
- Gomez KA, Gomez AA. Statistical Procedures for Agricultural Research. John Wiley, New York. 1984:1680.
- Srinivasarao C, Venkateswarlu B, Lal R, Singh AK, Kundu S, Vittal KPR, Patel JJ, Patel MM. Long-term manuring and fertiliser effects on depletion of soil organic carbon stocks under pearl millet-cluster beancastor rotation in Western India. Land Degradation and Development. 2014;25(2):173-183.
- Timsina J, Jat ML, Majumdar K. Rice-maize systems of South Asia: current status, future prospects and research priorities for nutrient management. Plant and Soil. 2010;335(1):65-82.
- Upadhyaya HD, Gowda CLL, Reddy VG. Morphological diversity in finger millet germplasm introduced from Southern and Eastern Africa. Journal of SAT Agricultural Research. 2007;3(1):1-3.
- Dida MM, Devos KM. Finger millet. In: Kole C (ed). Genome Mapping and Molecular Breeding in Plants: Cereals and Millets. Springer, Berlin. 2006:333-343.
- Ravindran G. Studies on millets: proximate composition, mineral composition, phytate, and oxalate contents. Food Chemistry. 1991;39(1):99-107.
- Seetharam A, Riley KW, Harinarayana G (eds). Small Millets in Global Agriculture. Oxford and IBH Publishing, New Delhi. 1989:1-392.
- Subba Rao A, Srivastava S. Assessment of potassium availability in vertisols under long-term fertilisation. Journal of the Indian Society of Soil Science. 2001;49(4):611-617.
- Gowda BTS, Halaswamy BH, Seetharam A, Shanthakumar G, Shankare Gowda BT. Genetic improvement of finger millet in India: current status and future prospects. Indian Journal of Genetics. 2003;63(4):313-316.
- Nath M, Goel RK, Roy AK. Nutrient uptake in finger millet as influenced by nitrogen levels. Journal of Research (BAU). 2005;17(2):201-204.
- Okalebo JR, Gathua KW, Woomer PL. Laboratory Methods of Soil and Plant Analysis: A Working Manual. 2nd ed. TSBF-CIAT, Nairobi. 2002:1-128.