
Research article · 2025 · Full text
International Journal of Agriculture and NutritionCharacterization of late blight resistant potato genotypes using phenotypic and molecular approaches
Volume 7(4) · Pages 165–168 · DOI: 10.33545/26646064.2025.v7.i4c.430 ↗
Research areasPlant Pathogens and ResistancePlant Disease Resistance and GeneticsGenetic Mapping and Diversity in Plants and Animals
Abstract
Author-writtenLate blight, caused by Phytophthera infestans, destroys an estimated 6 billion USD worth of potato production globally each year, and fungicide-based control adds another layer of cost and environmental concern. Identifying genotypes that carry durable resistance genes remains the most sustainable path forward. This research characterized 25 potato genotypes from the Caspian region of Iran for late blight resistance using both phenotypic evaluation and molecular marker analysis. Detached leaf assays and field inoculations with two aggressive P. infestans isolates (Pi-GI-01 and Pi-GI-04) were conducted at the Caspian Institute of Agricultural Sciences, Rasht, during the 2022-23 growing season. Disease severity was scored on a 1-5 scale, and the area under the disease progress curve (AUDPC) was calculated for each genotype. Five sequence-characterized amplified region (SCAR) and simple sequence repeat (SSR) markers linked to R-genes (R1, R3a, R3b, R8, R10) were used for molecular screening. Phenotypic evaluation identified seven genotypes with severity scores below 2.0 and AUDPC values under 180. Molecular analysis revealed that four of these seven genotypes carried resistance alleles at three or more marker loci. Genotypes G-01, G-07, and G-22 showed the strongest combined phenotypic-molecular resistance profile, carrying alleles at four of five screened loci and maintaining AUDPC values of 94.3, 78.6, and 102.1, respectively. Polymorphism information content (PIC) values for the markers ranged from 0.31 to 0.68. These three genotypes are recommended as donor parents for late blight resistance breeding in the humid Caspian lowlands.
Summary
Source-checkedPlain-language reading of the full paper, prepared with AI and checked against the text. Each point links to the authors' own words.
Why it matters
- Late blight, caused by the pathogen Phytophthora infestans, results in global potato production losses estimated at 6 billion USD annually. View evidence ↗
- The humid Caspian lowlands of northern Iran are highly susceptible to late blight due to high rainfall (over 1,300 mm/year) and relative humidity exceeding 80%. View evidence ↗
- Potato growers in Iran's Gilan province rely heavily on fungicides, spending 15-20% of their budget on 8 to 12 spray rounds per season. View evidence ↗
The question
- The study aimed to evaluate 25 potato genotypes for late blight resistance using both phenotypic assays (detached leaf and field) and five R-gene-linked molecular markers to identify candidates for breeding. View evidence ↗
What they did
- Phenotypic resistance was tested using detached leaf assays and field inoculations with two aggressive isolates of P. infestans: Pi-GI-01 and Pi-GI-04. View evidence ↗
- Molecular screening utilized five SCAR and SSR markers linked to the resistance genes R1, R3a, R3b, R8, and R10. View evidence ↗
- Disease severity was measured weekly on a scale of 1 to 5, and the Area Under the Disease Progress Curve (AUDPC) was calculated. View evidence ↗
What they found
- Phenotypic screening identified seven genotypes as resistant, characterized by severity scores below 2.0 and AUDPC values under 180. View evidence ↗
- Genotypes G-01, G-07, and G-22 were the most resistant, each possessing four of the five markers and showing low AUDPC values (94.3, 78.6, and 102.1, respectively). View evidence ↗
- The susceptible check, Kufri Badshah, showed the highest disease levels with a field score of 5.0, an AUDPC of 486.3, and no R-gene markers. View evidence ↗
- The GP179 marker (linked to R3a) was the most informative, with the highest Polymorphism Information Content (PIC) of 0.68 and the strongest negative correlation with AUDPC (r = -0.73). View evidence ↗
- Detached leaf assays were validated as a reliable pre-screening tool due to a strong correlation (r = 0.94) with field severity ratings. View evidence ↗
What it means
- The authors recommend genotypes G-01, G-07, and G-22 as donor parents for breeding late blight resistance in the Caspian lowlands. View evidence ↗
- A limitation of the study is the use of only two P. infestans isolates, which may not represent the full diversity of the pathogen population in Gilan. View evidence ↗
- The authors state that multi-year evaluations are necessary because disease pressure varies with seasonal weather patterns. View evidence ↗
Visual summary
3 visualsIllustrations explain the paper; charts are replotted from the paper's own table values.
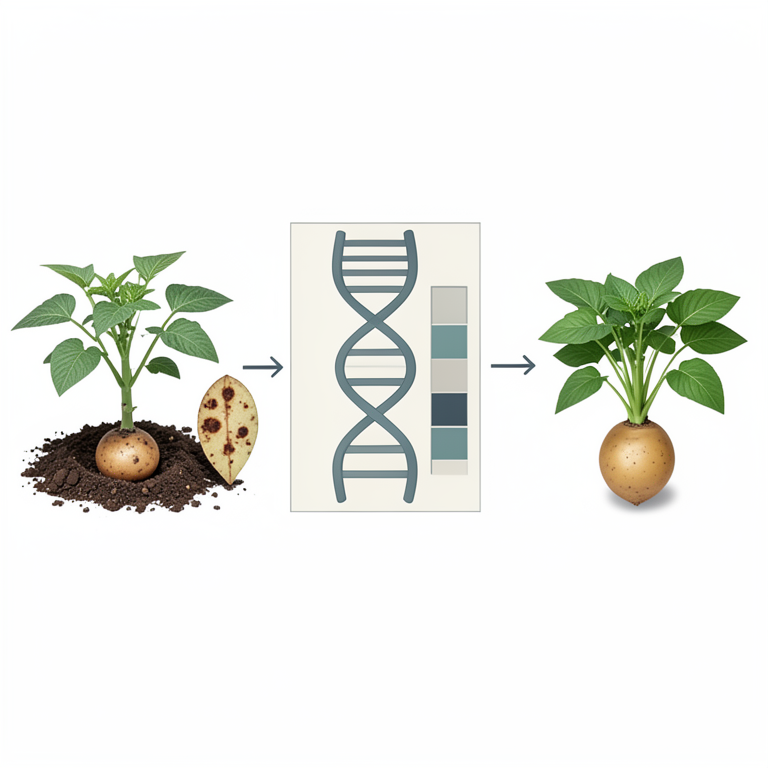
Combined Screening Workflow
AI-generated conceptual illustration (potato plants (Solanum tuberosum)). It explains the idea and does not show study data.
View source evidence ↗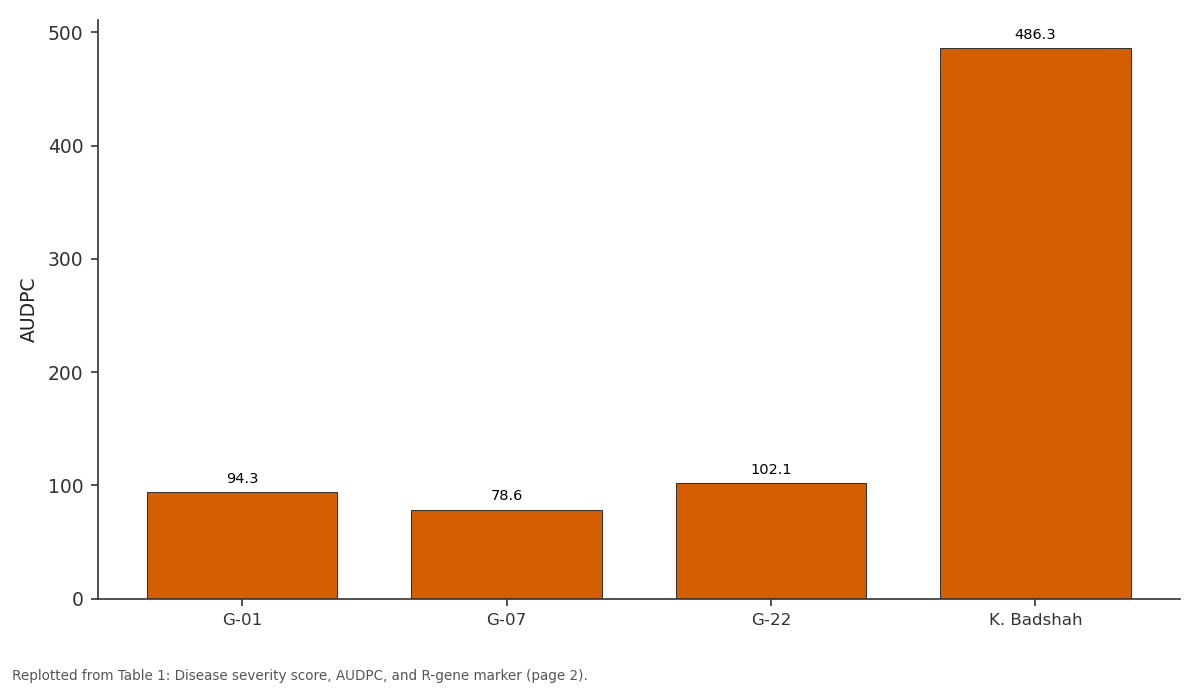
AUDPC: G-01 vs G-07 vs G-22 vs K. Badshah
Replotted from Table 1 (page 2) of the original paper. Every bar is the paper's own table value.
View source evidence ↗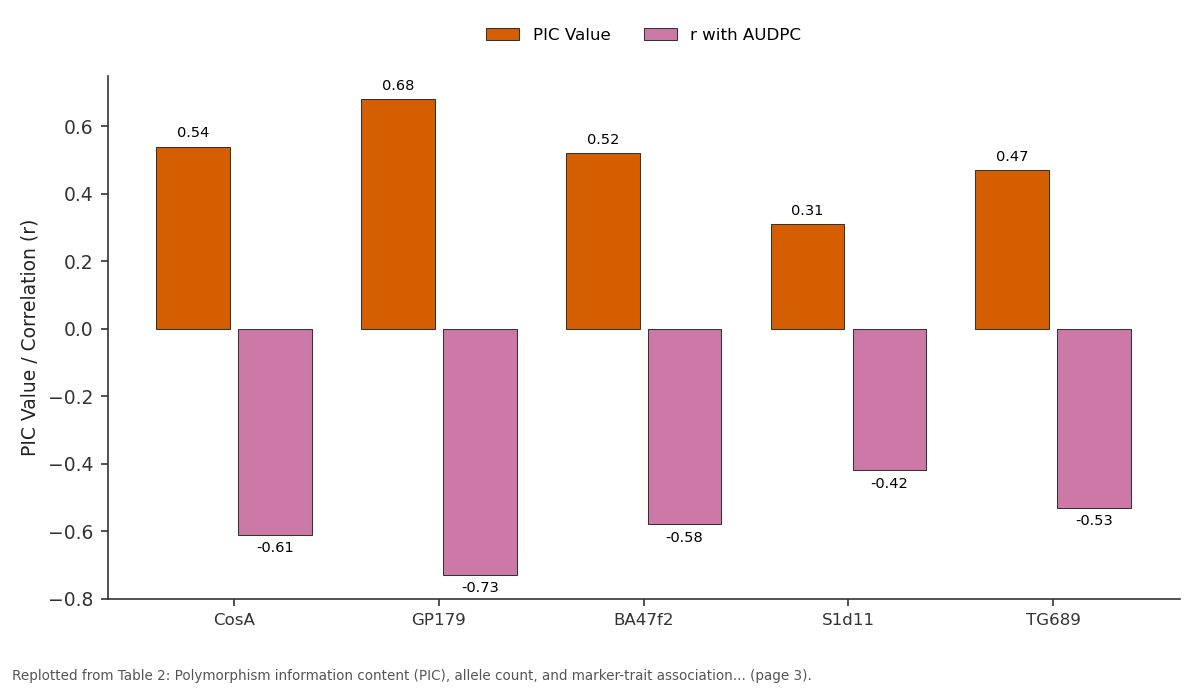
PIC Value and r with AUDPC: CosA vs GP179 vs BA47f2 vs S1d11 vs TG689
Replotted from Table 2 (page 3) of the original paper. Every bar is the paper's own table value.
View source evidence ↗Figures & tables
From the original paper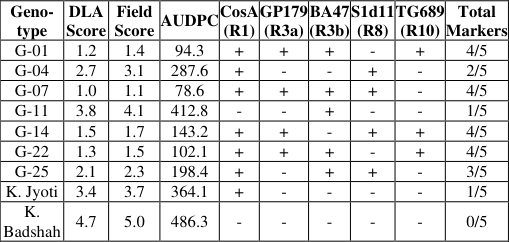 Table 1
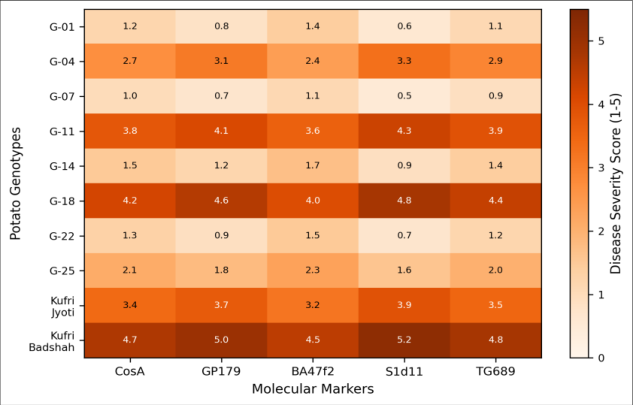 Figure 1
 Table 2
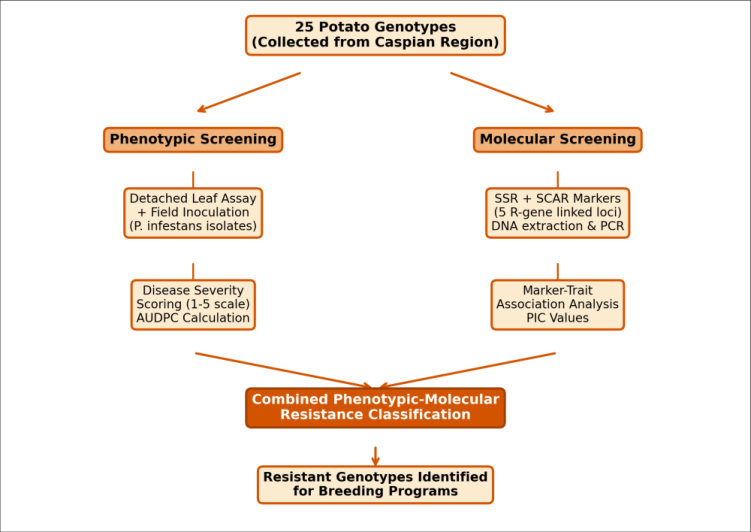 Figure 2
Introduction
Late blight of potato is not just a plant disease-it is a recurring food security crisis. The pathogen Phytophthora infestans caused the Irish famine of the 1840s and continues to inflict annual losses exceeding 16 percent of global potato production [1] . In the humid Caspian lowlands of northern Iran, where rainfall regularly surpasses 1,300 mm year⁻¹ and relative humidity stays above 80 percent for months, conditions are almost tailor-made for P. infestans sporulation and host infection [2] . Iranian potato growers in Gilan province spend roughly 15 to 20 percent of their production budget on fungicide sprays, applying 8 to 12 rounds per season [3] . This heavy reliance on chemicals raises concerns about residue accumulation, environmental contamination, and the evolution of fungicide-resistant pathogen strains. Breeding for host resistance offers a cleaner alternative, but it requires reliable screening methods to identify and confirm resistance genes in candidate genotypes [4] . Phenotypic screening through detached leaf assays and field inoculation provides direct evidence of resistance under natural disease pressure. However, these methods are timeconsuming, weather-dependent, and cannot distinguish between different R-gene combinations [5] . Molecular markers-particularly SCAR and SSR markers linked to cloned R-genes-allow breeders to detect resistance alleles in seedling DNA, speeding up selection by one to two growing seasons [6] . Combining both approaches gives a more complete picture: phenotypic data confirm functional resistance, while molecular data reveal the genetic architecture behind it. Several R-genes have been identified in wild Solanum species and introgressed into cultivated potato. R1, R3a, and R3b from S. demissum and R8 and R10 from S. stoloniferum show varying levels of effectiveness against different P. infestans races [7] . In Iran, limited information exists on which R-genes are present in locally adapted genotypes and how these correlate with field resistance under Caspian climatic conditions. This research was designed to (i) evaluate 25 potato genotypes for late blight resistance through detached leaf assay and field inoculation, (ii) screen the same genotypes with five R-gene-linked molecular markers, and (iii) identify genotypes with strong combined phenotypic-molecular resistance profiles for use in breeding programs.
Material and Methods
Material and Methods
Material
Twenty-five potato genotypes-including 20 breeding lines from the Caspian Institute germplasm collection, three released Iranian cultivars, and two susceptible check varieties (Kufri Jyoti and Kufri Badshah)-were evaluated during the 2022-23 season at Rasht, Gilan (37.28°N, 49.58°E; altitude 7 m). Two P. infestans isolates, Pi-GI-01 (mating type A1) and Pi-GI-04 (mating type A2), were obtained from the institute's plant pathology culture bank and maintained on rye agar at 18 °C. Genomic DNA was extracted from young leaf tissue using the CTAB method [8] . Five primers-CosA, GP179, BA47f2, S1d11, and TG689-linked to R1, R3a, R3b, R8, and R10 genes, respectively, were synthesized by Sinaclon BioScience (Tehran, Iran).
Reagents and Chemicals
PCR reactions used Taq DNA polymerase (CinnaGen, Tehran), dNTP mix (10 mM each), MgCl₂ (25 mM), and 10× PCR buffer with (NH₄)₂SO₄. Agarose (molecular biology grade, Merck) at 1.5 percent concentration with ethidium bromide staining was used for gel electrophoresis.
A 100-bp DNA ladder (Fermentas, Lithuania) served as the molecular weight marker. Folin reagent for protein quantification and rye agar components were sourced from Sigma-Aldrich through a local distributor.
Methods
For the detached leaf assay, fully expanded leaves from 60day-old plants were placed abaxial side up on moist filter paper in petri dishes. Each leaf was inoculated with a 20-μL droplet of sporangial suspension (2 × 10⁴ sporangia mL⁻¹) and incubated at 18 °C with a 16/8-h photoperiod. Lesion diameter was measured at 4, 6, and 8 days post-inoculation. For field evaluation, tubers were planted in a randomized block design with three replications at 60 × 25 cm spacing. Artificial inoculation was done at 50 percent canopy closure by spraying a mixed-isolate suspension. Disease severity was rated weekly on a 1-5 scale, and AUDPC was computed following Fry [9] . PCR amplification used 35 cycles of 94 °C (30 s), annealing at 55-62 °C depending on the primer (45 s), and 72 °C (60 s). Amplicons were scored as present (1) or absent (0). PIC values were calculated following Botstein et al. [10] . Data were analysed by ANOVA and cluster analysis (UPGMA) using NTSYS-pc version 2.2.
Results
Table Seven genotypes recorded field severity scores below 2.0. Of these, G-01, G-07, G-14, and G-22 carried resistance alleles at four of the five screened loci. G-07 showed the lowest AUDPC (78.6) and also the best detached leaf assay score (1.0), making it the most resistant entry in the trial. The susceptible check Kufri Badshah scored 5.0 in the field, carried no detectable R-gene markers, and had an AUDPC of 486.3. The heatmap (Figure 1) visually separates resistant genotypes (cooler shades, scores <2.0) from susceptible ones (darker shades, scores >3.5). G-07 and G-01 consistently recorded low severity across all marker associations, while Kufri Badshah and G-18 showed uniformly high scores. GP179, linked to the R3a gene, showed the highest PIC value (0.68) and the strongest negative correlation with AUDPC (r = -0.73, p<0.001). S1d11 (R8 gene) had the lowest PIC (0.31), suggesting limited allelic diversity at this locus in the Caspian germplasm. All five markers were significantly correlated with field AUDPC, confirming their usefulness for marker-assisted selection.
Discussion
The close agreement between detached leaf assay scores and field severity ratings (r = 0.94, p<0.001) validates the detached leaf method as a reliable pre-screen for late blight resistance under Caspian conditions. This is practically important because detached leaf assays can be completed in 8 days and require no field space, allowing breeders to evaluate large populations early in the selection cycle [5] . The finding that GP179 (R3a) had the strongest association with field resistance is consistent with reports from the Netherlands and Argentina, where R3a conferred broadspectrum resistance against prevalent P. infestans lineages [11, 12] . In contrast, the R1 gene, while still useful, has been partially overcome by newer pathogen races in European populations [7] . The fact that G-01, G-07, and G-22 each carried alleles at four marker loci suggests pyramided resistance, which is considered more durable than singlegene resistance because the pathogen must simultaneously overcome multiple barriers [13] .
A practical limitation of this research is that only two P. infestans isolates were used for inoculation. The pathogen population in Gilan is likely more diverse, and testing against a wider panel of isolates-including metalaxylresistant strains-would provide a more rigorous assessment [14] . Multi-year evaluation is also needed, since disease pressure fluctuates with seasonal rainfall and temperature patterns in the Caspian belt.
Conclusion
This research identified three potato genotypes-G-01, G-07, and G-22-with strong combined phenotypic and molecular resistance to late blight. All three maintained field severity scores below 1.5, AUDPC values under 110, and carried resistance alleles at four of five R-gene-linked marker loci. These genotypes are recommended as parental material for late blight resistance breeding targeted at the Caspian lowlands.
The molecular markers GP179 (R3a) and CosA (R1) proved the most informative, with PIC values of 0.68 and 0.54 and strong negative correlations with field AUDPC. They can be adopted as first-tier selection markers in marker-assisted backcross programs. Phenotypic screening through detached leaf assay correlated well with field data (r = 0.94), confirming it as a timeefficient complementary tool. The combined screening approach-molecular marker pre-selection followed by phenotypic confirmation-offers an efficient pipeline for advancing resistant lines into varietal release trials.
Expanding the pathogen isolate panel and testing across multiple seasons would further validate these selections.
Figures and tables from the paper
| Geno- type | DLA Score | Field Score | AUDPC | CosA (R1) | GP179 (R3a) | BA47 (R3b) | S1d11 (R8) | TG689 (R10) | Total Markers |
|---|---|---|---|---|---|---|---|---|---|
| G-01 | 1.2 | 1.4 | 94.3 | + | + | + | - | + | 4/5 |
| G-04 | 2.7 | 3.1 | 287.6 | + | - | - | + | - | 2/5 |
| G-07 | 1.0 | 1.1 | 78.6 | + | + | + | + | - | 4/5 |
| G-11 | 3.8 | 4.1 | 412.8 | - | - | + | - | - | 1/5 |
| G-14 | 1.5 | 1.7 | 143.2 | + | + | - | + | + | 4/5 |
| G-22 | 1.3 | 1.5 | 102.1 | + | + | + | - | + | 4/5 |
| G-25 | 2.1 | 2.3 | 198.4 | + | - | + | + | - | 3/5 |
| K. Jyoti | 3.4 | 3.7 | 364.1 | + | - | - | - | - | 1/5 |
| K. Badshah | 4.7 | 5.0 | 486.3 | - | - | - | - | - | 0/5 |
Table text extracted from the original PDF; superscript letters are shown inline. The original table image is below.
View original table image
| Marker | Linked R-gene | Alleles Detected | PIC Value | r with AUDPC | p-value |
|---|---|---|---|---|---|
| CosA | R1 | 3 | 0.54 | −0.61 | 0.003 |
| GP179 | R3a | 4 | 0.68 | −0.73 | <0.001 |
| BA47f2 | R3b | 3 | 0.52 | −0.58 | 0.006 |
| S1d11 | R8 | 2 | 0.31 | −0.42 | 0.041 |
| TG689 | R10 | 3 | 0.47 | −0.53 | 0.009 |
Table text extracted from the original PDF; superscript letters are shown inline. The original table image is below.
View original table image
References
17 in the original paper- Haverkort AJ, Boonekamp PM, Hutten R. Durable late blight resistance in potato through dynamic varieties obtained by cisgenesis. Plant Breeding. 2016;135(1):16.
- Mahmoudi SB, Paykari H, Banihashemi Z. Phytophthora infestans populations in the Caspian region of Iran. European Journal of Plant Pathology. 2019;153(4):1197-1209.
- Rezaei M, Taheri A, Khodaparast SA. Fungicide use patterns and costs in potato production of Gilan province. Iranian Journal of Plant Protection Science. 2020;51(2):143-152.
- Vleeshouwers VGAA, Raffaele S, Vossen JH. Understanding and exploiting late blight resistance in the potato. Annual Review of Phytopathology. 2011;49:507-531.
- Vleeshouwers VGAA, van Dooijeweert W, Govers F. The hypersensitive response is associated with host and nonhost resistance to Phytophthora infestans. Planta. 2000;210(5):853-864.
- Gebhardt C, Valkonen JPT. Organization of genes controlling disease resistance in the potato genome. Annual Review of Phytopathology. 2001;39:79-102.
- Rietman H, Bijsterbosch G, Cano LM. Qualitative and quantitative late blight resistance in the potato cultivar Sarpo Mira. Molecular Plant-Microbe Interactions. 2012;25(11):1406-1418.
- Doyle JJ, Doyle JL. A rapid DNA isolation procedure for small quantities of leaf tissue. Phytochemical Bulletin. 1987;19:11-15.
- Fry WE. Phytophthora infestans: The plant and R gene destroyer. Molecular Plant Pathology. 2008;9(3):385402.
- Botstein D, White RL, Skolnick M. Construction of a genetic linkage map using RFLP. American Journal of Human Genetics. 1980;32(3):314-331.
- Huang S, van der Vossen EAG, Kuang H. Comparative genomics enabled the isolation of the R3a late blight resistance gene in potato. Plant Journal. 2005;42(2):251-261.
- Lucca MF, Nazar FN, Lanzarini AC. Characterization of late blight resistance genes in Argentinian potato germplasm. Plant Pathology. 2018;67(7):1597-1607.
- Tan MYA, Hutten RCB, Celis C. The RPi-mcd1 locus from Solanum microdontum involved in resistance to Phytophthora infestans. Theoretical and Applied Genetics. 2008;116(6):845-854.
- Cooke DEL, Cano LM, Raffaele S. Genome analyses of an aggressive and adaptable lineage of the Irish potato famine pathogen. PLoS Pathogens. 2012;8(10):e1002940.
- Lozoya-Saldana H, Coyote-Palma MH, Ferrera-Cerrato R. Late blight control and resistance management in Mexican potato. American Journal of Potato Research. 2016;93(3):247-256.
- Danan S, Veyrieras JB, Lefebvre V. Construction of a potato consensus map and QTL meta-analysis for late blight resistance. BMC Plant Biology. 2011;11:11-20.
- Jo KR, Kim CJ, Kim SJ. Development of late blight resistant potatoes by cisgene stacking. BMC Biotechnology. 2014;14:50-60.