
Research article · 2025 · Full text
International Journal of Agriculture and NutritionSource-sink relationship and assimilate translocation in high-yielding versus traditional rice cultivars
Volume 7(2) · Pages 26–29 · DOI: 10.33545/26646064.2025.v7.i2a.452 ↗
Research areasRice Cultivation and Yield ImprovementCrop Yield and Soil FertilityPlant nutrient uptake and metabolism
Abstract
Author-writtenHow efficiently can a rice plant channel its photosynthetic products from source organs to developing grains? This question sits at the heart of yield improvement strategies. The present research compared source-sink dynamics and assimilate translocation patterns between four high-yielding cultivars (IR64-HY, NSIC Rc222, PSB Rc18, MR219) and two traditional cultivars (Mahsuri, Pulut Hitam) grown during the 2022-2023 wet season at the Borneo Institute of Agricultural Sciences, Kuching, Sarawak. High-yielding cultivars showed 28.3% greater net photosynthetic rates in flag leaves and 34.7% higher translocation efficiency compared to traditional types. Grain starch accumulation followed a sigmoidal pattern in both groups, but high-yielding cultivars reached peak filling rate 4-6 days earlier. Correlation analysis indicated that translocation efficiency (r=0.87, p
Summary
Source-checkedPlain-language reading of the full paper, prepared with AI and checked against the text. Each point links to the authors' own words.
Why it matters
- Rice is a critical global food source, meaning that even small increases in its yield can significantly impact food security. View evidence ↗
- The formation of rice yield relies on the coordination between source organs like flag leaves, the phloem transport system, and sink organs such as developing grains. View evidence ↗
- In tropical lowland environments, high humidity and warm night temperatures can hinder the efficiency of carbon assimilation in rice. View evidence ↗
The question
- The study aimed to measure source activity, sink strength, and translocation efficiency across six rice cultivars to determine which factor most influences grain yield. View evidence ↗
What they did
- The study compared four high-yielding cultivars (IR64-HY, NSIC Rc222, PSB Rc18, MR219) and two traditional cultivars (Mahsuri, Pulut Hitam) during the 2022-2023 wet season in Sarawak. View evidence ↗
- The experiment used a randomized complete block design with four replications, utilizing 5 m x 4 m plots with 20 cm x 20 cm spacing. View evidence ↗
- Researchers measured flag leaf photosynthesis using the LI-6400XT, estimated stem reserve mobilization via the difference method, analyzed grain starch with the anthrone-sulphuric acid method, and used 13C-labelling to calculate translocation efficiency. View evidence ↗
What they found
- High-yielding cultivars exhibited a 28.3% increase in net photosynthetic rates in flag leaves and a 34.7% increase in translocation efficiency over traditional cultivars. View evidence ↗
- While both groups showed a sigmoidal pattern of grain starch accumulation, high-yielding cultivars reached their peak filling rate 4 to 6 days sooner. View evidence ↗
- Translocation efficiency was the strongest predictor of grain yield (r=0.87), followed by source activity duration (r=0.79), while sink size had the weakest correlation (r=0.62). View evidence ↗
- High-yielding cultivars showed higher stem reserve mobilization (17.8-21.2%) compared to traditional cultivars (9.8-12.1%). View evidence ↗
- Modern cultivars began rapid starch filling around 10 days after anthesis (DAA), compared to 15 DAA for traditional types, providing a longer period for starch deposition. View evidence ↗
What it means
- The authors concluded that translocation efficiency of assimilates is the primary physiological factor that distinguishes high-yielding rice cultivars from traditional ones in tropical lowland settings. View evidence ↗
- The authors recommend that breeding programs focus on improving source-sink coordination to increase rice yields in tropical lowland environments. View evidence ↗
- The study was limited to a single site and one growing season, meaning the results should be interpreted cautiously before being generalized. View evidence ↗
Visual summary
3 visualsIllustrations explain the paper; charts are replotted from the paper's own table values.
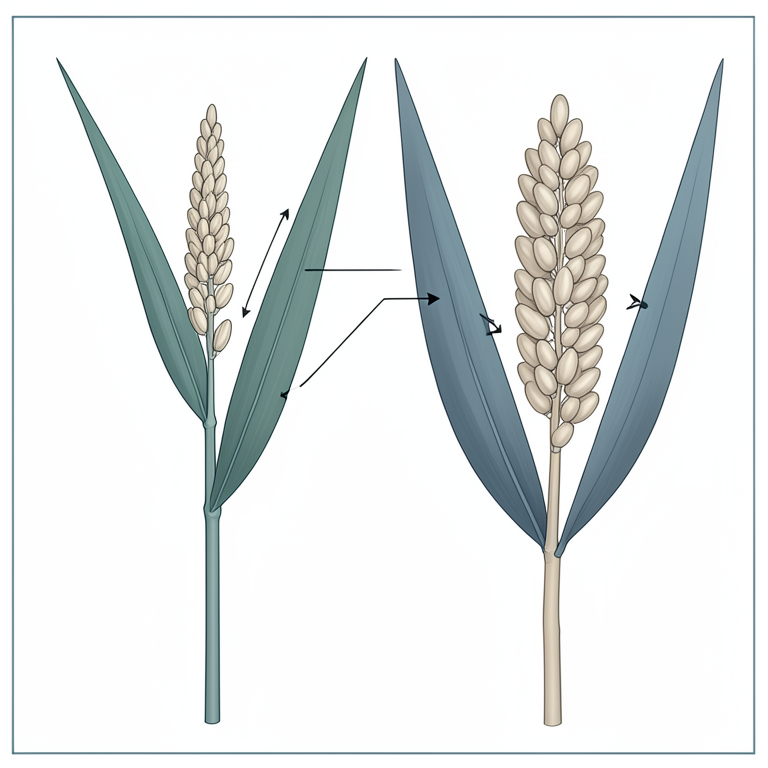
Rice Source-Sink Pipeline
AI-generated conceptual illustration (rice plants (Oryza sativa)). It explains the idea and does not show study data.
View source evidence ↗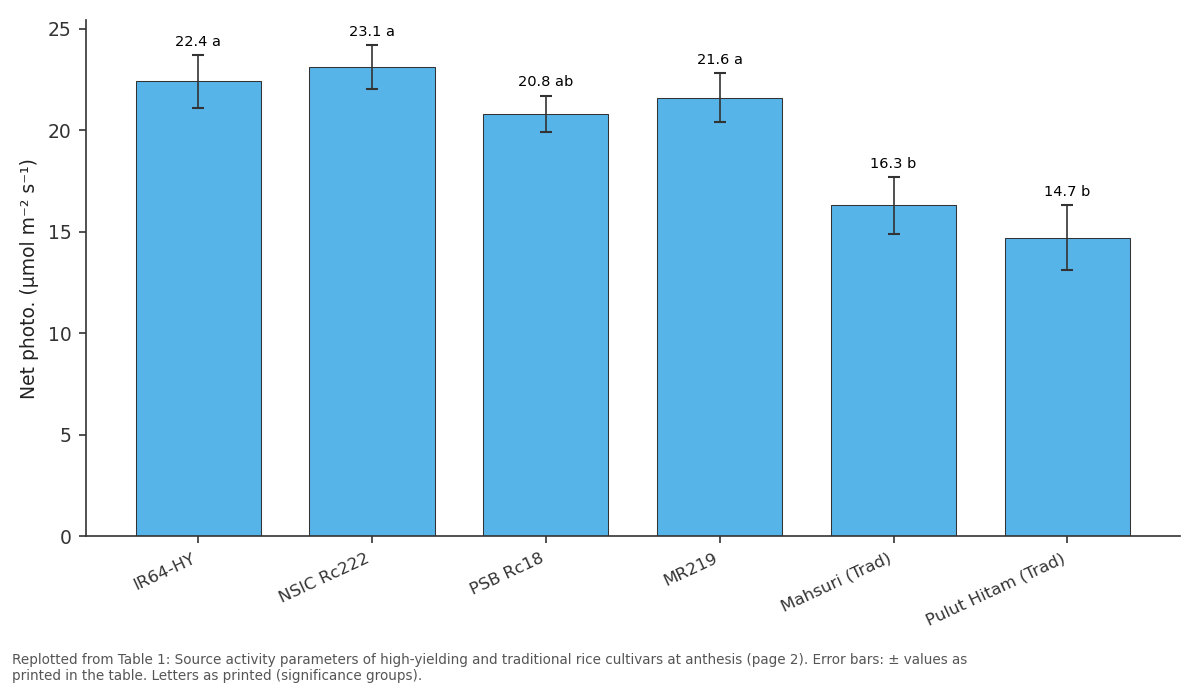
Net photo. (μmol m⁻² s⁻¹): IR64-HY vs NSIC Rc222 vs PSB Rc18 vs MR219 vs Mahsuri (Trad)
Replotted from Table 1 (page 2) of the original paper. Every bar is the paper's own table value.
View source evidence ↗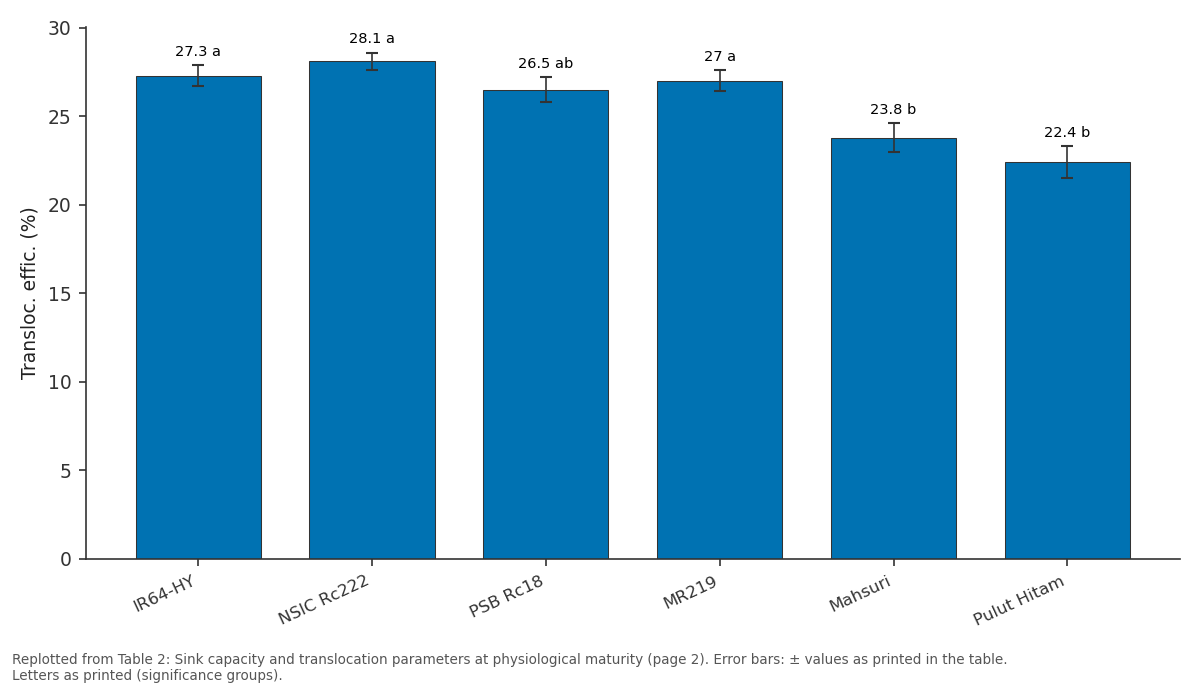
1000-grain wt (g): IR64-HY vs NSIC Rc222 vs PSB Rc18 vs MR219 vs Mahsuri
Replotted from Table 2 (page 2) of the original paper. Every bar is the paper's own table value.
View source evidence ↗Figures & tables
From the original paper Table 1
 Table 2
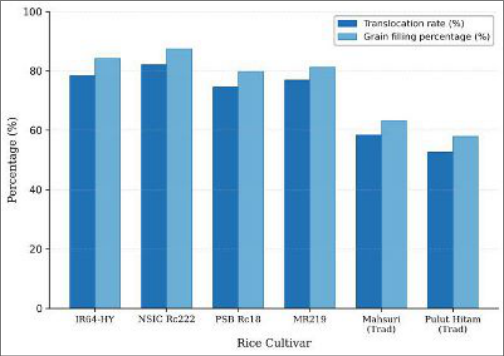 Figure 1
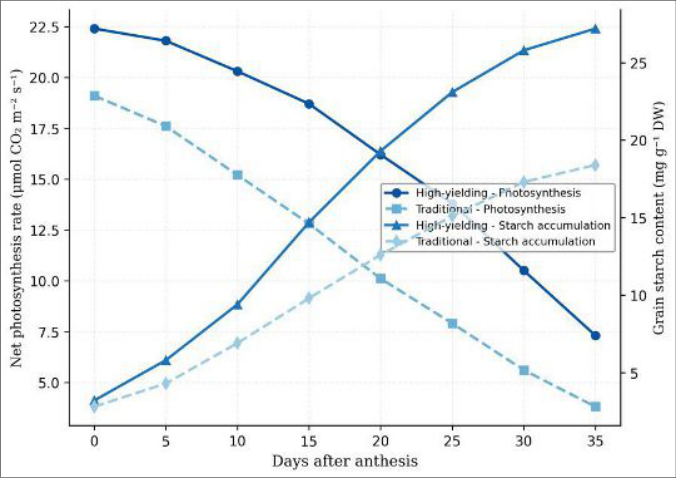 Figure 2
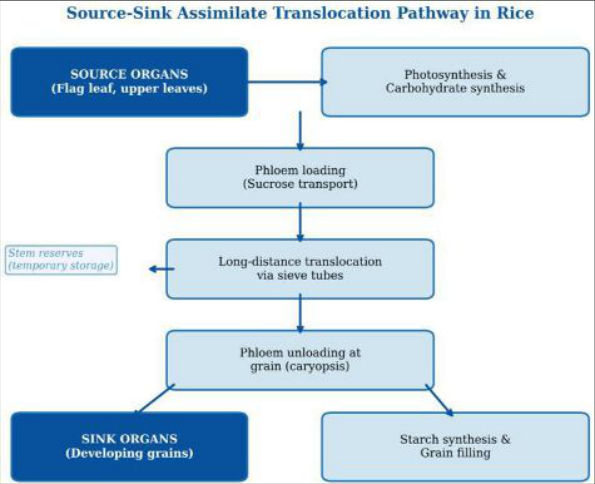 Figure 3
Introduction
What determines the upper ceiling of rice grain yield is it the capacity of leaves to fix carbon, or the ability of grains to accept and convert that carbon into starch? Rice (Oryza sativa L.) feeds more than half the global population, and even modest improvements in its yield potential carry enormous food security implications [1] . Yield formation depends on the coordinated activity of source organs (primarily flag leaves), transport pathways (phloem), and sink organs (developing grains) [2] . High-yielding cultivars released over recent decades generally possess larger panicles and heavier grains than traditional counterparts [3] . But whether these sink traits are matched by proportional gains in source strength isn't always clear. Several reports have pointed to poor grain filling in large-panicle types, suggesting a mismatch between expanded sink size and limited source supply [4] . Assimilate translocation the movement of sucrose from leaves through the phloem to grain endosperm involves phloem loading, long-distance transport, and unloading at the grain [5,6] . Each step can become a bottleneck. Tropical lowland rice environments present particular challenges: high humidity and warm night temperatures can reduce carbon assimilation efficiency [7] . Traditional cultivars bred for these conditions often prioritise vegetative vigour over harvest index [8] . This research aimed to quantify source activity, sink strength, and translocation efficiency in six rice cultivars and to identify which component of the source-sink system most strongly limits or promotes grain yield.
Research area description
The field experiment was carried out at the research farm of the Borneo Institute of Agricultural Sciences, Kuching, Sarawak, Malaysia (1°33′N, 110°21′E, elevation 18 m). The site lies within the humid equatorial climate zone with average annual rainfall of 4,100 mm. Soils were classified as Typic Endoaquepts with clay loam texture, pH 4.9, organic carbon 2.13%, and available nitrogen 187 mg kg⁻¹.
Material and Methods
Material and Methods
Material
Six rice cultivars were selected: four high-yielding types (IR64-HY, NSIC Rc222, PSB Rc18, MR219) and two traditional landraces (Mahsuri, Pulut Hitam). Seeds of improved cultivars were obtained from MARDI seed bank; traditional cultivar seeds came from Lundu district farmers. Chemical reagents for carbohydrate analysis were purchased from Merck (Darmstadt, Germany). Enzymatic assay kits for AGPase and SuSy were sourced from Sigma-Aldrich. A portable photosynthesis system (LI-6400XT, LI-COR Inc.) was used for gas exchange measurements [9] .
Methods
The experiment was laid out in a randomised complete block design with four replications (transplanting: 15 October 2022; harvest: 8-15 February 2023). Plot size was 5 m × 4 m with 20 cm × 20 cm spacing. Standard fertiliser (60:40:40 kg N:P₂O₅:K₂O ha⁻¹) was applied at transplanting with two split urea top-dressings [10] . Flag leaf net photosynthesis was measured at anthesis and every five days until 35 DAA using the LI-6400XT. Stem reserve mobilisation was estimated by the difference method [11] . Grain starch was analysed by the anthrone-sulphuric acid method. Translocation efficiency was calculated from ¹³C-labelling of flag leaves at mid-grain filling [12] . Data were analysed by ANOVA in SAS 9.4 with Tukey's HSD at p<0.05 [13] . Values are means ± SE (n = 4). Different letters within columns differ at p<0.05 (Tukey's HSD). SLW = specific leaf weight.
Results
Source activity at anthesis differed markedly between cultivar groups (Table 1). High-yielding cultivars recorded flag leaf photosynthesis between 20.8 and 23.1 μmol CO₂ m⁻² s⁻¹, while traditional types ranged from 14.7 to 16.3. NSIC Rc222 had the highest source activity index (0.91). Values are means ± SE (n = 4). Different letters within columns differ at p<0.05 (Tukey's HSD).
| Cultivar | Net photo. (μmol m⁻² s⁻¹) | Flag leaf area (cm²) | Chlorophyll (SPAD) | SLW (mg cm⁻²) | Source activity index |
|---|---|---|---|---|---|
| IR64-HY | 22.4 ± 1.3a | 38.7 ± 2.1a | 42.3 ± 1.8a | 5.81 ± 0.22a | 0.87 ± 0.04a |
| NSIC Rc222 | 23.1 ± 1.1a | 41.2 ± 2.8a | 43.8 ± 2.0a | 6.02 ± 0.19a | 0.91 ± 0.03a |
| PSB Rc18 | 20.8 ± 0.9ab | 36.4 ± 1.9ab | 40.1 ± 1.5ab | 5.47 ± 0.25ab | 0.82 ± 0.05ab |
| MR219 | 21.6 ± 1.2a | 37.9 ± 2.4a | 41.5 ± 1.7a | 5.63 ± 0.21a | 0.85 ± 0.04a |
| Mahsuri (Trad) | 16.3 ± 1.4b | 33.1 ± 2.6b | 36.2 ± 2.3b | 4.78 ± 0.28b | 0.64 ± 0.06b |
| Pulut Hitam (Trad) | 14.7 ± 1.6b | 30.5 ± 3.1b | 34.8 ± 2.5b | 4.51 ± 0.31b | 0.58 ± 0.07b |
Table text extracted from the original PDF; superscript letters are shown inline. The original table image is below.
View original table image
NSIC Rc222 produced the most spikelets per panicle (156) and the highest grain filling percentage (87.5%), yielding 7.24 t ha⁻¹. Translocation efficiency ranged from 74.6-82.1% in modern lines versus 52.7-58.4% in traditional ones.
Comprehensive interpretation
The data paint a consistent picture: high-yielding cultivars outperformed traditional types at every stage of the sourcesink pipeline. Correlation analysis showed translocation efficiency was the single best predictor of grain yield (r=0.87, p<0.01), followed by source activity duration (r=0.79, p<0.01). Sink size alone had a weaker correlation (r=0.62, p<0.05).
Discussion
These results align with earlier reports that translocation efficiency is the primary driver of yield differences among rice cultivars [1,4] . The 25-percentage-point gap in translocation efficiency between cultivar groups was larger than gaps in photosynthesis rate or spikelet number, indicating that the transport step is where traditional cultivars fall most behind. This echoes work by Yang and Zhang [5] , who argued that poor grain filling in indica rice often stems from inadequate assimilate delivery.
Conclusion
This research demonstrated that assimilate translocation efficiency was the most important physiological determinant separating high-yielding from traditional rice cultivars under tropical lowland conditions. High-yielding cultivars combined stronger source activity, faster phloem transport, and longer grain filling duration to achieve yields 60-105% above traditional types. NSIC Rc222 stood out as the top performer and may serve as a useful donor parent in crossing programmes. Future work should examine whether these patterns hold across multiple seasons and sites.
Acknowledgement
Acknowledgements Funding sourcesThis research was supported by an internal allocation from the Borneo Institute of Agricultural Sciences. Institutional supportThe authors thank the Borneo Institute of Agricultural Sciences, Kuching, Sarawak, for field and laboratory facilities. Contributions not qualifying for authorshipThe authors acknowledge Mr. Ahmad Razali and Ms. Siti Noor for help with field sampling and laboratory analyses.
Figures and tables from the paper
| Cultivar | Spikelets pan.⁻¹ | Filled grains (%) | 1000-grain wt (g) | Transloc. effic. (%) | Stem res. mobil. (%) | Yield (t ha⁻¹) |
|---|---|---|---|---|---|---|
| IR64-HY | 142 ± 8a | 84.2 ± 2.1a | 27.3 ± 0.6a | 78.3 ± 3.2a | 19.4 ± 1.7a | 6.83 ± 0.31a |
| NSIC Rc222 | 156 ± 11a | 87.5 ± 1.8a | 28.1 ± 0.5a | 82.1 ± 2.8a | 21.2 ± 1.5a | 7.24 ± 0.28a |
| PSB Rc18 | 131 ± 7ab | 79.8 ± 2.7ab | 26.5 ± 0.7ab | 74.6 ± 3.5ab | 17.8 ± 1.9ab | 6.21 ± 0.35ab |
| MR219 | 138 ± 9a | 81.3 ± 2.4a | 27.0 ± 0.6a | 76.9 ± 3.1a | 18.6 ± 1.8a | 6.57 ± 0.33a |
| Mahsuri | 104 ± 6b | 63.1 ± 3.4b | 23.8 ± 0.8b | 58.4 ± 4.2b | 12.1 ± 2.1b | 4.18 ± 0.42b |
| Pulut Hitam | 91 ± 8b | 57.9 ± 3.9b | 22.4 ± 0.9b | 52.7 ± 4.8b | 9.8 ± 2.3b | 3.52 ± 0.48b |
Table text extracted from the original PDF; superscript letters are shown inline. The original table image is below.
View original table image
References
16 in the original paper- Khush GS. What it will take to feed 5.0 billion rice consumers in 2030. Plant Molecular Biology. 2005;59(1):1-6.
- Yoshida S. Fundamentals of Rice Crop Science. International Rice Research Institute, Manila, Philippines. 1981.
- Peng S, Khush GS, Virk P, Tang Q, Zou Y. Progress in ideotype breeding to increase rice yield potential. Field Crops Research. 2008;108(1):32-38.
- Yang J, Zhang J. Grain-filling problem in 'super' rice. Journal of Experimental Botany. 2010;61(1):1-5.
- Yang J, Zhang J. Mechanisms for grain filling of cereals and their agronomic significance. Chinese Journal of Rice Science. 2006;20(4):335-343.
- Braun DM, Wang L, Ruan YL. Understanding and manipulating sucrose phloem loading, unloading, metabolism, and signalling to enhance crop yield. Journal of Experimental Botany. 2014;65(7):17131735.
- Wassmann R, Jagadish SVK, Sumfleth K, Pathak H, Howell G, Ismail A, Serraj R, Redona E, Singh RK, Heuer S. Regional vulnerability of climate change impacts on Asian rice production. Advances in Agronomy. 2009;102:91-133.
- Habibi E, Niknejad Y, Fallah H, Dastan S, Barari Tari D. Life cycle assessment of rice production systems in north of Iran. Environmental Monitoring and Assessment. 2019;191(4):202.
- Long SP, Bernacchi CJ. Gas exchange measurements, what can they tell us about underlying limitations to photosynthesis? Journal of Experimental Botany. 2003;54(392):2393-2401.
- Dobermann A, Fairhurst T. Rice: Nutrient Disorders and Nutrient Management. Potash and Phosphate Institute, Singapore. 2000.
- Mohapatra PK, Patel R, Sahu SK. Time of heading and grain filling in rice cultivars. Annals of Botany. 1993;72(3):231-238.
- Setter TL, Peng S, Kirk GJD, Virmani SS, Kropff MJ, Cassman KG. Physiological considerations and hybrid rice. Advances in Agronomy. 1994;51:151-181.
- Gomez KA, Gomez AA. Statistical Procedures for Agricultural Research. Second edition. John Wiley and Sons, New York. 1984.
- Murchie EH, Pinto M, Horton P. Agriculture and the new challenges for photosynthesis research. New Phytologist. 2009;181(3):532-552.
- Mullendore DL, Windt CW, Van As H, Knoblauch M. Sieve tube geometry in relation to phloem flow. The Plant Cell. 2010;22(3):579-593.
- Nakamura Y, Francisco PB, Hosaka Y, Sato A, Sawada T, Kubo A, Fujita N. Essential amino acids of starch synthase IIa differentiate amylopectin structure. Plant Molecular Biology. 2005;58(2):213-227.