
Research article · 2025 · Full text
International Journal of Agriculture and NutritionPhysico-chemical and sensory evaluation of fortified fruit bars from tropical fruits
Volume 7(2) · Pages 38–41 · DOI: 10.33545/26646064.2025.v7.i2a.455 ↗
Research areasFood and Agricultural SciencesFood Drying and ModelingChild Nutrition and Water Access
Abstract
Author-writtenTropical fruit bars represent an underexplored vehicle for delivering micronutrients to populations affected by hidden hunger. This research developed fortified fruit bars from mango, papaya, and a 50:50 blend, each fortified with iron (Fe-EDTA), ascorbic acid, and β-carotene. Bars were produced by hot-air drying at 60°C and assessed over 12 weeks of storage. The mango bar had the highest β-carotene retention (75.6%), while the mixed bar scored highest in sensory acceptance (7.8/9). Iron retention exceeded 95% across formulations. Vitamin C declined by 41.6% in mango bars by week 12. These results show that fortified tropical fruit bars can deliver meaningful micronutrient quantities while maintaining acceptable taste and texture for at least three months.
Summary
Source-checkedPlain-language reading of the full paper, prepared with AI and checked against the text. Each point links to the authors' own words.
Why it matters
- Micronutrient malnutrition is a significant global health issue, affecting approximately two billion people. View evidence ↗
- Fruit bars are considered an effective vehicle for fortification because they do not require cooking and are appealing to both children and adults. View evidence ↗
- Mango and papaya are suitable for these bars due to their high sugar content for preservation and their natural richness in β-carotene and ascorbic acid. View evidence ↗
The question
- The study aimed to create fortified fruit bars from mango, papaya, and a blend of both, evaluating their physical properties, taste acceptance, and nutrient stability over 12 weeks of storage. View evidence ↗
What they did
- The researchers tested three formulations (mango, papaya, and a 50:50 mix), all containing 30% sucrose, 2% pectin, and 0.5% citric acid. View evidence ↗
- The fruit pulp was spread to a thickness of 3 mm and hot-air dried at 60°C for 6 hours until the water activity was below 0.65. View evidence ↗
- Bars were sealed in metallised polyester pouches and stored in a chamber at 30 ± 2°C and 65 ± 5% relative humidity to simulate tropical retail environments. View evidence ↗
- Sensory acceptability was measured by 30 panellists using a 9-point hedonic scale. View evidence ↗
What they found
- Iron levels remained stable across all formulations (14.6–14.8 mg/100g), with retention exceeding 95%. View evidence ↗
- The mango bar exhibited the highest β-carotene retention at 75.6% and the highest initial concentration (4.82 ± 0.18 mg/100g). View evidence ↗
- The mixed fruit bar was the most preferred by consumers, achieving the highest overall sensory score of 7.8 out of 9. View evidence ↗
- The use of NaFeEDTA for iron fortification was successful as no panellists detected any metallic off-flavours. View evidence ↗
- Moisture content increased to between 17.9% and 18.7% by week 12 due to water vapor passing through the packaging. View evidence ↗
What it means
- The authors conclude that these fortified fruit bars are a practical way to deliver essential micronutrients in tropical regions. View evidence ↗
- Because of the significant loss of Vitamin C, the authors recommend over-fortifying the bars during production to ensure adequate levels remain. View evidence ↗
- The authors suggest that using aluminium foil laminate packaging could further extend the shelf life of the bars. View evidence ↗
Visual summary
3 visualsIllustrations explain the paper; charts are replotted from the paper's own table values.
Fortified Fruit Bar Concept
AI-generated conceptual illustration (Fortified fruit bars made from mango and papaya). It explains the idea and does not show study data.
View source evidence ↗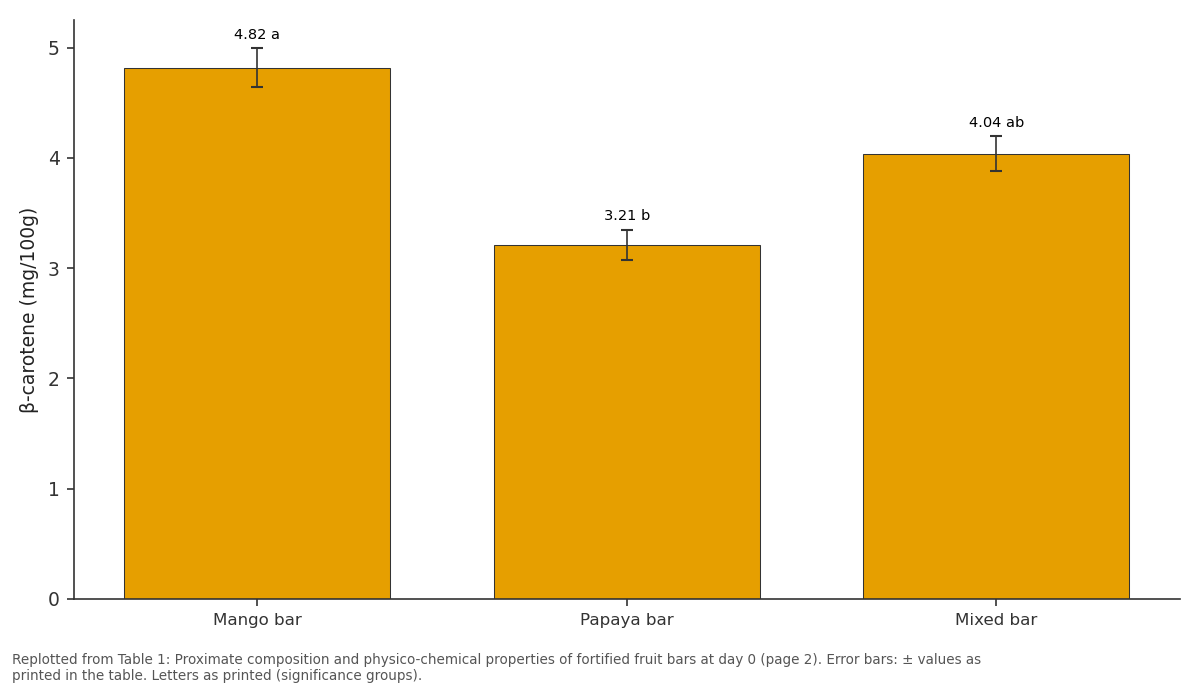
β-carotene (mg/100g): Mango bar vs Papaya bar vs Mixed bar
Replotted from Table 1 (page 2) of the original paper. Every bar is the paper's own table value.
View source evidence ↗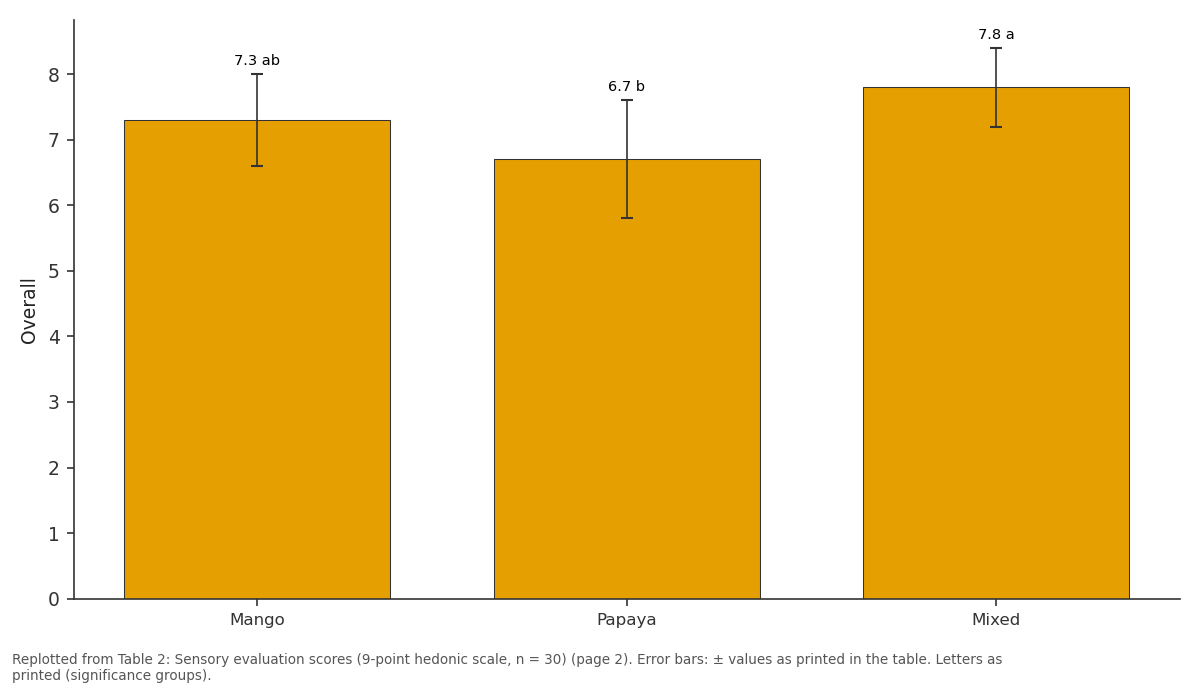
Overall: Mango vs Papaya vs Mixed
Replotted from Table 2 (page 2) of the original paper. Every bar is the paper's own table value.
View source evidence ↗Figures & tables
From the original paper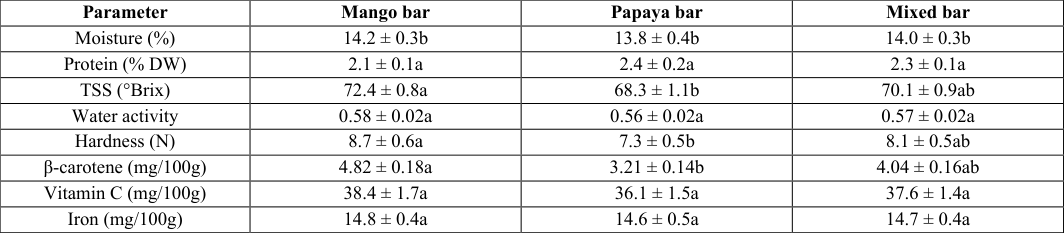 Table 1
 Table 2
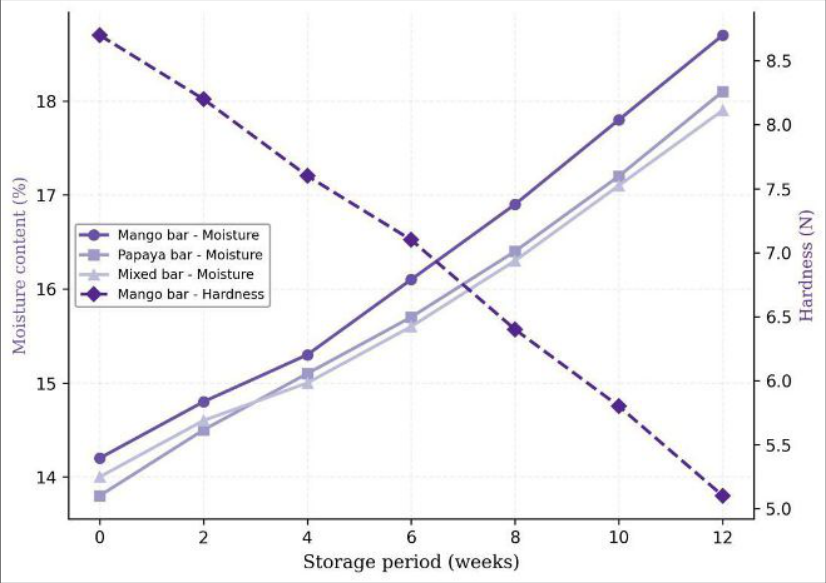 Figure 1
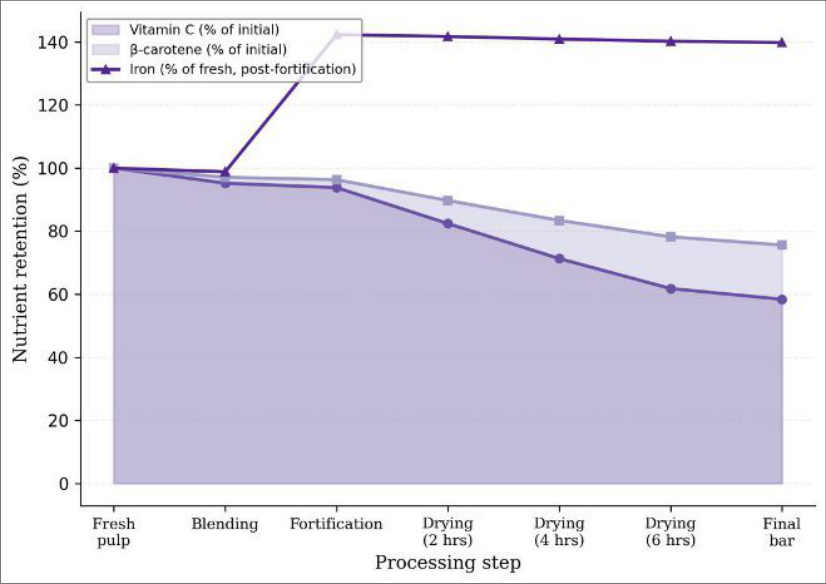 Figure 2
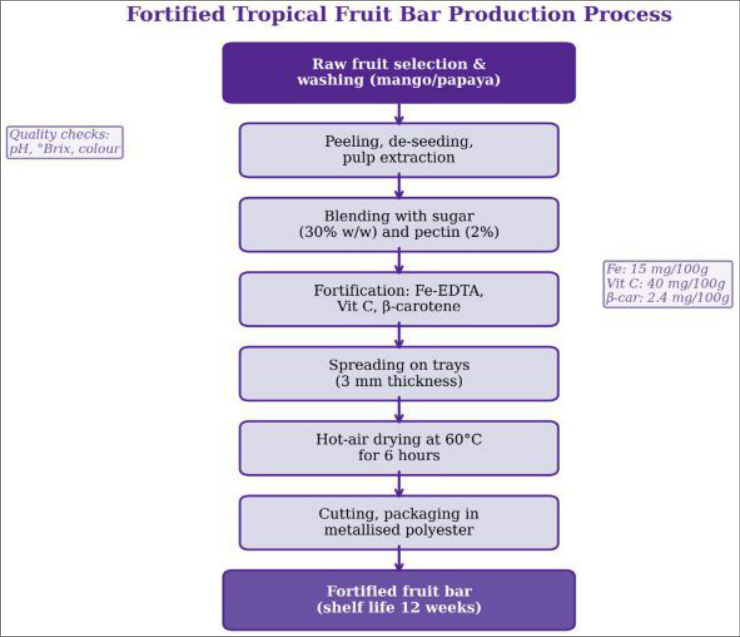 Figure 3
Introduction
The practice of drying fruits dates back thousands of years sun-dried figs appear in Mesopotamian records from 3000 BCE [1]. What early processors couldn't do was enrich their products with specific vitamins and minerals. That capability has opened a pathway for tackling micronutrient malnutrition, which affects an estimated two billion people [2]. Fruit bars are attractive for fortification because they require no cooking and appeal to children and adults alike [3].
Tropical fruits such as mango and papaya are especially suitable: they are rich in β-carotene, contain moderate ascorbic acid, and have high sugar contents that aid preservation [4]. Fortifying with bioavailable iron alongside vitamin C and β-carotene could address multiple deficiency gaps simultaneously [5]. However, iron salts can introduce off-flavours and catalyse vitamin oxidation [6], while drying and storage progressively erode nutritional value [7, 8]. This research aimed to develop fortified bars from mango, papaya, and their blend, and to evaluate physico-chemical properties, sensory acceptability, and nutrient stability during 12 weeks of ambient storage.
Research facility and storage conditions All work was conducted at the food technology pilot plant of Lower Saxony Agricultural University, Göttingen, Germany. Finished bars were stored at 30 ± 2°C and 65 ± 5% RH in a controlled-environment chamber simulating tropical retail conditions, sealed in metallised polyester pouches (OTR < 1 cc m⁻² day⁻¹). Samples were withdrawn at two-week intervals over 12 weeks [8].
Material And Methods
Material Ripe mangoes (cv. Tommy Atkins) and papayas (cv. Solo) were purchased locally. Fortification agents: NaFeEDTA (13% Fe, Akzo Nobel), L-ascorbic acid (Merck), and β- carotene powder (10% CWS/S, BASF).
Sucrose, citric acid, and pectin were from Carl Roth GmbH [9, 10].
Methods
Three formulations were prepared: mango, papaya, and 50:50 mixed bars, each with 30% sucrose, 2% pectin, and 0.5% citric acid. Fortification targeted 15 mg iron, 40 mg vitamin C, https://www.agriculturejournal.net HPLC; iron by flame AAS [13, 14]. Sensory evaluation by 30 panellists on a 9-point hedonic scale [15]. ANOVA with Tukey's HSD at p<0.05 in SPSS 28. and 2.4 mg β-carotene per 100 g of finished bar [2].
Pulp was blended, spread at 3 mm thickness, and dried at 60°C for 6 hours until aw < 0.65 [11]. Proximate composition by AOAC
Methods
[12]; vitamin C by DCPIP titration; β-carotene by
Results
Table 1: Proximate composition and physico-chemical properties of fortified fruit bars at day 0 Parameter Mango bar Papaya bar Mixed bar Moisture (%) 14.2 ± 0.3b 13.8 ± 0.4b 14.0 ± 0.3b Protein (% DW) 2.1 ± 0.1a 2.4 ± 0.2a 2.3 ± 0.1a TSS (°Brix) 72.4 ± 0.8a 68.3 ± 1.1b 70.1 ± 0.9ab Water activity 0.58 ± 0.02a 0.56 ± 0.02a 0.57 ± 0.02a Hardness (N) 8.7 ± 0.6a 7.3 ± 0.5b 8.1 ± 0.5ab β-carotene (mg/100g) 4.82 ± 0.18a 3.21 ± 0.14b 4.04 ± 0.16ab Vitamin C (mg/100g) 38.4 ± 1.7a 36.1 ± 1.5a 37.6 ± 1.4a Iron (mg/100g) 14.8 ± 0.4a 14.6 ± 0.5a 14.7 ± 0.4a Different letters within rows indicate differences at p < 0.05 Table 2: Sensory evaluation scores (9-point hedonic scale, n = 30) Attribute Mango Papaya Mixed LSD Colour 7.8 ± 0.6a 6.4 ± 1.0b 7.3 ± 0.8a 0.68 Flavour 7.2 ± 0.9a 6.8 ± 1.1ab 7.7 ± 0.7a 0.81 Texture 7.1 ± 0.8a 6.6 ± 0.9a 7.4 ± 0.8a 0.76 Overall 7.3 ± 0.7ab 6.7 ± 0.9b 7.8 ± 0.6a 0.63 No panellist detected metallic taste from iron fortification, confirming NaFeEDTA suitability Fig 1: Moisture content and hardness changes during 12 weeks of storage at 30°C https://www.agriculturejournal.net Fig 2: Nutrient retention (% of initial) during processing steps for the mango bar consistent with hot-air-dried products at similar temperatures [7], and over-fortifying at production could compensate for storage losses [2].
| Attribute | Mango | Papaya | Mixed | LSD |
|---|---|---|---|---|
| Colour | 7.8 ± 0.6a | 6.4 ± 1.0b | 7.3 ± 0.8a | 0.68 |
| Flavour | 7.2 ± 0.9a | 6.8 ± 1.1ab | 7.7 ± 0.7a | 0.81 |
| Texture | 7.1 ± 0.8a | 6.6 ± 0.9a | 7.4 ± 0.8a | 0.76 |
| Overall | 7.3 ± 0.7ab | 6.7 ± 0.9b | 7.8 ± 0.6a | 0.63 |
Table text extracted from the original PDF; superscript letters are shown inline. The original table image is below.
View original table image
| Parameter | Mango bar | Papaya bar | Mixed bar |
|---|---|---|---|
| Moisture (%) | 14.2 ± 0.3b | 13.8 ± 0.4b | 14.0 ± 0.3b |
| Protein (% DW) | 2.1 ± 0.1a | 2.4 ± 0.2a | 2.3 ± 0.1a |
| TSS (°Brix) | 72.4 ± 0.8a | 68.3 ± 1.1b | 70.1 ± 0.9ab |
| Water activity | 0.58 ± 0.02a | 0.56 ± 0.02a | 0.57 ± 0.02a |
| Hardness (N) | 8.7 ± 0.6a | 7.3 ± 0.5b | 8.1 ± 0.5ab |
| β-carotene (mg/100g) | 4.82 ± 0.18a | 3.21 ± 0.14b | 4.04 ± 0.16ab |
| Vitamin C (mg/100g) | 38.4 ± 1.7a | 36.1 ± 1.5a | 37.6 ± 1.4a |
| Iron (mg/100g) | 14.8 ± 0.4a | 14.6 ± 0.5a | 14.7 ± 0.4a |
Table text extracted from the original PDF; superscript letters are shown inline. The original table image is below.
View original table image
Conclusion
Fortified fruit bars delivered iron (14.6-14.8 mg/100g), vitamin C (36-38 mg/100g), and β-carotene (3.2-4.8 mg/100g) in a shelf-stable, acceptable format. The mixed Fig 3: Process flow for fortified tropical fruit bar production
Discussion
Water activity values below 0.60 confirm adequate drying for microbial safety [11]. The gradual moisture rise to 17.9- 18.7% by week 12 reflects vapour transmission through packaging; aluminium foil laminate could extend shelf life further [8]. The mixed bar's flavour advantage aligns with findings that blending tropical fruits improves taste complexity [3]. Vitamin C losses of ~42% over 12 weeks are https://www.agriculturejournal.net 17.
Vega-Gálvez A, Ah-Hen K, Chacana M, et al. Effect of temperature and air velocity on drying kinetics of apple slices. Food Chemistry. 2012;132(1):51-59. 18. Azeredo HMC, Brito ES, Moreira GEG, Farias VL, Bruno LM.
Physicochemical properties of mango leathers. International Journal of Food Science and Technology. 2006;41(6):635-638. 19. Raab C, Oehler N. Making dried fruit leather.
Oregon State University Extension Service. 2000. 20. Rao PVK, Das M, Das SK. Thermophysical properties of granular jaggery. International Journal of Food Properties. 2009;12(4):876-893. 21.
Ruiz-Rodriguez BM, Morales P, et al. Valorization of wild strawberry-tree fruits. Food Research International. 2011;44(5):1244-1253. bar achieved the highest consumer acceptance (7.8/9) and retained adequate nutrients over 12 weeks. Vitamin C was less stable (~42% loss), suggesting over-fortification at production is warranted.
These bars offer a practical micronutrient delivery vehicle for tropical regions.
Acknowledgements
Funding sources This research was supported by departmental funds of the Lower Saxony Agricultural University. Institutional support The author thanks the Department of Agricultural Processing for pilot plant facilities. Contributions not qualifying for authorship Thanks to Ms. Lena Fischer and Mr.
Tobias Braun for technical assistance.
References
17 in the original paper- Katz SH, Weaver WW. Encyclopedia of Food and Culture. Volume
- Scribner's Sons, New York. 2003.
- WHO. Nutritional Anaemias: Tools for Effective Prevention and Control. WHO, Geneva. 2017.
- Kumar R, Patil RT, Mondal G. Development and evaluation of blended papaya-guava leather. Beverage and Food World. 2010;37(1):36-38.
- Tharanathan RN, Yashoda HM, Prabha TN. Mango - An overview. Food Reviews International. 2006;22(2):95-123.
- Hurrell RF, Reddy MB, Burri J, Cook JD. An evaluation of EDTA compounds for iron fortification. British Journal of Nutrition. 2000;84(6):903-910.
- Bothwell TH, MacPhail AP. The potential role of NaFeEDTA as an iron fortificant. International Journal for Vitamin and Nutrition Research. 2004;74(6):421- 434.
- Santos PHS, Silva MA. Retention of vitamin C in drying of fruits and vegetables. Drying Technology. 2008;26(12):1421-1437.
- Robertson GL. Food Packaging: Principles and Practice. Third edition. CRC Press, Boca Raton. 2013.
- AOAC. Official Methods of Analysis. 20th edition. AOAC, Rockville, MD. 2016.
- Ranganna S. Handbook of Analysis for Fruit and Vegetable Products. Tata McGraw-Hill, New Delhi. 2008.
- Chirife J, Fontana AJ. Water activity of common food materials. In: Water Activity in Foods. Blackwell, Ames, IA. 2007;pp.407-420.
- Horwitz W, Latimer GW. Official Methods of Analysis. 18th ed. AOAC International, Gaithersburg. 2005.
- Rodriguez-Amaya DB, Kimura M. HarvestPlus Handbook for Carotenoid Analysis. IFPRI, Washington, DC. 2004.
- Bourne MC. Food Texture and Viscosity. Second edition. Academic Press, San Diego. 2002.
- Lawless HT, Heymann H. Sensory Evaluation of Food. Second edition. Springer, New York. 2010.
- Sun-Waterhouse D. Development of fruit-based functional foods targeting health and wellness. International Journal of Food Science and Technology. 2011;46(5):899-920.