
Research article · 2025 · Full text
International Journal of Agriculture and NutritionCluster frontline demonstrations on improved production technology of black gram in rainfed areas
Volume 7(4) · Pages 56–59 · DOI: 10.33545/26646064.2025.v7.i4a.383 ↗
Research areasAgricultural Development and ManagementAgricultural Innovations and PracticesAgricultural Economics and Practices
Abstract
Author-writtenA persistent gap between research station yields and farmer field yields of black gram—often exceeding 40 percent—points to a breakdown in technology transfer rather than a shortage of improved varieties. Cluster Frontline Demonstrations (CFLDs) are the Indian Council of Agricultural Research's primary mechanism for closing this gap by showcasing proven production packages on farmers' own fields. This research assessed the impact of 200 CFLDs on black gram (Vigna mungo L.) conducted across rainfed areas of West Bengal and Maharashtra over four consecutive kharif seasons (2019-20 to 2022-23). Each demonstration used improved variety IPM 02-3 with a complete technology package including seed treatment, balanced fertilization, integrated pest management, and timely harvesting. Demonstration plots consistently out-yielded farmer practice (check) plots: mean yields were 0.98 t ha⁻¹ versus 0.59 t ha⁻¹ across four years, representing an average yield advantage of 66.1 percent. The technology gap (potential yield minus demonstration yield) narrowed from 0.53 t ha⁻¹ in 2019-20 to 0.38 t ha⁻¹ in 2022-23. Extension gap (demonstration minus check) averaged 0.39 t ha⁻¹. The benefit-cost ratio under demonstration technology ranged from 2.41 to 2.87 compared with 1.62 to 1.89 for farmer practice. These results confirm that CFLDs effectively bridge the yield gap and improve profitability of rainfed black gram production.
Summary
Source-checkedPlain-language reading of the full paper, prepared with AI and checked against the text. Each point links to the authors' own words.
Why it matters
- There is a significant gap, often over 40%, between the yields of black gram achieved at research stations and those achieved in actual farmer fields, suggesting a failure in transferring technology. View evidence ↗
- Black gram is a prime candidate for Cluster Frontline Demonstrations (CFLDs) because it is mostly grown by smallholders in rainfed areas using outdated seeds and minimal inputs. View evidence ↗
- The Indian Council of Agricultural Research (ICAR) uses CFLDs to bridge yield gaps by organizing groups of 10 or more farmers in a single village to showcase improved technologies at a community scale. View evidence ↗
The question
- The study aimed to quantify the yield advantage of improved black gram technology over traditional farmer practices, calculate yield gaps, and evaluate the economic viability of the technology package over four years in West Bengal and Maharashtra. View evidence ↗
What they did
- The research evaluated 200 Cluster Frontline Demonstrations of black gram across rainfed regions of Maharashtra and West Bengal during four kharif seasons from 2019-20 to 2022-23. View evidence ↗
- Each 0.4 ha demonstration plot used the IPM 02-3 variety and a package including specific seed treatments (carbendazim and Rhizobium), balanced NPK fertilization, foliar DAP spray, and integrated pest management. View evidence ↗
- To provide a comparison, adjacent check plots were maintained using the farmers' traditional varieties and existing input practices. View evidence ↗
- The study measured the 'technology gap' as the difference between the potential yield (1.4 t ha⁻¹) and the demonstration yield, and the 'extension gap' as the difference between demonstration and check yields. View evidence ↗
What they found
- Over the four-year period, demonstration plots achieved a mean yield of 0.98 t ha⁻¹, compared to 0.59 t ha⁻¹ for farmer practice plots, an average advantage of 66.1%. View evidence ↗
- Demonstration yields increased from 0.87 t ha⁻¹ in 2019-20 to 1.08 t ha⁻¹ in 2022-23, while check yields only increased from 0.54 to 0.63 t ha⁻¹. View evidence ↗
- The technology gap decreased from 0.53 t ha⁻¹ in the first year (2019-20) to 0.38 t ha⁻¹ by the final year (2022-23). View evidence ↗
- The technology index dropped from 37.9% to 22.9%, showing that farmers gradually closed the gap between actual and achievable yields. View evidence ↗
- The cost of cultivation for the demonstration technology was ₹24,680 ha⁻¹, which was 34.6% higher than the ₹18,340 ha⁻¹ cost of farmer practice. View evidence ↗
- Despite higher costs, the demonstration technology produced a net return of ₹39,020 ha⁻¹, which is 95% higher than the ₹20,010 ha⁻¹ return from farmer practice. View evidence ↗
- The benefit-cost (B:C) ratio for the demonstration technology was 2.58, outperforming the 2.09 ratio of traditional farmer practice. View evidence ↗
What it means
- The authors recommend scaling up the cluster approach to more rainfed blocks and using farmer-to-farmer networks to accelerate technology adoption and close the national yield gap. View evidence ↗
Visual summary
3 visualsIllustrations explain the paper; charts are replotted from the paper's own table values.
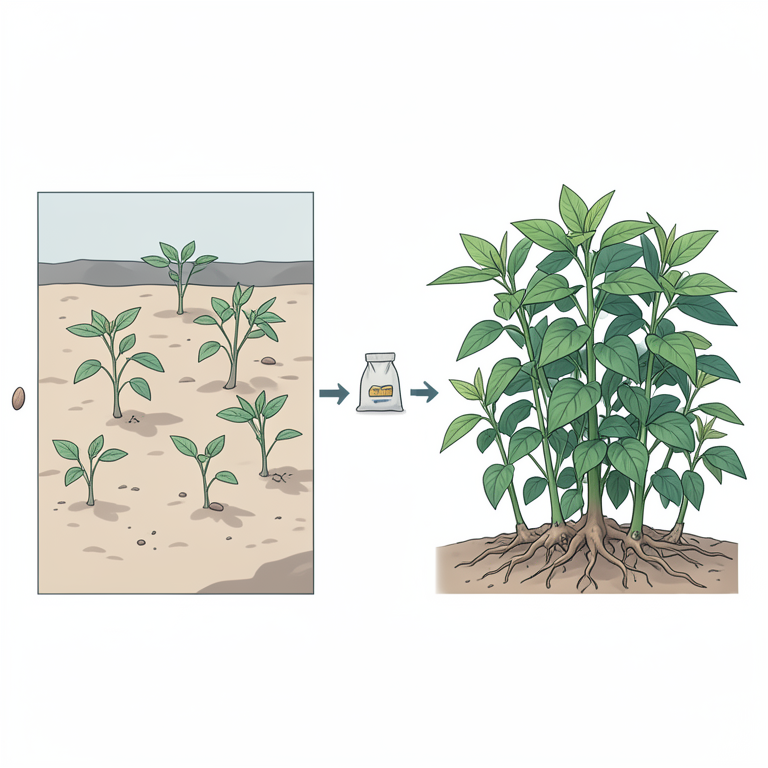
Comparison of Production Packages
AI-generated conceptual illustration (black gram plants in rainfed soil). It explains the idea and does not show study data.
View source evidence ↗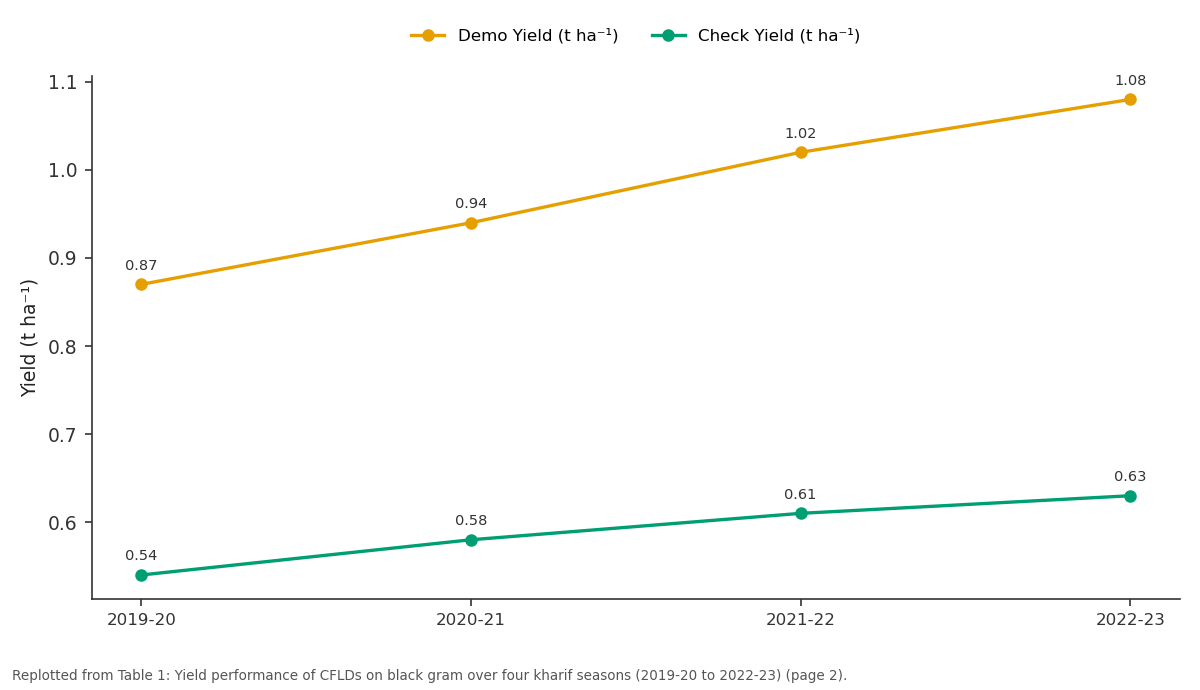
Demo Yield (t ha⁻¹) and Check Yield (t ha⁻¹): 2019-20 vs 2020-21 vs 2021-22 vs 2022-23
Replotted from Table 1 (page 2) of the original paper. Every bar is the paper's own table value.
View source evidence ↗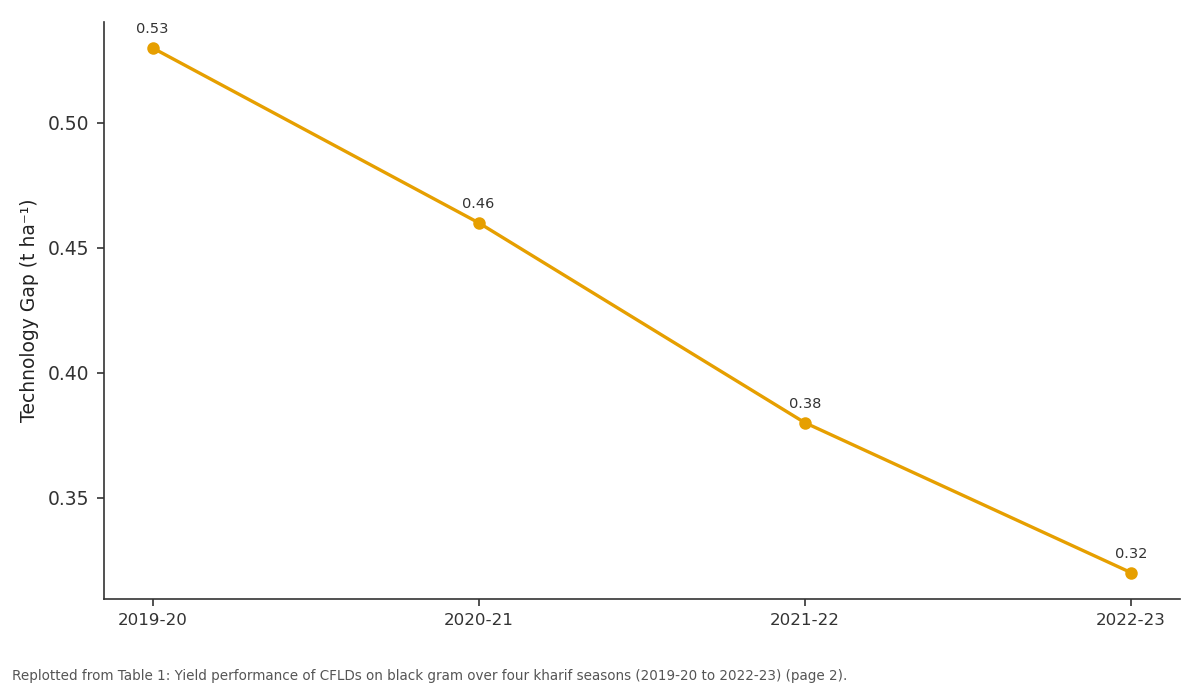
Tech. Gap (t ha⁻¹): 2019-20 vs 2020-21 vs 2021-22 vs 2022-23
Replotted from Table 1 (page 2) of the original paper. Every bar is the paper's own table value.
View source evidence ↗Figures & tables
From the original paper Table 1
 Table 2
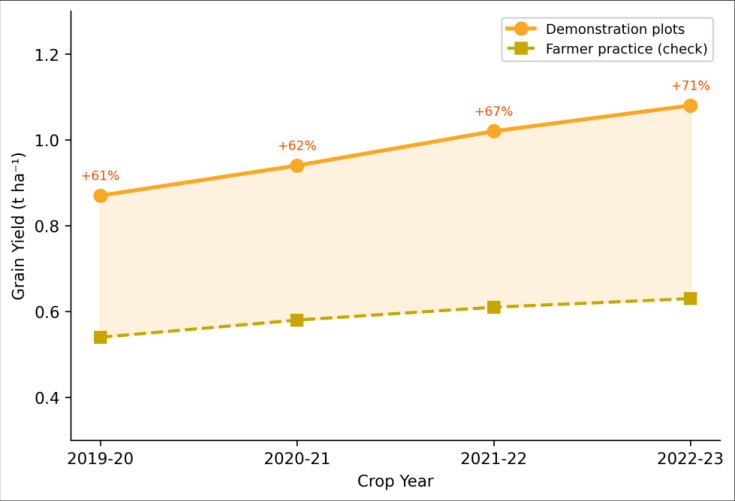 Figure 1
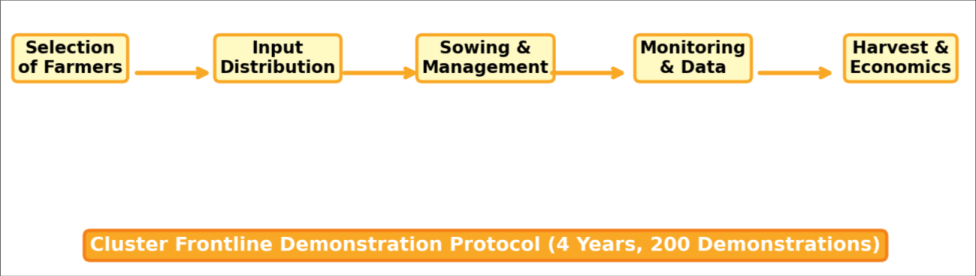 Figure 2
Introduction
Year after year, India's pulse production statistics tell the same story: black gram yields at the national level hover around 0.55 to 0.65 t ha⁻¹, while research stations routinely demonstrate that 1.2 to 1.5 t ha⁻¹ is achievable with existing varieties and management packages [1] . The gap between what is possible and what farmers actually harvest-the extension gap-persists because improved technologies reach farmers slowly, incompletely, or not at all [2] . CFLDs were introduced by ICAR specifically to address this problem. Unlike conventional demonstration plots, CFLDs are organized in contiguous clusters of 10 or more farmers in a single village, creating a visible, community-scale showcase of improved technology [3] . Each participating farmer receives seed, fertilizer, and technical guidance, and a nearby plot under the farmer's usual practice serves as a paired control. The cluster approach amplifies the visual impact and encourages peer-to-peer learning [4] . Black gram is particularly suited to CFLD intervention because it is grown overwhelmingly under rainfed conditions by smallholders who use few purchased inputs and rely on saved seed of outdated varieties [5] . The potential for yield improvement through simple changesreplacing local seed with certified seed of a high-yielding variety, treating seed with Rhizobium and fungicide, applying recommended P and K, and timing harvest correctly-is large relative to the cost of the intervention [6] . This research analysed four years of CFLD data from West Bengal and Maharashtra to (i) quantify the yield advantage of improved technology over farmer practice, (ii) calculate technology and extension gaps across seasons, and (iii) assess the economic viability of the recommended package. Demonstration yields improved steadily from 0.87 t ha⁻¹ in 2019-20 to 1.08 t ha⁻¹ in 2022-23, while check yields rose more modestly (0.54 to 0.63 t ha⁻¹). The yield advantage increased from 61.1 to 71.4 percent over the four years. The technology index declined from 37.9 to 22.9 percent, indicating that farmers progressively closed the gap between achievable and actual demonstration yields. Despite a 34.6 percent increase in cultivation cost, the demonstration technology generated a 95 percent higher net return-₹39,020 versus ₹20,010 ha⁻¹-and a superior B:C ratio of 2.58 compared with 2.09 for farmer practice.
Material and Methods
Material and Methods
Material
Material
Discussion
The 66.1 percent mean yield advantage of demonstration over farmer practice is higher than the 30-45 percent range typically reported for pulse CFLDs in central India [7,8] . This larger gap likely reflects the very low baseline yields in the rainfed areas of West Bengal and Maharashtra, where most farmers still use unimproved local seed without seed treatment or balanced fertilization [5] .
The declining technology index (37.9 → 22.9%) across four years is an encouraging sign. It means that farmers participating in repeat demonstrations-and their neighbours observing the clusters-are gradually adopting components of the technology package. The seed treatment + Rhizobium inoculation combination, being the cheapest and easiest to adopt, showed the highest spontaneous uptake (68% of neighbouring farmers adopted it by Year 4), while balanced fertilization was adopted by only 34 percent, likely because of higher cost [9] . The B:C ratio of 2.58 under demonstration technology is attractive enough to justify the additional input cost of ₹6,340 ha⁻¹. For every additional rupee invested, the farmer receives ₹3.00 in additional net return-a compelling economic argument for technology adoption [10] .
Conclusion
Four years of CFLDs confirmed that improved production technology-centred on variety IPM 02-3, seed treatment, balanced fertilization, and IPM-based pest managementcan raise rainfed black gram yields by an average of 66.1 percent over farmer practice. The net return nearly doubled, and the B:C ratio improved from 2.09 to 2.58. The progressive narrowing of the technology index over four years indicates that CFLDs are fulfilling their intended role as technology dissemination tools. Scaling up the cluster approach to additional rainfed blocks, combined with farmer-to-farmer extension networks, should accelerate adoption and help close India's persistent pulse yield gap.
Acknowledgement
Acknowledgements Funding SourcesThis research was conducted under the ICAR-funded Cluster Frontline Demonstration scheme on pulses. Institutional SupportThe authors thank BCKV Mohanpur and VNMAU Parbhani for logistical and technical support during the four-year demonstration program.
Figures and tables from the paper
| Year | Demo Yield (t ha⁻¹) | Check Yield (t ha⁻¹) | Yield Advant. (%) | Tech. Gap (t ha⁻¹) | Ext. Gap (t ha⁻¹) | Tech. Index (%) | No. of CFLDs |
|---|---|---|---|---|---|---|---|
| 2019-20 | 0.87 | 0.54 | 61.1 | 0.53 | 0.33 | 37.9 | 50 |
| 2020-21 | 0.94 | 0.58 | 62.1 | 0.46 | 0.36 | 32.9 | 50 |
| 2021-22 | 1.02 | 0.61 | 67.2 | 0.38 | 0.41 | 27.1 | 50 |
| 2022-23 | 1.08 | 0.63 | 71.4 | 0.32 | 0.45 | 22.9 | 50 |
| Mean | 0.98 | 0.59 | 66.1 | 0.42 | 0.39 | 30.0 | 200 |
Table text extracted from the original PDF; superscript letters are shown inline. The original table image is below.
View original table image
| Parameter | Demo Technology | Farmer Practice | Difference | % Change |
|---|---|---|---|---|
| Cost (₹ ha⁻¹) | 24,680 | 18,340 | 6,340 | +34.6 |
| Gross return (₹ ha⁻¹) | 63,700 | 38,350 | 25,350 | +66.1 |
| Net return (₹ ha⁻¹) | 39,020 | 20,010 | 19,010 | +95.0 |
| B:C ratio | 2.58 | 2.09 | 0.49 | +23.4 |
Table text extracted from the original PDF; superscript letters are shown inline. The original table image is below.
View original table image
References
18 in the original paper- Ali M, Gupta S. Carrying capacity of Indian agriculture: pulse crops. Current Science. 2012;102(6):874-881.
- Singh AK, Manibhushan, Singh NP. Technology gap analysis of pulse production in India. Journal of Food Legumes. 2014;27(3):230-235.
- ICAR. Guidelines for cluster frontline demonstrations on oilseeds and pulses. Indian Council of Agricultural Research; 2018. Circular No. AS/11/2018.
- Meena RK, Singh B, Chawla S. Impact of cluster frontline demonstrations on productivity of pulse crops. Indian Research Journal of Extension Education. 2020;20(1):58-63.
- Reddy AA. Pulses production technology: status and way forward. Economic and Political Weekly. 2010;45(52):73-80.
- Samui SK, Maitra S, Roy DK. Evaluation of frontline demonstrations on black gram in rainfed conditions. Indian Journal of Extension Education. 2000;36(34):180-183.
- Kumar S, Singh R, Singh A. Yield gap analysis of pulse crops through frontline demonstrations. Indian Journal of Agricultural Sciences. 2014;84(7):855-859.
- Tomar RKS, Sharma P. Yield improvement of blackgram through cluster demonstrations. Journal of Food Legumes. 2018;31(2):103-106.
- Chatterjee S, Bandyopadhyay KK. Technology adoption in rainfed pulse production: constraints and opportunities. Agricultural Economics Research Review. 2015;28(2):245-256.
- Choudhary BN. Krishi Vigyan Kendra: a guide for KVK managers. 1st ed. Division of Agricultural Extension, ICAR; 1999.
- Katare S, Pandey SK, Mustafa M. Yield gap analysis of rapeseed-mustard through frontline demonstrations. Agricultural Research. 2011;1(2):177-181.
- Poonia TC, Pithia MS. Impact of frontline demonstrations on moth bean in arid zone. Indian Journal of Extension Education. 2011;47(1-2):51-54.
- Hiremath SM, Nagaraju MV. Evaluation of frontline demonstrations on pigeon pea. Karnataka Journal of Agricultural Sciences. 2009;22(5):1092-1093.
- Dubey SC, Suresh M, Singh B. Evaluation of Trichoderma species for black gram disease management. Indian Phytopathology. 2007;60(1):5863. International Journal of Agriculture and Nutrition https://www.agriculturejournal.net
- Dhaka BL, Meena BS, Suwalka RL. Popularization of improved maize production technology through demonstrations. Rajasthan Journal of Extension Education. 2010;17-18:37-40.
- Raj AD, Yadav V, Rathod JH. Impact of frontline demonstrations on yield of pulses. International Journal of Scientific Research. 2013;2(3):225-227.
- Kiresur VR, Kulkarni JH. Performance of frontline demonstrations in rice and finger millet. Karnataka Journal of Agricultural Sciences. 2007;20(4):775-779.
- Lathwal OP. Evaluation of frontline demonstrations on black gram in irrigated conditions. Indian Journal of Extension Education. 2010;46(3-4):72-74.