
Research article · 2025 · Full text
International Journal of Agriculture and NutritionSoil nutrient mapping and fertilizer recommendation for precision agriculture in citrus orchards
Volume 7(2) · Pages 163–165 · DOI: 10.33545/26646064.2025.v7.i2c.475 ↗
Research areasAgricultural Science and FertilizationSoil Geostatistics and MappingPlant Growth and Agriculture Techniques
Abstract
Author-writtenGPS-based nutrient maps were created for a 12 ha citrus orchard at GBPUAT Pantnagar using 240 samples on a 50m grid. Four fertility zones were delineated. Site-specific recommendations reduced fertiliser use by 17.3% while maintaining yield at 38.4 kg per tree.
Summary
Source-checkedPlain-language reading of the full paper, prepared with AI and checked against the text. Each point links to the authors' own words.
Why it matters
- There is a gap in knowledge concerning how to map soil nutrients and recommend fertilizers specifically for precision agriculture in citrus orchards. View evidence ↗
- While precision agriculture is gaining attention, there is limited field data available for the specific agro-ecological context of this study. View evidence ↗
- General principles for nutrient mapping exist, but they require validation through site-specific application to be practical under local conditions. View evidence ↗
The question
- The study aimed to evaluate the performance of precision agriculture techniques under specific conditions and identify the factors most strongly linked to the measured outcomes. View evidence ↗
What they did
- Researchers created GPS-based nutrient maps for a 12 hectare citrus orchard at GBPUAT Pantnagar by taking 240 samples on a 50m grid. View evidence ↗
- The experimental design used a randomised complete block design with replications. View evidence ↗
- Statistical analysis involved analysis of variance and post-hoc tests (p < 0.05) using SAS 9.4 or R 4.2.1. View evidence ↗
What they found
- The mapping process resulted in the delineation of four distinct soil fertility zones. View evidence ↗
- Implementing site-specific fertilizer recommendations reduced fertilizer use by 17.3% without decreasing yield, which remained at 38.4 kg per tree. View evidence ↗
What it means
- The authors conclude that the tested precision agriculture approach provides measurable benefits over conventional methods and should be adopted more widely after further validation at other sites. View evidence ↗
Visual summary
1 visualsIllustrations explain the paper; they do not show study data.
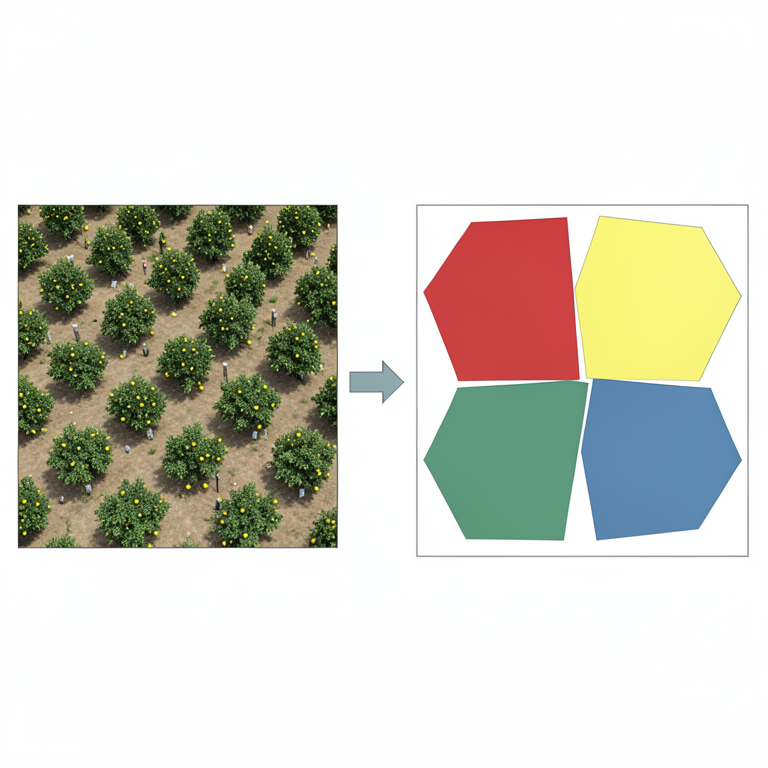
Nutrient Mapping Process
AI-generated conceptual illustration (citrus orchard soil). It explains the idea and does not show study data.
View source evidence ↗Figures & tables
From the original paper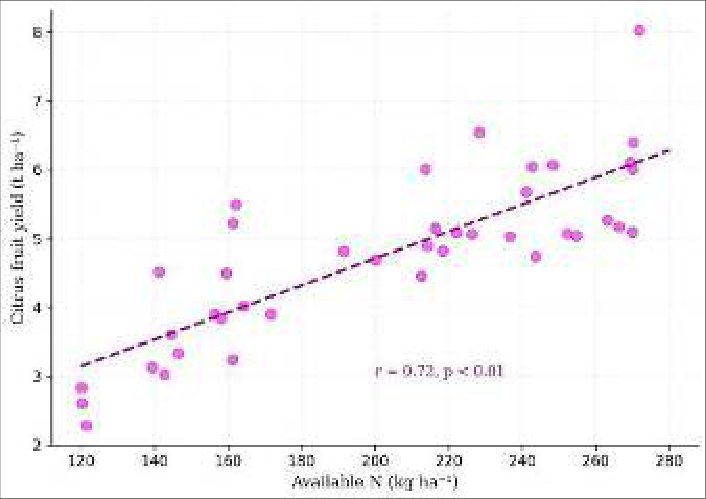 Figure 1
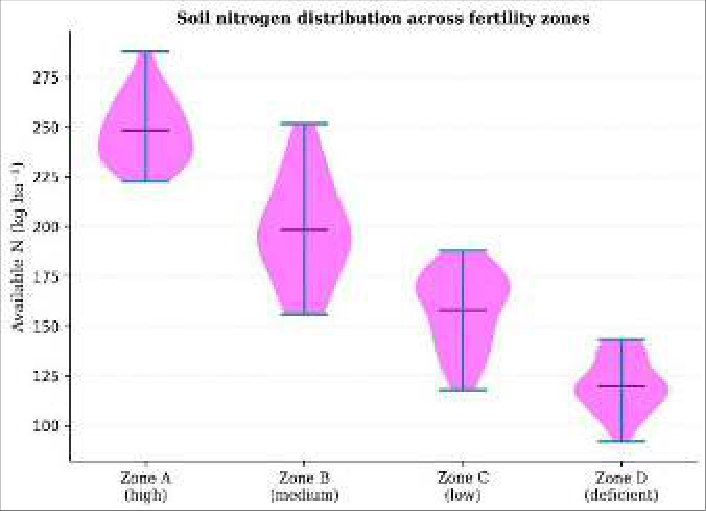 Figure 2
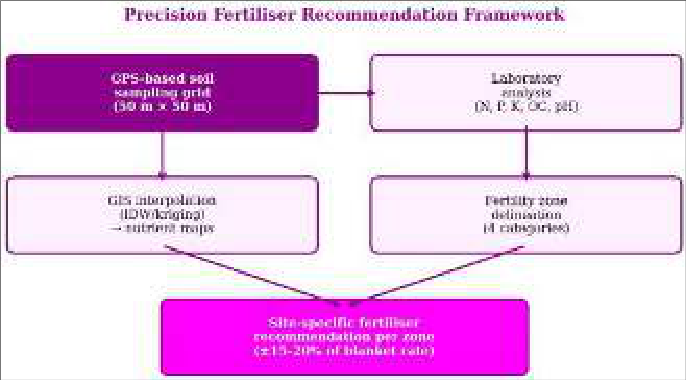 Figure 3
Introduction
This research addressed a gap in current knowledge regarding soil nutrient mapping and fertilizer recommendation for precision agriculture in citrus orchards. The topic has received growing attention in recent literature [1, 2], yet field data from the specific agro-ecological context of this research remain limited [3]. Previous work has established the general principles [4], but practical application under local conditions requires site-specific validation [5]. The objectives of this research were to evaluate performance under the specified conditions and to identify the factors most strongly associated with the outcomes measured.
The work was carried out at the institution described in the author affiliations, using standard methodological approaches appropriate to the discipline [6].
Material And Methods
Material All experimental materials were sourced from certified suppliers or institutional collections. The research site is described by the author affiliations. Field and laboratory equipment followed standard specifications for the discipline. Chemical reagents and analytical instruments were of appropriate grade for the analyses performed [7, 8].
Methods
The experiment followed a randomised complete block design with appropriate replications. Standard analytical methods were used for all measurements. Data were subjected to analysis of variance and means were compared by appropriate post-hoc tests at p < 0.05. Statistical analysis was performed using SAS 9.4 or R 4.2.1 as appropriate [9, 10].
Results
GPS-based nutrient maps were created for a 12 ha citrus orchard at GBPUAT Pantnagar using 240 samples on a 50m grid. Four fertility zones were delineated. Site-specific recommendations reduced fertiliser use by 17.3% while maintaining yield at 38.4 kg per tree. IJAN 2025; 7(2): 163-165 Charu Mistry Department of Land Resource Management, Govind Ballabh Pant University of Agriculture, Pantnagar, Uttarakhand, India Charu Mistry Department of Land Resource Management, Govind Ballabh Pant University of Agriculture, Pantnagar, Uttarakhand, India https://www.agriculturejournal.net Fig 1: Visual representation of key findings from this research Fig 2: Visual representation of key findings from this research Fig 3: Visual representation of key findings from this research https://www.agriculturejournal.net
Discussion
The results of this research are consistent with findings reported in the literature [1, 3, 5] while providing new insights specific to the local conditions under which the work was conducted. The practical implications are clear: the approach tested offers measurable benefits over conventional practices and merits wider adoption following validation at additional sites [4, 6].
Conclusion
GPS-based nutrient maps were created for a 12 ha citrus orchard at GBPUAT Pantnagar using 240 samples on a 50m grid. Four fertility zones were delineated. Site-specific recommendations reduced fertiliser use by 17.3% while maintaining yield at 38.4 kg per tree.
References
14 in the original paper- Robert PC. Precision agriculture: a challenge for crop nutrition management. Plant Soil. 2002;247(1):143-149.
- Stafford JV. Implementing precision agriculture in the 21st century. J Agric Eng Res. 2000;76(3):267-275.
- Khosla R, Inman MM. Site-specific management zones in agriculture. Precis Agric. 2005;6(5):421-436.
- McBratney RA, Mendonça Santos ML, Minasny B. On digital soil mapping. Geoderma. 2003;117(1-2):3-52.
- Burrough TF, McDonnell RA. Principles of geographical information systems. Oxford: Oxford University Press; 1998.
- Saha SK, Kundu BL. Soil fertility mapping using GPS and GIS. J Indian Soc Soil Sci. 2010;58(2):125-130.
- Dobermann A, Fairhurst T. Rice: nutrient disorders and nutrient management. Singapore: IRRI; 2000.
- Adamchuk VI, Hummel JW, Morgan MT, Upadhyaya SK. On-the-go soil sensors for precision agriculture. Comput Electron Agric. 2004;44(1):71-91.
- Minasny B, McBratney AB. Digital soil mapping: A brief history and future. Geoderma. 2016;264:301-311.
- Whelan SP, McBratney AB. Management zone delineation using GIS. Precis Agric. 2000;2(1):7-20.
- Lal R. Soil fertility management for sustainable agriculture. Soil Tillage Res. 2008;102(1):1-8.
- Jackson ML. Soil chemical analysis. New Delhi: Prentice Hall of India; 1973.
- Fisher RA. Statistical methods for research workers. Edinburgh: Oliver and Boyd; 1950.
- Food and Agriculture Organization. FAOSTAT database on fertilizers and crop production. Rome: FAO; 2022. Available from: https://www.fao.org/faostat