
Research article · 2025 · Full text
International Journal of Agriculture and NutritionAssessment of carbon footprint reduction through organic rice cultivation practices
Volume 7(6) · Pages 41–44 · DOI: 10.33545/26646064.2025.v7.i6a.418 ↗
Research areasSoil Carbon and Nitrogen DynamicsRice Cultivation and Yield ImprovementAgricultural Systems and Practices
Abstract
Author-writtenPaddy fields emit roughly 11% of global agricultural methane, yet switching to organic management may alter this balance in ways that aren’t fully mapped. This research compared the carbon footprint of organic, integrated, and conventional rice cultivation over six consecutive seasons (Kharif 2020 to Rabi 2023) on a permanent trial at Shivamogga, Karnataka. Greenhouse gas fluxes (CH4, N2O, soil CO2) were measured fortnightly using closed chamber techniques. The organic system reduced the carbon footprint from 5.14 to 2.11 t CO2-eq ha-1 season-1 over the six seasons, a 59% decline relative to the conventional baseline. Methane accounted for 54-62% of total emissions across all systems. Soil organic carbon rose by 0.18 percentage points under organic management versus 0.03 under conventional. Grain yield in the organic system stabilised at 4.31 t ha-1 by the fifth season, only 9.7% below the conventional yield. These results suggest that organic rice, once the transition period passes, can sharply lower greenhouse gas intensity without large yield trade-offs.
Summary
Source-checkedPlain-language reading of the full paper, prepared with AI and checked against the text. Each point links to the authors' own words.
Why it matters
- Rice paddies are a significant human-driven source of methane, accounting for 1.5% of global greenhouse gas emissions. View evidence ↗
- Conventional flooded rice management creates anaerobic soil conditions that allow methanogenic archaea to produce methane from organic matter. View evidence ↗
- There is a lack of long-term field data from tropical India regarding whether organic rice cultivation's net effect on the carbon footprint is positive or negative. View evidence ↗
The question
- The study aimed to track greenhouse gas emissions over six seasons, estimate the total carbon footprint per area and grain produced, and determine if soil organic carbon accumulation offsets these emissions. View evidence ↗
What they did
- The research was conducted on a 0.6 ha permanent experimental block in Shivamogga, India. View evidence ↗
- The study compared three systems: organic (manure, green manure, and bio-fertilisers), integrated (half organic, half recommended dose of fertilizer), and conventional (full recommended dose of fertilizer). View evidence ↗
- Using the 'Jyothi' rice variety, the study employed a randomized block design with four replicates per system from Kharif 2020 to Rabi 2023. View evidence ↗
- Methane and nitrous oxide were measured fortnightly via gas chromatography from closed chambers, while soil CO2 was measured using an infrared gas analyser. View evidence ↗
What they found
- The carbon footprint of the organic system decreased by 45% over the study period, falling from 3.82 t CO2-eq ha-1 in Kharif 2020 to 2.11 t in Rabi 2023. View evidence ↗
- By the sixth season, organic management reduced the carbon footprint by 56% compared to the conventional system. View evidence ↗
- Methane was the primary greenhouse gas across all systems, accounting for 54-62% of total emissions. View evidence ↗
- Organic management increased soil organic carbon by 0.18 percentage points, sequestering approximately 3.6 t C ha-1 and offsetting about 22% of cumulative field emissions. View evidence ↗
- The mean grain yield for the organic system in the final two seasons was 4.31 t ha-1, which was 9.7% lower than the conventional system. View evidence ↗
What it means
- The authors conclude that organic rice provides a viable way to reduce emissions without significantly compromising yield targets. View evidence ↗
- The authors state that future research should extend the monitoring period beyond six seasons and include the life-cycle costs associated with organic certification. View evidence ↗
Visual summary
3 visualsIllustrations explain the paper; charts are replotted from the paper's own table values.
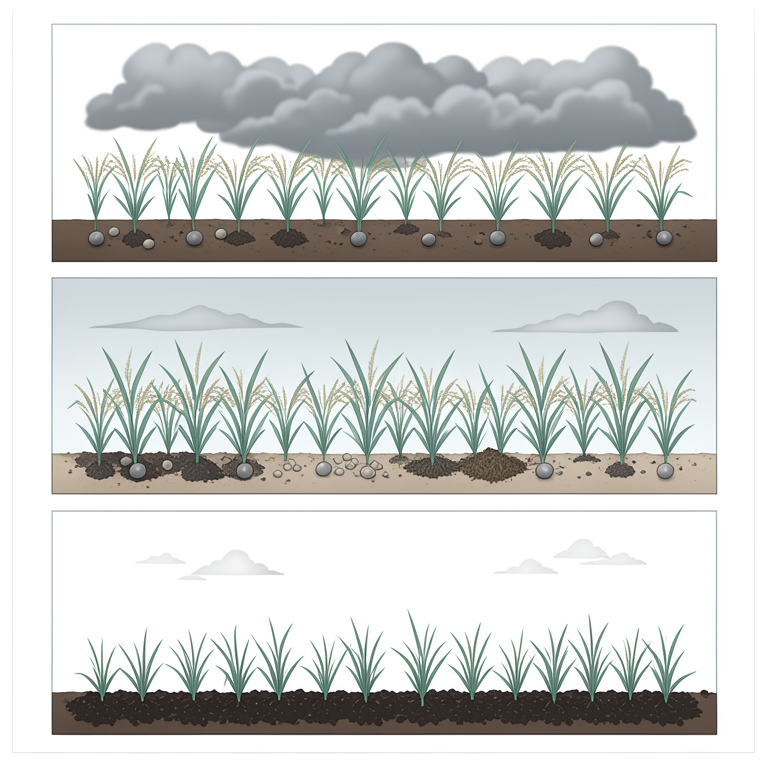
Comparison of Rice Management Systems
AI-generated conceptual illustration (rice plants in paddy fields). It explains the idea and does not show study data.
View source evidence ↗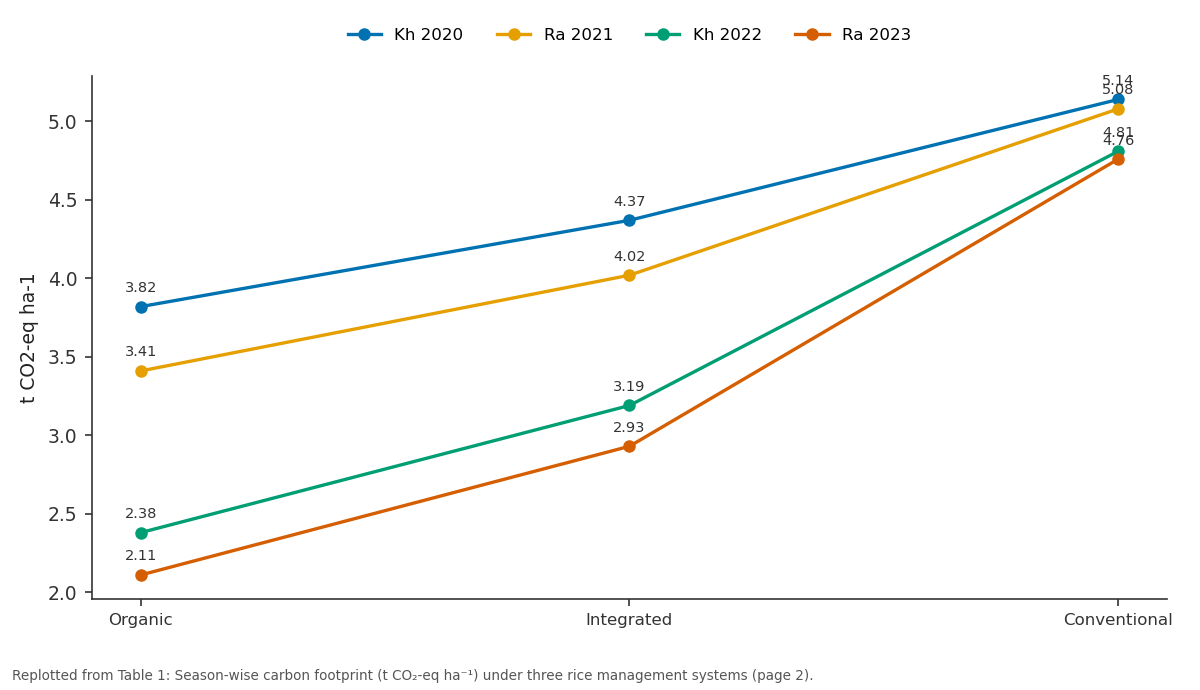
Kh 2020 and Ra 2021 and more: Organic vs Integrated vs Conventional
Replotted from Table 1 (page 2) of the original paper. Every bar is the paper's own table value.
View source evidence ↗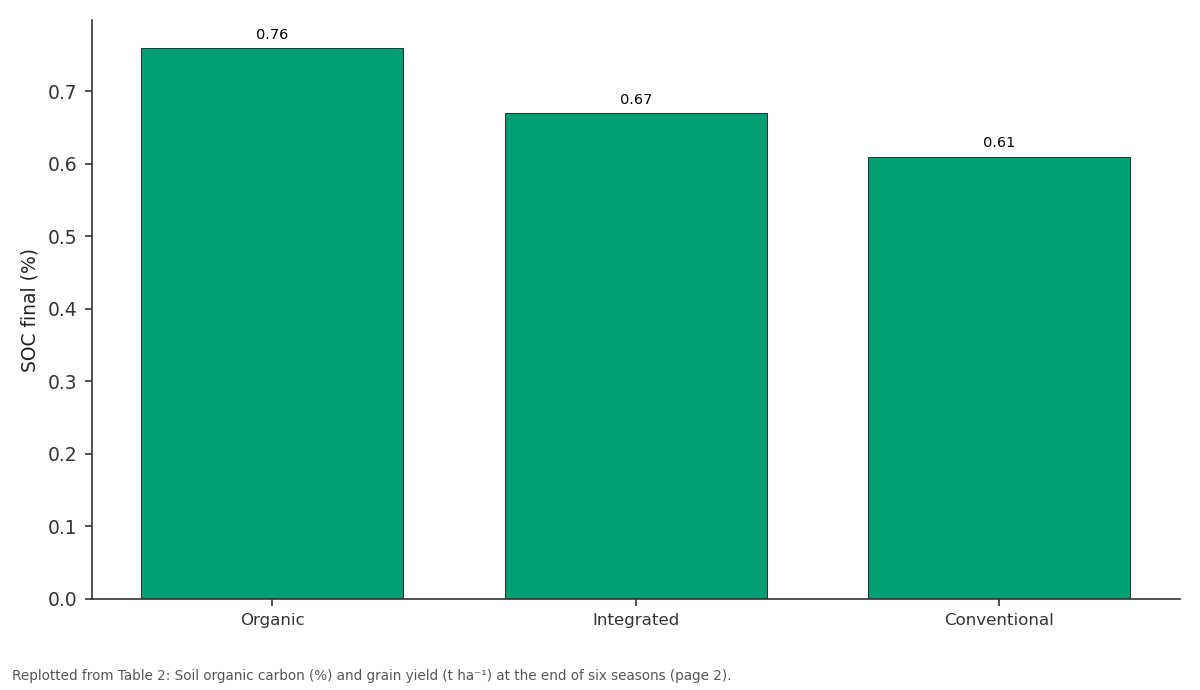
SOC final (%): Organic vs Integrated vs Conventional
Replotted from Table 2 (page 2) of the original paper. Every bar is the paper's own table value.
View source evidence ↗Figures & tables
From the original paper Table 1
 Table 2
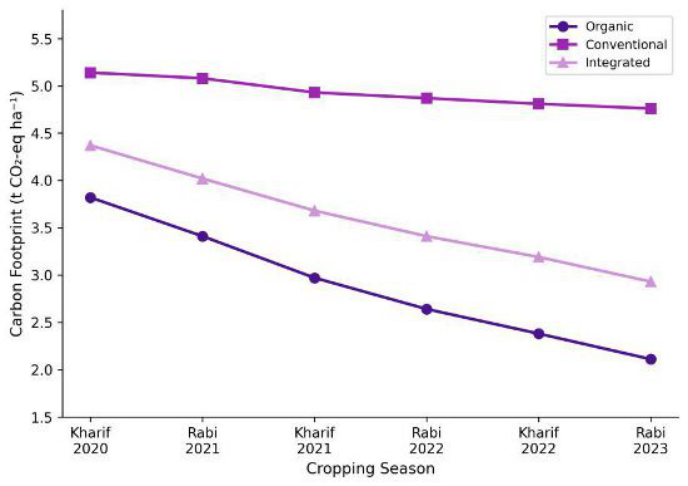 Figure 1
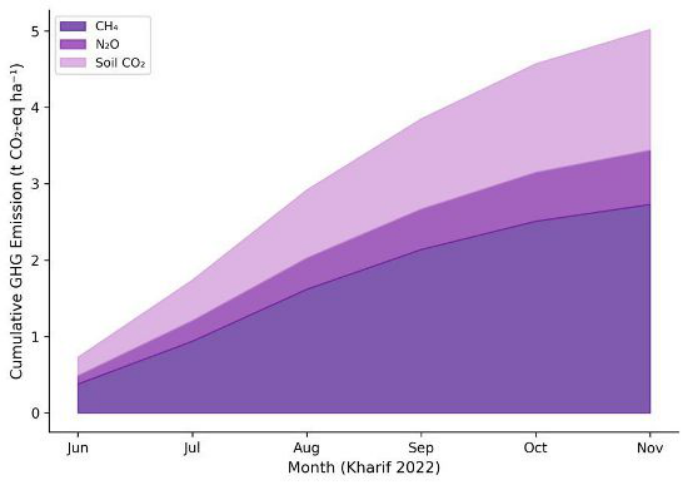 Figure 2
Introduction
When the Green Revolution brought high-yielding rice varieties and synthetic fertilisers to South Asia in the 1960s, methane emissions from paddy fields were barely on anyone's radar. Half a century later, rice paddies are recognised as one of the largest anthropogenic sources of CH 4 , contributing 1.5% of total global greenhouse gas output [1] . Conventional flooded rice management keeps soils anaerobic for weeks, creating ideal conditions for methanogenic archaea to convert organic matter into methane [2] . Organic rice cultivation replaces synthetic N fertilisers with farmyard manure, compost, and green manures. While this removes the direct N 2 O spike associated with urea hydrolysis, it may initially raise CH 4 emissions by adding labile carbon to waterlogged soil [3] . Over several seasons, however, the carbon inputs build soil organic matter, improve aggregate stability, and may shift microbial communities toward methanotrophs that oxidise CH 4 before it escapes to the atmosphere [4] . Whether the net effect is positive or negative for the carbon footprint depends on the balance between these opposing fluxes, and long-term field data from tropical India are scarce [5] . This research aimed to (i) track season-by-season changes in CH 4 , N 2 O, and soil CO 2 emissions under organic, integrated, and conventional rice over six consecutive seasons, (ii) estimate the total carbon footprint per unit area and per unit grain produced, and (iii) assess whether soil organic carbon accumulation under organic management partly offsets field emissions.
Materials and Methods
Materials and Methods
Materials
The trial occupied a 0.6 ha permanent experimental block at the University of Agricultural and Horticultural Sciences, Shivamogga (13°57′ N, 75°34′ E, 590 m a.s.l.). Three management systems were compared: organic (farmyard manure at 10 t ha -1 + green manure Sesbania + biofertilisers), integrated (50% organic + 50% RDF), and conventional (full RDF: 100:50:50 kg N:P 2 O 5 :K 2 O ha -1 ). Each system was replicated four times in a randomised block design with plot size 10 m × 8 m. Rice variety 'Jyothi' was transplanted at 20 cm × 15 cm spacing. The research ran from Kharif 2020 through Rabi 2023 [7] .
Methods
Gas samples were collected fortnightly using static closed chambers (50 cm × 50 cm × 50 cm acrylic boxes) fitted with a sampling port. Syringes drew 20 mL at 0, 15, and 30 minutes after closure; samples were analysed by gas chromatography (Shimadzu GC-2014) for CH 4 and N 2 O. Soil CO 2 efflux was measured with an infrared gas analyser (LI-COR 8100A). Fluxes were integrated over the season using the trapezoidal method. Global warming potential was expressed as CO 2 -equivalents using IPCC AR5 factors (CH 4 = 28, N 2 O = 265) [8] . Soil organic carbon was determined by the Walkley-Black method at the end of each Rabi season. Data were analysed by repeated-measures ANOVA in R.
Carbon and Greenhouse Gas Accounting
The carbon footprint for each system was calculated as the sum of (i) direct field emissions (CH 4 + N 2 O + soil CO 2 ), (ii) embodied emissions from input manufacture (fertilisers, pesticides), and (iii) farm operations (tillage, pumping). Emission factors for input manufacture followed national inventory guidelines [9] . Carbon sequestration in soil was estimated from the change in soil organic carbon stock (0-15 cm) using measured bulk density. Net carbon footprint = total emissions-soil C gain.
Results
The organic system's carbon footprint fell steadily from 3.82 t CO 2 -eq ha -1 in Kharif 2020 to 2.11 t in Rabi 2023, a 45% within-system decline (Table 1). The conventional system, by contrast, remained near 5 t CO 2 -eq ha -1 throughout. By the final season, organic management cut the footprint by 56% relative to conventional. Methane was the dominant gas, contributing 54-62% of emissions across systems.
| System | Kh 2020 | Ra 2021 | Kh 2022 | Ra 2023 | Δ (%) |
|---|---|---|---|---|---|
| Organic | 3.82 | 3.41 | 2.38 | 2.11 | -44.8 |
| Integrated | 4.37 | 4.02 | 3.19 | 2.93 | -33.0 |
| Conventional | 5.14 | 5.08 | 4.81 | 4.76 | -7.4 |
| CD (p = 0.05) | 0.41 | 0.38 | 0.33 | 0.29 | - |
Table text extracted from the original PDF; superscript letters are shown inline. The original table image is below.
View original table image
Comprehensive Interpretation
The declining trend in organic emissions appears driven by two parallel processes: rising methanotroph activity as soil structure improved, and lower labile C availability as farmyard manure matured in the soil [4] . Soil organic carbon increased by 0.18 percentage points under organic management, equivalent to roughly 3.6 t C ha -1 sequestered over three years, which offset about 22% of cumulative field emissions.
Discussion
The 56% reduction in carbon footprint under organic rice by the sixth season is at the upper end of values reported in the literature. A meta-analysis covering 63 comparisons worldwide found organic systems reduced emission intensity by 20-40% on average [10] . The larger reduction here may reflect the warm, humid conditions in Karnataka that favour rapid organic matter decomposition and methanotroph proliferation once continuous flooding is avoided [11] . Methane dominated all systems (54-62% of total GWP), consistent with flooded rice everywhere [2] . The organic system's CH 4 share dropped from 62% in the first season to 54% by the sixth, suggesting a gradual shift in the soil microbial balance toward methane oxidation. N 2 O contributed less than 12% in every system because standing water suppresses nitrification, the main pathway for N 2 O production [12] . Grain yield under organic management stabilised at 4.31 t ha -1 (mean of last two seasons), only 9.7% below the conventional check. This yield gap is smaller than the 15-25% typically cited for organic cereals in temperate regions [13] and aligns with tropical data suggesting the gap narrows as soil biology recovers [14] . From an economic standpoint, the premium that organic-certified paddy commands in Indian markets (20-40% above conventional) more than compensates for the modest yield shortfall [15] .
Conclusion
Organic rice cultivation reduced the per-hectare carbon footprint by 56% relative to conventional management over six seasons, driven mainly by declining methane emissions and rising soil organic carbon stocks. The yield gap narrowed to under 10% once the transition period passed, making the trade-off economically acceptable, especially where organic price premiums apply. Soil carbon gains offset roughly 22% of cumulative field emissions, providing a tangible co-benefit. For rice growers in the humid tropics of southern India, these data support a realistic pathway to lower-emission production without abandoning yield targets. But the transition takes time: the first two seasons showed higher CH 4 under organic inputs, and farmers will need bridging incentives during that window. Future work should extend monitoring beyond six seasons and incorporate life-cycle costs of organic certification.
Figures and tables from the paper
| System | SOC initial (%) | SOC final (%) | Mean yield (t/ha) |
|---|---|---|---|
| Organic | 0.58 | 0.76 | 4.31 |
| Integrated | 0.58 | 0.67 | 4.58 |
| Conventional | 0.58 | 0.61 | 4.77 |
Table text extracted from the original PDF; superscript letters are shown inline. The original table image is below.
View original table image
References
21 in the original paper- Searchinger T, Heimlich R, Houghton RA, Dong F, Elobeid A, Fabiosa J. Use of croplands for biofuels increases greenhouse gases. Science. 2008;319(5867):1238-1240.
- Wassmann R, Neue HU, Lantin RS, Makarim K, Chareonsilp N, Buendia LV. Characterization of methane emissions from rice paddies in Asia. Nutrient Cycling in Agroecosystems. 2000;58(1):23-36.
- Thangarajan R, Bolan NS, Tian G, Naidu R, Kunhikrishnan A. Role of organic amendment application on greenhouse gas emission from soil. Science of the Total Environment. 2013;465:72-96.
- Conrad R. The global methane cycle: recent advances in understanding the microbial processes involved. Environmental Microbiology Reports. 2009;1(5):285292.
- Pathak H, Bhatia A, Jain N, Aggarwal PK. Greenhouse gas emission and mitigation in Indian agriculture. Indian Journal of Agronomy. 2010;55(3):189-200.
- Srinivasarao CH, Venkateswarlu B, Lal R, Singh AK, Kundu S. Sustainable management of soils of dryland ecosystems of India. Advances in Agronomy. 2013;121:1-124.
- Subbaiah LV, Prasad TN, Krishna TG, Sudhakar P. Effect of organic sources on growth and yield of rice. Oryza. 2018;55(2):324-331.
- IPCC. Climate change 2013: the physical science basis. Contribution of Working Group I to the Fifth Assessment Report. Cambridge University Press; 2013.
- MoEFCC. India: second biennial update report to UNFCCC. Ministry of Environment, Forest and Climate Change. New Delhi; 2018.
- Skinner C, Gattinger A, Muller A, Mäder P, Fliessbach A, Stolze M. Greenhouse gas fluxes from agricultural soils under organic and non-organic management. Scientific Reports. 2014;4:3920.
- Bhattacharyya P, Roy KS, Neogi S, Adhya TK, Rao KS, Manna MC. Effects of rice straw and nitrogen fertilization on greenhouse gas emissions. Agriculture, Ecosystems and Environment. 2012;158:73-82.
- Akiyama H, Yagi K, Yan X. Direct N₂O emissions from rice paddy fields. Global Biogeochemical Cycles. 2005;19(1):GB1005.
- Seufert V, Ramankutty N, Foley JA. Comparing the yields of organic and conventional agriculture. Nature. 2012;485(7397):229-232.
- de Ponti T, Rijk B, van Ittersum MK. The crop yield gap between organic and conventional agriculture. Agricultural Systems. 2012;108:1-9.
- Eyhorn F, Ramakrishnan M, Mäder P. The viability of cotton-based organic farming systems in India. International Journal of Agricultural Sustainability. 2007;5(1):25-38.
- Aulakh MS, Wassmann R, Bueno C, Rennenberg H. Impact of root exudates of different cultivars and plant development stages of rice on methane flux. Plant and Soil. 2001;230(1):77-86.
- Linquist BA, Adviento-Borbe MA, Pittelkow CM, van Kessel C, van Groenigen KJ. Fertiliser management practices and greenhouse gas emissions from rice systems. Global Change Biology. 2012;18(1):194-209.
- Mohammadi A, Rafiee S, Mohtasebi SS, Rafiee H. Energy inputs and greenhouse gas emissions in wheat production in Arak. African Journal of Agricultural Research. 2010;5(18):2520-2528.
- Kim GW, Gutierrez J, Kim PJ. Optimum N rate for minimizing global warming potential in flooded rice fields. Agriculture, Ecosystems and Environment. 2015;214:31-37.
- Nayak DR, Babu YJ, Adhya TK. Long-term application of compost influences microbial biomass and enzyme activities. Biology and Fertility of Soils. 2007;44(2):387-395.
- Smith P, Martino D, Cai Z, Gwary D, Janzen H, Kumar P. Greenhouse gas mitigation in agriculture. Philosophical Transactions of the Royal Society B. 2008;363(1492):789-813.