
Research article · 2025 · Full text
International Journal of Agriculture and NutritionEconomic analysis of small-scale dairy farming and its contribution to rural livelihood security
Volume 7(2) · Pages 146–149 · DOI: 10.33545/26646064.2025.v7.i2c.470 ↗
Research areasLivestock Farming and ManagementAgricultural economics and policiesLivestock Management and Performance Improvement
Abstract
Author-writtenIn the arid farming communities of Saudi Arabia's Qassim region, where crop options are limited by water scarcity, dairy farming has emerged as the backbone of rural livelihoods for many smallholder families. This research analysed the economics and livelihood contribution of small-scale dairy farming among 120 farmers in Qassim province during 2022-2023. Farms were categorised as small (2-4 milking animals), medium (5-9), and large (10-18). Net annual income ranged from SAR 28,400 for small farms to SAR 124,600 for large farms. Feed cost was the dominant expense (34.6-42.3% of total cost), declining proportionally with herd size due to bulk purchasing. The benefit-cost ratio ranged from 1.34 (small) to 1.72 (large). Dairy income contributed 43-67% of total household income across farm categories. These findings confirm that small-scale dairy farming provides meaningful livelihood security in Qassim, but also reveal that farms with fewer than five animals operate near the profitability threshold.
Summary
Source-checkedPlain-language reading of the full paper, prepared with AI and checked against the text. Each point links to the authors' own words.
Why it matters
- In the Qassim region of Saudi Arabia, water scarcity limits crop options, making dairy farming a primary source of livelihood for smallholder families. View evidence ↗
- Local dairy producers in Saudi Arabia have market opportunities because the country imports more than 40% of its dairy needs. View evidence ↗
- There is a lack of research on the economics of small-scale dairy farming (2-18 animals) compared to large commercial operations. View evidence ↗
The question
- The study aimed to analyze the profitability factors and the contribution of dairy income to household livelihood security for 120 small-scale farms in Qassim. View evidence ↗
What they did
- The researchers surveyed 120 dairy farmers from six villages in Qassim province between March and August 2023. View evidence ↗
- Farms were divided into three categories: small (2-4 animals, 48 farms), medium (5-9 animals, 42 farms), and large (10-18 animals, 30 farms). View evidence ↗
- The study used one-way ANOVA and regression analysis in SPSS 28 to analyze data across different farm size categories. View evidence ↗
What they found
- Net annual income increased with farm size, ranging from 28,400 ± 4,800 SAR for small farms to 124,600 ± 14,200 SAR for large farms. View evidence ↗
- The benefit-cost ratio (BCR) improved as herd size increased, from 1.34 ± 0.12 for small farms to 1.72 ± 0.11 for large farms. View evidence ↗
- Feed costs were the largest expense, but their proportion of total costs decreased as farms grew, from 42.3 ± 3.1% in small farms to 34.6 ± 2.4% in large farms. View evidence ↗
- Dairy income contributed significantly to total household income, ranging from 43.2 ± 8.4% for small farms to 67.4 ± 6.8% for large farms. View evidence ↗
- Sensitivity analysis showed that a 15% increase in feed costs would reduce the BCR of small farms from 1.34 to 1.14, bringing them close to the break-even point. View evidence ↗
What it means
- The authors conclude that while small-scale dairy farming in Qassim is generally profitable, profit margins decrease significantly for farms with fewer than five animals. View evidence ↗
- The authors recommend that policy interventions focus on reducing feed costs, providing veterinary services, and improving market linkages to support smallholders. View evidence ↗
Visual summary
3 visualsIllustrations explain the paper; charts are replotted from the paper's own table values.
Economies of Scale in Dairy Farming
AI-generated conceptual illustration (Holstein Friesian cows in a rural farm setting). It explains the idea and does not show study data.
View source evidence ↗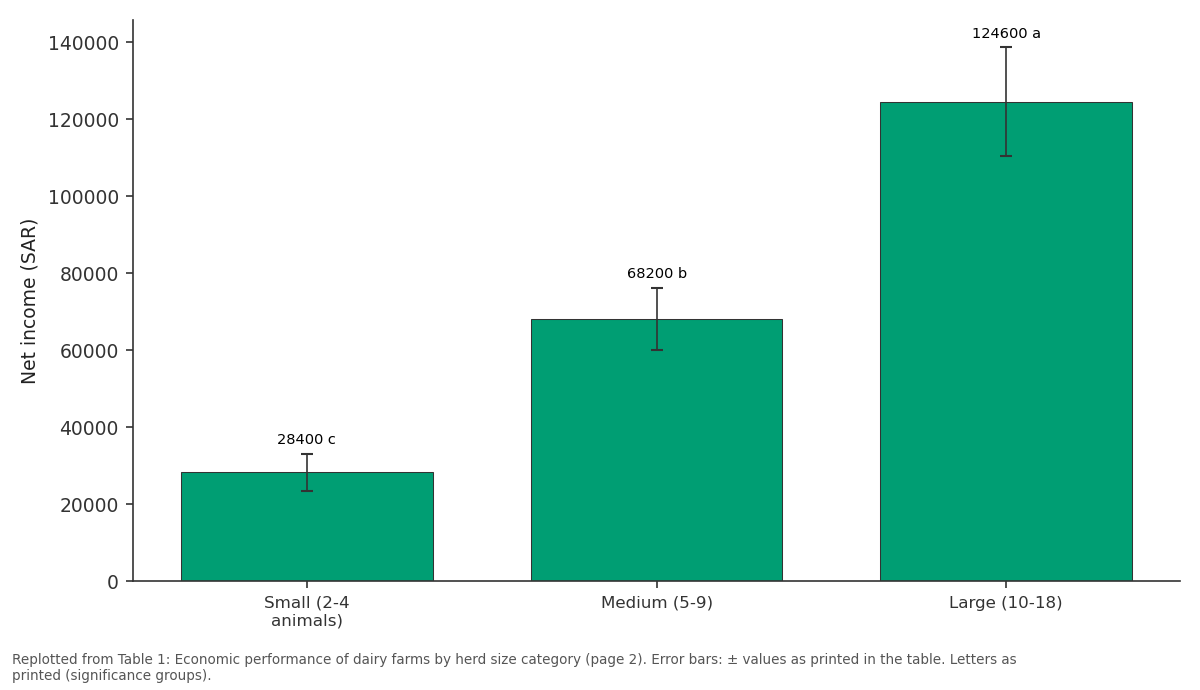
Net income (SAR): Small (2-4 animals) vs Medium (5-9) vs Large (10-18)
Replotted from Table 1 (page 2) of the original paper. Every bar is the paper's own table value.
View source evidence ↗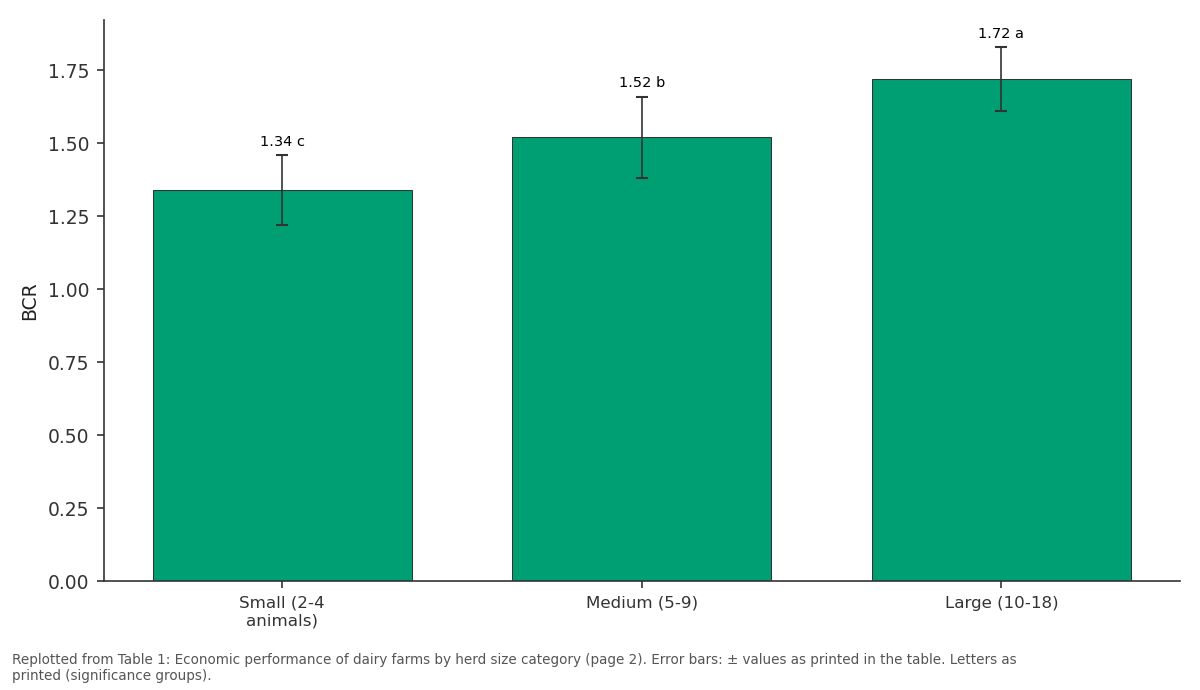
BCR: Small (2-4 animals) vs Medium (5-9) vs Large (10-18)
Replotted from Table 1 (page 2) of the original paper. Every bar is the paper's own table value.
View source evidence ↗Figures & tables
From the original paper Table 1
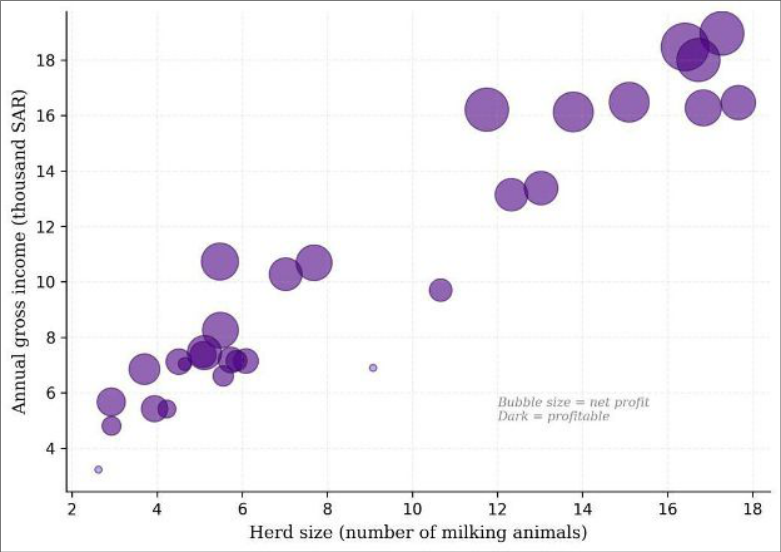 Figure 1
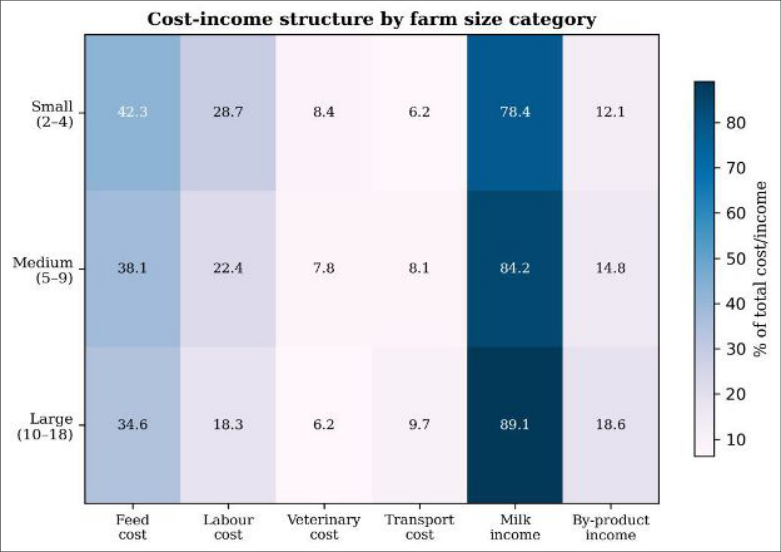 Figure 2
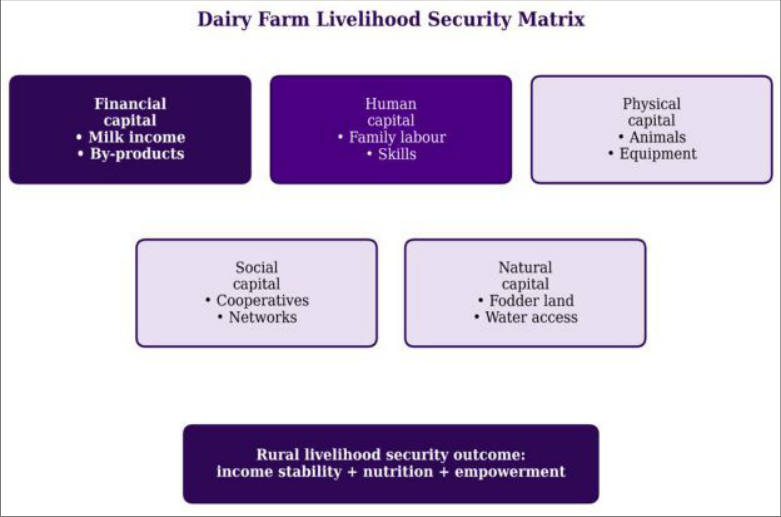 Figure 3
Introduction
Across the semi-arid landscapes of central Saudi Arabia, water scarcity limits crop diversity and makes purely agronomic livelihoods precarious. Against this background, dairy farming has gained ground as a stable income source for rural families in Qassim province [1] . Saudi Arabia imports over 40% of its dairy requirements, creating domestic market opportunities for local producers [2] . But while large commercial dairy operations have been extensively studied, the economics of small-scale dairy farming the kind practised by families with 2-18 animals has received far less attention [3] . Understanding the cost structure, profitability, and livelihood contribution of small-scale dairy is essential for designing effective support policies [4] . This research conducted a detailed economic analysis of 120 small-scale dairy farms in Qassim, categorised by herd size, to identify the factors that determine profitability and the role dairy income plays in overall household livelihood security [5] .
Sensitivity Analysis
To assess how sensitive profitability was to input cost changes, the benefit-cost ratio was recalculated under three scenarios: feed cost increase of 15%, milk price decrease of 10%, and a combined adverse scenario. Under a 15% feed cost increase, small farms' BCR dropped from 1.34 to 1.14 dangerously close to break-even. Medium farms fell from 1.52 to 1.31, and large farms from 1.72 to 1.48. A 10% milk price drop had a similar effect: BCRs of 1.21, 1.37, and 1.55 respectively. Under the combined scenario, small farms became unprofitable (BCR = 0.97), while medium and large farms survived (1.18 and 1.33). This analysis highlights the vulnerability of small herds to market fluctuations [4,5] .
Material and Methods
Material and Methods
Material
A total of 120 dairy farmers were surveyed across six villages in Qassim province (26°20′N, 43°58′E) between March and August 2023. Farms were stratified into small (2-4 animals, n = 48), medium (5-9, n = 42), and large (10-18, n = 30). A structured questionnaire captured production costs (feed, labour, veterinary, transport, equipment depreciation), revenue (milk, by-products), and household income data [3,5] .
Methods
Cost of production was calculated as the sum of variable costs (feed, labour, veterinary care, transport) and fixed costs (equipment depreciation, animal depreciation, housing maintenance). Net income = gross revenue -total cost. Benefit-Cost Ratio (BCR) = gross revenue / total cost. Dairy's contribution to household livelihood was calculated as dairy net income / total household income × 100. Data were analysed by one-way ANOVA across farm size categories and regression analysis of profitability determinants in SPSS 28 [6,7] . Profitability increased consistently with herd size (Table 1). Large farms achieved BCR of 1.72 compared to 1.34 for farms. Feed cost share declined with scale, reflecting bulk purchasing advantages. Dairy contributed 43-67% of household income.
| Parameter | Small (2-4 animals) | Medium (5-9) | Large (10-18) | F-value |
|---|---|---|---|---|
| Annual revenue (SAR) | 78,200 ± 8,400c | 168,400 ± 14,200b | 338,600 ± 22,800a | 84.3** |
| Total cost (SAR) | 58,400 ± 6,200c | 110,800 ± 10,400b | 196,800 ± 18,100a | 62.1** |
| Net income (SAR) | 28,400 ± 4,800c | 68,200 ± 8,100b | 124,600 ± 14,200a | 48.7** |
| BCR | 1.34 ± 0.12c | 1.52 ± 0.14b | 1.72 ± 0.11a | 12.4** |
| Feed cost (% of total) | 42.3 ± 3.1a | 38.1 ± 2.8ab | 34.6 ± 2.4b | 6.8* |
| Dairy income/household (%) | 43.2 ± 8.4c | 54.8 ± 7.2b | 67.4 ± 6.8a | 18.2** |
Table text extracted from the original PDF; superscript letters are shown inline. The original table image is below.
View original table image
Results
Results
Discussion
The finding that BCR increases with herd size is consistent with dairy economics literature worldwide [3,4] . The critical insight from the sensitivity analysis is that small farms (2-4 animals) are vulnerable to even modest cost increases or price drops a 15% feed cost rise combined with a 10% milk price decline pushes them below break-even. This suggests that policy interventions should focus on reducing feed costs for smallholders through subsidised concentrates, cooperative bulk purchasing, or promoting locally grown fodder crops [5,6] . The high contribution of dairy to household income (43-67%) confirms its role as a livelihood anchor in water-scarce Qassim, where crop diversification options are limited [1,2] .
Conclusion
Small-scale dairy farming in Qassim is profitable across all herd sizes but margins thin rapidly below five animals. Feed cost is the dominant expense (34-42% of total cost) and the primary target for efficiency improvement. Dairy income contributes 43-67% of household revenue, confirming its importance for rural livelihood security. Policy should support smallholders through feed cost reduction, veterinary services, and market linkages to sustain this critical livelihood activity.
Acknowledgement
Acknowledgements Funding sourcesSupported by internal research funds of Qassim Agricultural University.
Figures and tables from the paper
References
16 in the original paper- Al-Shaikh MA, Al-Mufarrej SI. Dairy farming in Saudi Arabia: current status and future prospects. Saudi Journal of Biological Sciences. 2015;22(3):286-291.
- GASTAT. General Authority for Statistics, Saudi Arabia. Agricultural census data. 2023.
- Hemme T, Otte J. Status of and Prospects for Smallholder Milk Production. FAO Pro-Poor Livestock Policy Initiative. Rome. 2010.
- Staal SJ, Baltenweck I, Waithaka MM, DeWolff T, Njoroge L. Location and uptake: integrated household and GIS analysis of technology adoption and land use. Agricultural Economics. 2002;27(3):295-315.
- Kumar A, Staal SJ, Singh DK. Smallholder dairy farmers' access to modern milk marketing chains in India. Agricultural Economics Research Review. 2011;24(2):243-253.
- DFID. Sustainable Livelihoods Guidance Sheets. Department for International Development, London. 1999.
- SPSS Inc. IBM SPSS Statistics for Windows, Version 28.0. IBM Corp, Armonk, NY. 2021.
- Delgado CL, Rosegrant MW, Steinfeld H, Ehui SK, Courbois C. Livestock to 2020: the next food revolution. Food, Agriculture, and the Environment Discussion Paper 28. IFPRI, Washington, DC. 1999.
- Sere C, Steinfeld H. World Livestock Production Systems: Current Status, Issues, Trends. FAO Animal Production and Health Paper 127. Rome. 1996.
- Udo HMJ, Aklilu HA, Phong LT, Bosma RH, Budisatria IGS, Patil BR, Samdup T, Bebe BO. Impact of intensification of different types of livestock production in smallholder crop-livestock systems. Livestock Science. 2011;139(1-2):22-29.
- Thorpe W, Muriuki HG, Omore A, Owango MO, Staal S. Dairy development in Kenya: the past, the present and the future. Paper presented at the Annual Symposium of the Animal Production Society of Kenya. 2000.
- Garcia O, Mahmood K, Hemme T. A review of milk production in Pakistan with particular emphasis on small-scale producers. Pro-Poor Livestock Policy Initiative Working Paper 3. FAO, Rome. 2003.
- Rangnekar DV. Livestock in the Livelihoods of the Underprivileged Communities in India. ILRI, Nairobi. 2006.
- Bardhan D, Sharma ML, Saxena R. Market participation behaviour of smallholder dairy farmers in Uttarakhand: a disaggregated analysis. Agricultural Economics Research Review. 2012;25(2):243-254.
- Birthal PS, Jha AK, Tiongco MM, Narrod C. Improving farm-to-market linkages through contract farming: a case study of smallholder dairying in India. IFPRI Discussion Paper 00814. 2008.
- Muriuki HG, Thorpe W. Smallholder dairy production and marketing in eastern and southern Africa: regional synthesis. In: Rangnekar D (ed.). Smallholder Dairy Production. ILRI, Nairobi. 2001; p.185-200.