
Research article · 2025 · Full text
International Journal of Agriculture and NutritionDeficit irrigation strategies for maximizing economic returns in water-limited wheat production
Volume 7(1) · Pages 116–118 · DOI: 10.33545/26646064.2025.v7.i1b.388 ↗
Research areasIrrigation Practices and Water ManagementRice Cultivation and Yield ImprovementWater resources management and optimization
Abstract
Author-writtenDeficit irrigation is to water management what a household budget is to personal finance: it accepts that resources are limited and allocates them where the return per unit is highest. This research tested four irrigation levels—full irrigation (100% crop evapotranspiration, ETc), 75% ETc, 50% ETc, and rainfed control—on winter wheat (Triticum aestivum L., cv. AKAW-4627) at Dr. Panjabrao Deshmukh Krishi Vidyapeeth, Akola, Maharashtra, over two rabi seasons (2021–22 and 2022–23). The 75% ETc strategy reduced water applied by 23.7% relative to full irrigation while lowering grain yield by only 8.5% (4.31 vs. 4.71 t ha⁻¹). Water productivity peaked at 1.83 kg m⁻³ under 75% ETc compared with 1.42 kg m⁻³ for full irrigation. Net returns were highest at 75% ETc (42,380 INR ha⁻¹, BCR 2.47). The 50% ETc level saved 47% of water but cut yield by 27.6%, making it economically inferior. These results position the 75% ETc strategy as the optimal trade-off between water saving and economic return for wheat in semi-arid Maharashtra.
Summary
Source-checkedPlain-language reading of the full paper, prepared with AI and checked against the text. Each point links to the authors' own words.
Why it matters
- Deficit irrigation (DI) is a water management strategy that intentionally applies less water than a crop's full evapotranspiration demand to reallocate saved water to other areas or critical growth stages. View evidence ↗
- In the Vidarbha region of Maharashtra, canal water allocations for rabi wheat are typically between 500 and 600 mm per hectare, while actual crop evapotranspiration (ETc) is 400 to 450 mm. View evidence ↗
- There is a lack of site-specific data for Vidarbha's black cotton soils, which are characterized by high water-holding capacity and cracking during drying. View evidence ↗
The question
- The study aimed to compare four irrigation levels to determine their effects on wheat yield, water productivity, and grain protein content, while identifying the strategy that maximizes net economic return per hectare. View evidence ↗
What they did
- The experiment tested four irrigation levels (100% ETc, 75% ETc, 50% ETc, and rainfed control) on winter wheat (cv. AKAW-4627) in Akola, Maharashtra, during the 2021–22 and 2022–23 rabi seasons. View evidence ↗
- The study used a randomized complete block design with four replications on plots measuring 6 x 5 meters. View evidence ↗
- Irrigation was scheduled using a soil-water-balance approach, replenishing water when depletion reached 50% of available soil moisture, with moisture tracked at 15 and 30 cm depths. View evidence ↗
- The researchers measured grain yield, straw yield, harvest index, 1000-grain weight, and grain protein at maturity, and calculated water productivity as grain yield divided by total water input. View evidence ↗
What they found
- The 75% ETc strategy reduced water application by 23.7% compared to full irrigation, with a modest grain yield reduction of 8.5% (4.31 t ha⁻¹ vs. 4.71 t ha⁻¹). View evidence ↗
- Water productivity was higher under the 75% ETc strategy (1.83 kg m⁻³) than under full irrigation (1.42 kg m⁻³). View evidence ↗
- The 75% ETc strategy provided the highest net return (42,380 INR ha⁻¹) and benefit-cost ratio (2.47), outperforming full irrigation (40,710 INR ha⁻¹; BCR 2.37). View evidence ↗
- While the 50% ETc level saved 47% of water, it was economically inferior due to a 27.6% reduction in yield. View evidence ↗
- Rainfed wheat was the least profitable option because yields dropped below 2.2 t ha⁻¹, despite having no irrigation costs. View evidence ↗
What it means
- The authors conclude that the 75% ETc strategy is the most economically rational deficit irrigation option for the semi-arid Vidarbha region. View evidence ↗
- The study was limited by its single-site scope over two seasons and the lack of treatments targeting specific phenological stages, such as full irrigation only at anthesis. View evidence ↗
Visual summary
2 visualsIllustrations explain the paper; charts are replotted from the paper's own table values.
The 75% ETc Trade-off
AI-generated conceptual illustration (wheat plants in a field). It explains the idea and does not show study data.
View source evidence ↗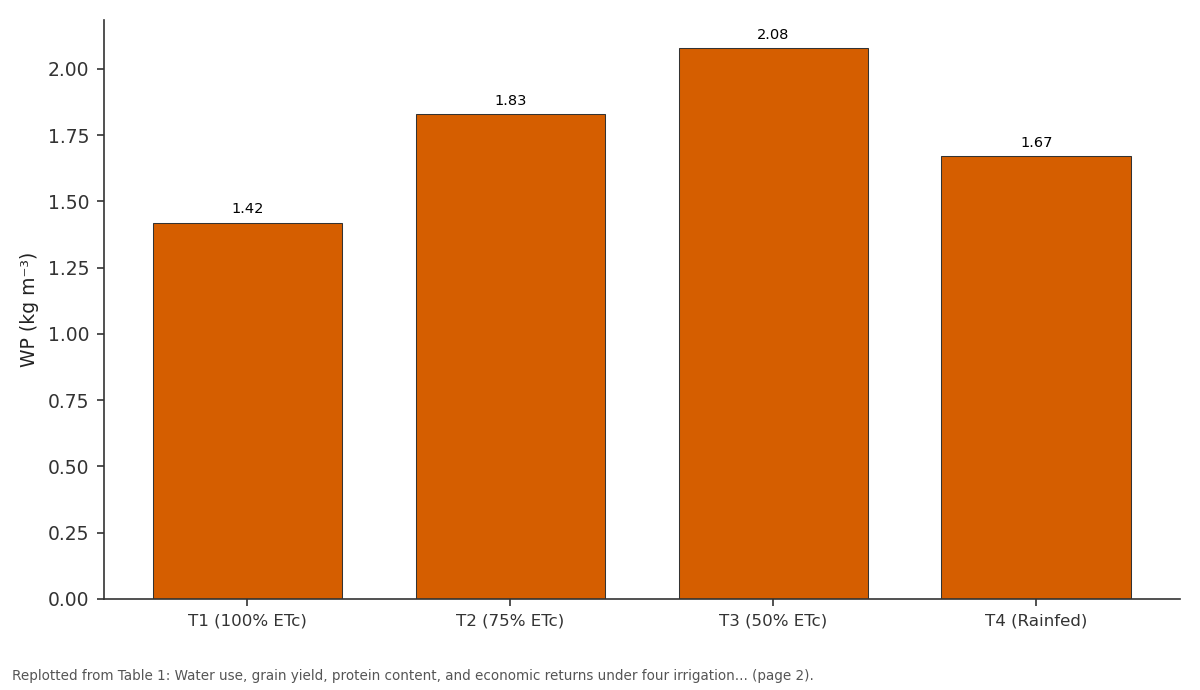
WP (kg m⁻³): T1 (100% ETc) vs T2 (75% ETc) vs T3 (50% ETc) vs T4 (Rainfed)
Replotted from Table 1 (page 2) of the original paper. Every bar is the paper's own table value.
View source evidence ↗Figures & tables
From the original paper Table 1
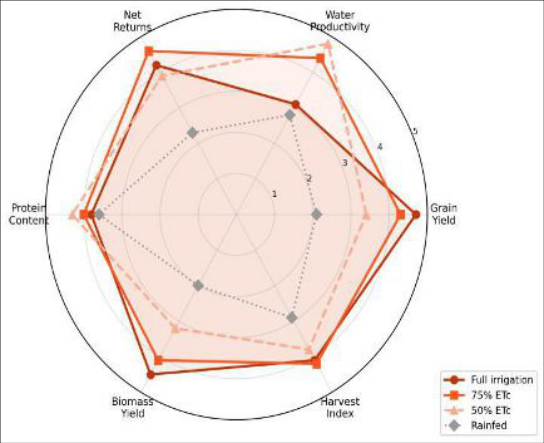 Figure 1
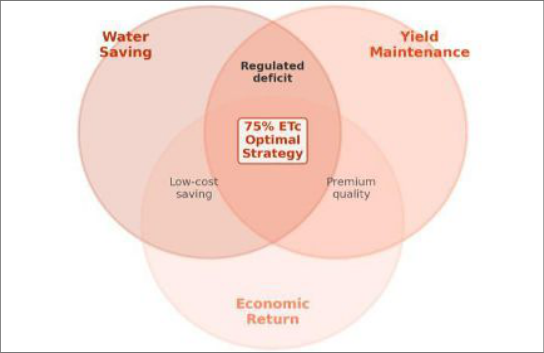 Figure 2
Introduction
Think of a farm's water supply the way a family thinks about a fixed salary: spending it all on one category might feel safe, but spreading it wisely across needs gives a better overall outcome [1] . That analogy captures the logic behind deficit irrigation (DI), which deliberately applies less water than the crop's full evapotranspiration demand and reallocates the saved volume to additional area or to critical growth stages [2,3] . In Maharashtra's Vidarbha region, canal water for rabi wheat is allocated at 500-600 mm per hectare, but actual crop ETc reaches 400-450 mm under normal conditions [4] . Farmers tend to over-irrigate during early growth and under-irrigate during grain fill, precisely the wrong sequence for wheat, where the crown-root initiation and anthesis stages are most sensitive to water stress [5,6] . Published DI trials from north-western India and the Mediterranean have shown that applying 70-80% ETc reduces yield by 5-15% but raises water productivity by 20-50%, a trade-off that is almost always economically positive [7,8] . But site-specific data from Vidarbha's black cotton soils-which have high water-holding capacity and crack during drying-are scarce [9] . This research aimed to: (a) compare four irrigation levels on wheat yield and water productivity, (b) identify the strategy that maximises net economic return per hectare, and (c) determine whether grain protein content changes under mild deficit.
Cost Analysis
Cost Analysis
Material and Methods Material
The trial was at Dr. Panjabrao Deshmukh Krishi Vidyapeeth, Akola (20.70° N, 77.02° E; 282 m a.s.l.), on a deep black cotton soil (Vertisol; clay 52%, pH 8.3, OC 0.48%). Wheat cv. AKAW-4627 was sown at 100 kg ha⁻¹ in the third week of November each year. Reference ET₀ was computed daily from an on-site automatic weather station using the FAO Penman-Monteith equation; crop ETc was derived by multiplying ET₀ by the stage-specific crop coefficient (Kc) from FAO-56 [10] . Irrigations were applied through gated pipes with measured discharge.
Methods
Four treatments-100% ETc (T 1 ), 75% ETc (T 2 ), 50% ETc (T 3 ), and rainfed (T 4 )-were arranged in a randomised complete block design with four replications on 6 × 5 m plots. Irrigation scheduling followed a soil-water-balance approach, replenishing the deficit to the prescribed ETc fraction when cumulative depletion reached 50% of available soil moisture (ASM). Soil moisture was tracked at 15 and 30 cm by gravimetric sampling twice weekly. Grain yield, straw yield, harvest index, 1000-grain weight, and grain protein (Kjeldahl N × 5.7) were recorded at maturity. Water productivity (WP) = grain yield / total water input (irrigation + effective rainfall). Data were analysed by twoway ANOVA (treatment × year) with Tukey's HSD at p ≤ 0.05.
Results
Results
Comprehensive Interpretation
The 75% ETc treatment sat at the intersection of three objectives: it saved 23.7% of water, lost only 8.5% of yield, and produced the highest net return (42,380 INR ha⁻¹). Water productivity rose from 1.42 to 1.83 kg m⁻³-a 29% gain. An unexpected bonus was a 0.8 percentage-point increase in grain protein (12.1% vs. 11.3%), consistent with the well-known concentration effect under mild water deficit [11] . The 50% ETc level maximised WP (2.08 kg m⁻³) but the 27.6% yield loss made it economically unattractive. Rainfed wheat was the least profitable despite zero irrigation cost, because yield fell below 2.2 t ha⁻¹.
Discussion
The 8.5% yield penalty at 75% ETc matches the 5-12% range from Mediterranean wheat DI trials [7,12] . On Akola's deep Vertisol, the stored moisture in the 30-60 cm zone buffered early-season deficit, allowing roots to access water that lighter soils would not hold [9] . This buffering effect likely explains why the yield loss here was at the lower end of published ranges. The protein increase under deficit has direct market implications. Wheat with >12% protein commands a premium in the Indian milling sector, and shifting from 11.3 to 12.1% could add 50-80 INR q⁻¹ above MSP [13] . If that premium were included, the BCR advantage of 75% ETc would widen further.
Limitations include the two-season, single-site scope and the absence of a phenological-staging DI treatment (e.g., full irrigation at anthesis only). Such stage-targeted strategies have shown promise in Punjab [14] and would be worth testing on Vidarbha's Vertisols, where the soil's selfmulching property may interact differently with growthstage timing.
Conclusion
Irrigating wheat at 75% ETc saved 23.7% of water, reduced yield by only 8.5%, and delivered the highest net return and BCR among all treatments. Water productivity rose 29% and grain protein increased by 0.8 percentage points. For semi-arid Vidarbha, the 75% ETc strategy is the most economically rational deficit irrigation option. Stagespecific deficit scheduling and multi-location testing should be explored next.
Figures and tables from the paper
| Treatment | Water applied (mm) | Yield (t ha⁻¹) | HI | WP (kg m⁻³) | Protein (%) | Net return (INR ha⁻¹) | BCR |
|---|---|---|---|---|---|---|---|
| T1 (100% ETc) | 471 | 4.71 | 0.42 | 1.42 | 11.3 | 40,710 | 2.37 |
| T2 (75% ETc) | 359 | 4.31 | 0.43 | 1.83 | 12.1 | 42,380 | 2.47 |
| T3 (50% ETc) | 249 | 3.41 | 0.41 | 2.08 | 12.8 | 28,940 | 2.01 |
| T4 (Rainfed) | 87* | 2.18 | 0.38 | 1.67 | 13.4 | 14,620 | 1.54 |
| CD (p=0.05) | — | 0.28 | 0.02 | 0.14 | 0.6 | — | — |
Table text extracted from the original PDF; superscript letters are shown inline. The original table image is below.
View original table image
References
20 in the original paper- English M. Deficit irrigation. I: Analytical framework. Journal of Irrigation and Drainage Engineering. 1990;116(3):399-412.
- Fereres E, Soriano MA. Deficit irrigation for reducing agricultural water use. Journal of Experimental Botany. 2007;58(2):147-159.
- Geerts S, Raes D. Deficit irrigation as an on-farm strategy to maximize crop water productivity in dry areas. Agricultural Water Management. 2009;96(9):1275-1284.
- Kharche VK, Patil SR, Kulkarni PS. Soil resource inventory of Akola district. Akola: Dr. PDKV Publication; 2014.
- Zhang H, Oweis T. Water-yield relations and optimal irrigation scheduling of wheat in the Mediterranean region. Agricultural Water Management. 1999;38(3):195-211.
- Doorenbos J, Kassam AH. Yield response to water. FAO Irrigation and Drainage Paper 33. Rome: FAO; 1979.
- Oweis T, Zhang H, Pala M. Water use efficiency of rainfed and irrigated bread wheat in a Mediterranean environment. Agronomy Journal. 2000;92(2):231-238.
- Ali MH, Hoque MR, Hassan AA, Khair A. Effects of deficit irrigation on yield, water productivity, and economic returns of wheat. Agricultural Water Management. 2007;92(3):151-161.
- Pal DK, Wani SP, Sahrawat KL. Vertisols of tropical Indian environments: pedology and edaphology. Geoderma. 2012;189-190:28-49.
- Allen RG, Pereira LS, Raes D, Smith M. Crop evapotranspiration: guidelines for computing crop water requirements. FAO Irrigation and Drainage Paper 56. Rome: FAO; 1998.
- Gooding MJ, Ellis RH, Shewry PR, Schofield JD. Effects of restricted water availability and increased temperature on the grain filling, drying and quality of winter wheat. Journal of Cereal Science. 2003;37(3):295-309.
- Kang S, Zhang L, Liang Y, Hu X, Cai H, Gu B. Effects of limited irrigation on yield and water use efficiency of winter wheat in the Loess Plateau of China. Agricultural Water Management. 2002;55(3):203-216.
- Gupta RK, Meghwal MK, Singh Y. Wheat quality in Indian perspective. In: Gupta OP et al., editors. Quality improvement of wheat. Jodhpur: Agrobios; 2013. p. 118.
- Kaur H, Humphreys E, Gill G, Kukal SS. Optimizing deficit irrigation strategies for wheat in the western Indo-Gangetic Plains. Agricultural Water Management. 2019;222:360-373.
- Pereira LS, Cordery I, Iacovides I. Coping with water scarcity: addressing the challenges. Dordrecht: Springer; 2009.
- Sadras VO, Rodriguez D. The limit to wheat water-use efficiency in eastern Australia. II. Influence of rainfall patterns. Australian Journal of Agricultural Research. 2007;58(7):657-669.
- Panda RK, Behera SK, Kashyap PS. Effective management of irrigation water for wheat under stressed conditions. Agricultural Water Management. 2003;63(1):37-56.
- Mandal KG, Hati KM, Misra AK, Bandyopadhyay KK, Mohanty M. Root biomass, crop response and wateryield relationship of mustard under combinations of irrigation scheduling and mulching in a sandy loam soil of central India. Soil and Tillage Research. 2005;83(1):33-47.
- Deng XP, Shan L, Zhang H, Turner NC. Improving agricultural water use efficiency in arid and semiarid areas of China. Agricultural Water Management. 2006;80(1):23-40.
- Fan T, Stewart BA, Payne WA, Yong W, Luo J, Gao Y. Long-term fertilizer and water availability effects on cereal yield and soil chemical properties in northwest China. Soil Science Society of America Journal. 2005;69(3):842-855.