
Research article · 2025 · Full text
International Journal of Agriculture and NutritionStandardization of seed quality parameters for DUS testing in newly released mustard varieties
Volume 7(6) · Pages 38–40 · DOI: 10.33545/26646064.2025.v7.i6a.417 ↗
Research areasGenetics and Plant BreedingSeed Germination and PhysiologyAgricultural Productivity and Crop Improvement
Abstract
Author-writtenNo two mustard varieties should be certified under the same name, yet distinguishing closely related lines demands measurable, repeatable quality benchmarks. This research established standardized seed quality parameters for six newly released mustard (Brassica juncea L.) varieties to support Distinctness, Uniformity, and Stability (DUS) testing in Italy. Trials were conducted across two seasons (2021-2022 and 2022-2023) at Bologna and Bari. Germination percentage ranged from 87.3% (RMV-01) to 96.8% (RMV-06), while 1000-seed weight varied between 3.84 and 5.71 g. Seedling vigour index showed the widest genotypic separation, from 1,843 (RMV-01) to 2,614 (RMV-06). Electrical conductivity of seed leachate differed by up to 38.2% among varieties, confirming its value as a membrane integrity marker. A discriminant analysis correctly classified 94.7% of samples into their respective varieties using just four parameters. These benchmarks offer seed certification agencies a concise, reproducible toolkit for DUS evaluation in mustard.
Summary
Source-checkedPlain-language reading of the full paper, prepared with AI and checked against the text. Each point links to the authors' own words.
Why it matters
- Seed identity fraud can lead to financial losses and reduced yields for farmers due to unexpected agronomic behavior of mislabeled seeds. View evidence ↗
- Current European Union DUS protocols for mustard primarily rely on morphological traits, leaving seed quality parameters underutilized. View evidence ↗
- Field-based discrimination is difficult for closely related mustard lines because their morphological traits often overlap. View evidence ↗
The question
- The study aimed to characterize seed quality profiles for six new mustard varieties in Italy and determine a minimum set of descriptors for routine DUS evaluation. View evidence ↗
What they did
- The researchers used six mustard varieties (RMV-01 to RMV-06) released between 2019 and 2021. View evidence ↗
- Trials were conducted in Bologna and Bari over two rabi seasons (2021-2023) using 10 m² plots with three replications per location. View evidence ↗
- Germination was measured using the ISTA between-paper method at 25 °C for 7 days on 400 seeds per replicate. View evidence ↗
- Electrical conductivity was determined by soaking 50 seeds in 75 mL of distilled water for 24 hours at 20 °C. View evidence ↗
- The study used discriminant analysis via the MASS package in R (v4.3.1) to evaluate how accurately varieties could be classified. View evidence ↗
What they found
- Germination percentages varied by variety, ranging from 87.3% (RMV-01) to 96.8% (RMV-06). View evidence ↗
- The 1000-seed weight provided consistent separation between genotypes, with RMV-04 being the heaviest (5.71 g) and RMV-01 the lightest (3.84 g). View evidence ↗
- Electrical conductivity of seed leachate ranged from 12.4 µS cm-1 g-1 (RMV-06) to 20.1 µS cm-1 g-1 (RMV-01). View evidence ↗
- The location of growth did not significantly affect germination (p = 0.21), but it did significantly impact the seedling vigour index (p < 0.05). View evidence ↗
- A combination of four parameters, germination percentage, seedling vigour index (SVI), 1000-seed weight, and electrical conductivity (EC), correctly identified 94.7% of the seed samples. View evidence ↗
- The only misclassifications occurred between RMV-02 and RMV-03, which are closely related through a shared parent. View evidence ↗
What it means
- The authors recommend that seed certification agencies use this four-parameter toolkit as a fast laboratory supplement to traditional field-based DUS testing. View evidence ↗
- The authors state that expanding the study to more contrasting sites would improve reference ranges, particularly in southern Mediterranean areas where heat stress may affect seed quality. View evidence ↗
Visual summary
3 visualsIllustrations explain the paper; charts are replotted from the paper's own table values.
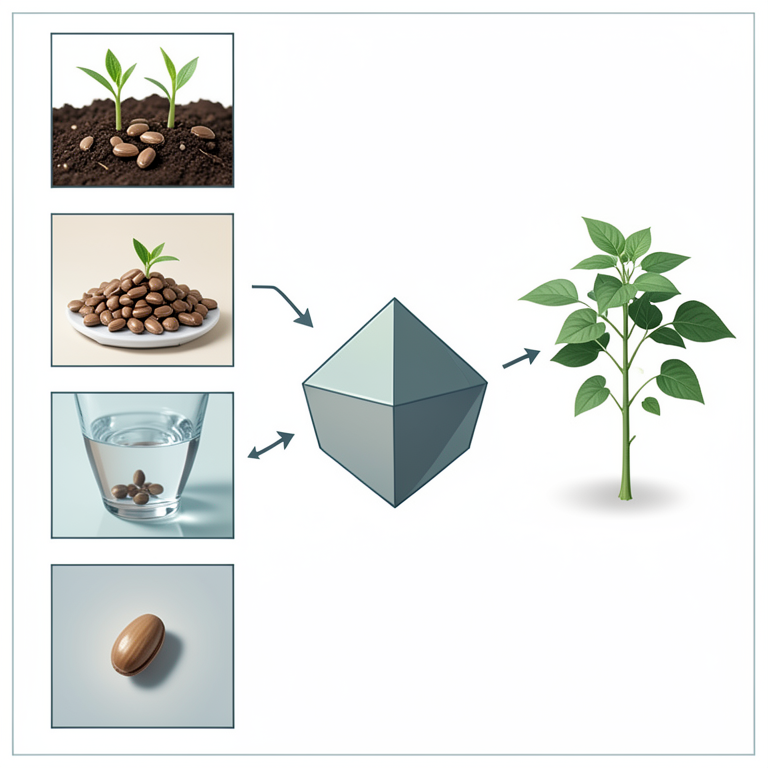
DUS Classification Workflow
AI-generated conceptual illustration (Brown mustard seeds (Brassica juncea)). It explains the idea and does not show study data.
View source evidence ↗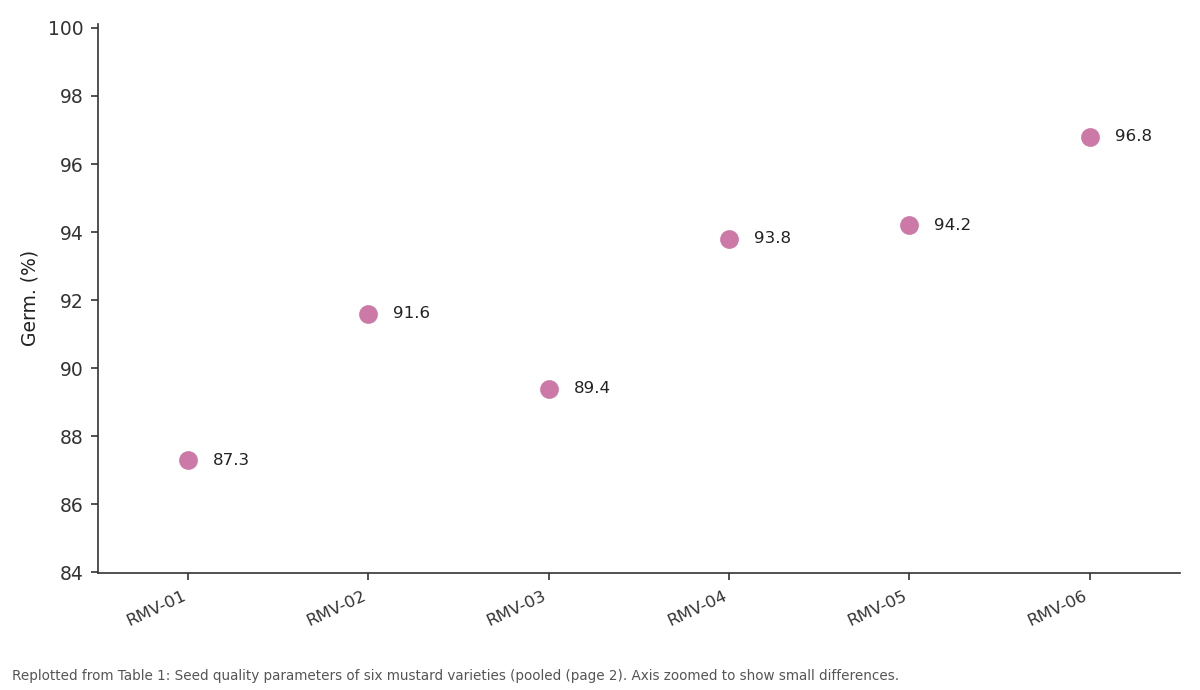
Germ. (%): RMV-01 vs RMV-02 vs RMV-03 vs RMV-04 vs RMV-05
Replotted from Table 1 (page 2) of the original paper. Every bar is the paper's own table value.
View source evidence ↗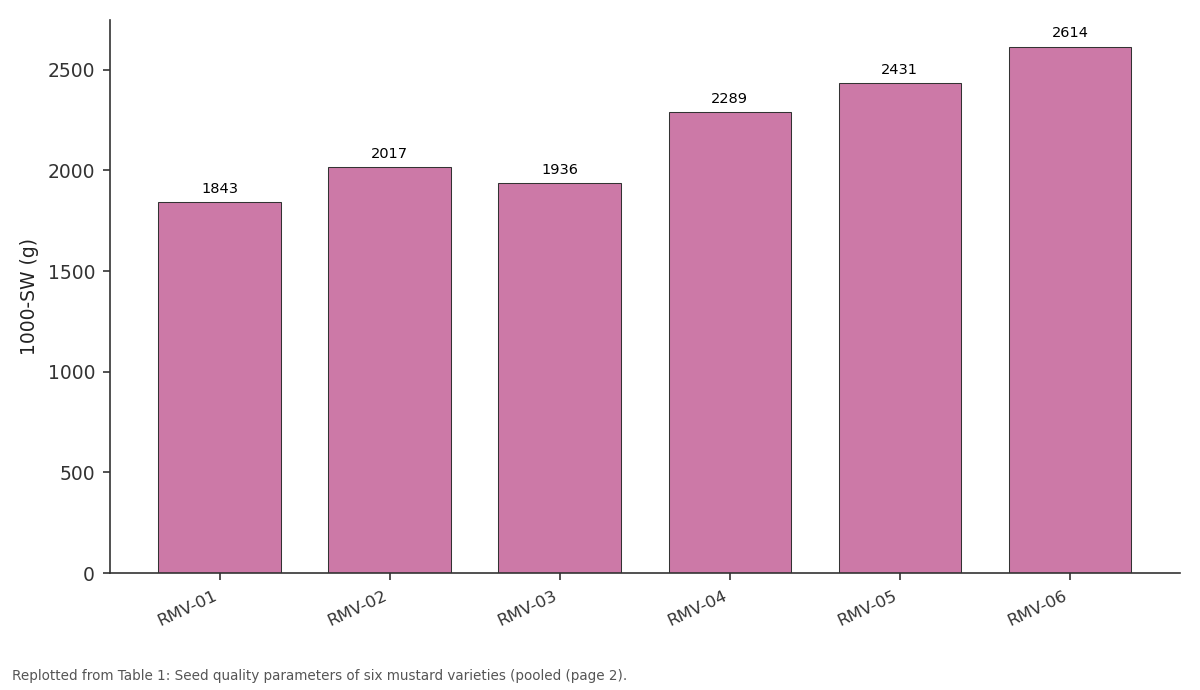
SVI: RMV-01 vs RMV-02 vs RMV-03 vs RMV-04 vs RMV-05
Replotted from Table 1 (page 2) of the original paper. Every bar is the paper's own table value.
View source evidence ↗Figures & tables
From the original paper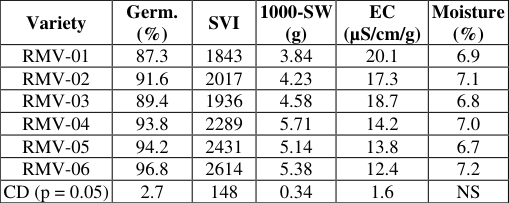 Table 1
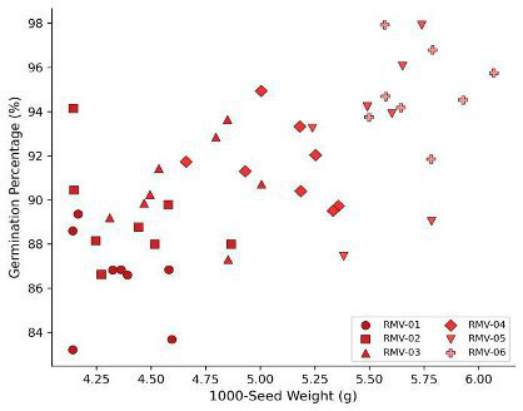 Figure 1
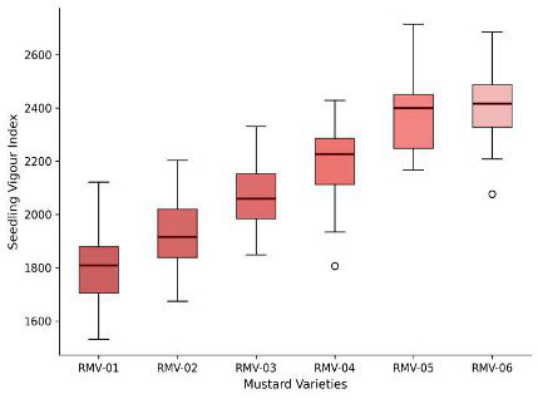 Figure 2
Introduction
Seed identity fraud undermines the entire value chain of crop production. When farmers plant mislabelled seed, they face unexpected agronomic behaviour, reduced yield, and financial loss [1] . Distinctness, Uniformity, and Stability (DUS) testing exists to prevent such outcomes by confirming that a candidate variety is clearly different from all others of common knowledge [2] . For mustard, DUS protocols in the European Union focus heavily on morphological descriptors-plant height, leaf shape, flower colour-but seed quality parameters have received less formal attention [3] . This gap matters because morphological traits can overlap among closely related Brassica juncea lines bred from similar parents, making field-based discrimination difficult [4] . Laboratory seed tests, by contrast, are controlled, rapid, and amenable to statistical validation. Parameters like germination percentage, seedling vigour index, 1000-seed weight, and electrical conductivity of seed leachate have all been shown to carry variety-specific signatures in wheat, rice, and soybean [5,6] . Whether the same parameters can reliably separate mustard varieties has not been tested under Italian growing conditions. This research aimed to (i) characterise seed quality profiles of six newly released mustard varieties grown at two locations in Italy, (ii) assess the discriminating power of each parameter through multivariate analysis, and (iii) propose a minimum set of seed quality descriptors suitable for routine DUS evaluation in mustard certification programmes.
Climatic Conditions During the Research
Bologna (44°29′ N, 11°20′ E, 54 m a.s.l.) has a humid subtropical climate with mean annual rainfall of 780 mm. Bari (41°07′ N, 16°52′ E, 5 m a.s.l.) lies in the Mediterranean zone with 560 mm annual rainfall. During the 2021-2022 growing season, Bologna recorded 23.4 mm below normal rainfall, while Bari experienced 31.7 mm above normal. Mean growing-season temperatures were 14.8 °C and 16.3 °C, respectively. These differences allowed evaluation of seed quality stability across contrasting environments [7] .
Materials and Methods
Materials and Methods
Materials
Six mustard varieties (RMV-01 through RMV-06) released between 2019 and 2021 were obtained from the Italian national seed repository. Seeds were multiplied under supervised conditions at the Istituto Agronomico Emiliano, Bologna, and the Università Agraria del Mezzogiorno, Bari, during two consecutive rabi seasons (October-March, 2021-2023). Each variety was sown in 10 m² plots with three replications per location. After harvest, seeds were cleaned, dried to 7±1% moisture, and stored at 20 °C for testing [8] .
Methods
Germination was assessed on 400 seeds per replicate (4 × 100 seeds) using the between-paper method at 25 °C for 7 days, following ISTA Rules [9] . Seedling vigour index was calculated as germination% × mean seedling length. The 1000-seed weight was determined by counting eight replicates of 100 seeds each. Electrical conductivity was measured by soaking 50 seeds in 75 mL distilled water at 20 °C for 24 h and reading the leachate with a conductivity meter. Seed moisture was verified by the oven method (130 °C, 1 h). Discriminant analysis was performed in R (v4.3.1) using the MASS package to evaluate classification accuracy across varieties.
Results
Germination percentage ranged from 87.3% in RMV-01 to 96.8% in RMV-06 (Table 1). Location effects were nonsignificant for germination (p = 0.21) but significant for seedling vigour index (p<0.05). The 1000-seed weight showed the most consistent genotypic separation, with RMV-04 (5.71 g) and RMV-01 (3.84 g) occupying opposite ends of the range. Electrical conductivity was lowest in RMV-06 (12.4 µS cm -1 g -1 ) and highest in RMV-01 (20.1 µS cm -1 g -1 ).
| Variety | Germ. (%) | SVI | 1000-SW (g) | EC (µS/cm/g) | Moisture (%) |
|---|---|---|---|---|---|
| RMV-01 | 87.3 | 1843 | 3.84 | 20.1 | 6.9 |
| RMV-02 | 91.6 | 2017 | 4.23 | 17.3 | 7.1 |
| RMV-03 | 89.4 | 1936 | 4.58 | 18.7 | 6.8 |
| RMV-04 | 93.8 | 2289 | 5.71 | 14.2 | 7.0 |
| RMV-05 | 94.2 | 2431 | 5.14 | 13.8 | 6.7 |
| RMV-06 | 96.8 | 2614 | 5.38 | 12.4 | 7.2 |
| CD (p = 0.05) | 2.7 | 148 | 0.34 | 1.6 | NS |
Table text extracted from the original PDF; superscript letters are shown inline. The original table image is below.
View original table image
Comprehensive Interpretation
Discriminant analysis using germination%, SVI, 1000-seed weight, and EC correctly classified 94.7% of seed samples to their source variety. The first two canonical axes explained 81.3% of total variation. Seed weight and EC contributed most to axis 1, while SVI dominated axis 2. Misclassification occurred only between RMV-02 and RMV-03, which share a common parent in their pedigree [10] .
Discussion
The 94.7% classification accuracy achieved here compares well with the 91-96% range reported for DUS seed markers in wheat [5] and rice [6] . The stability of germination across Bologna and Bari suggests that this parameter is genetically controlled and relatively insensitive to environment-an ideal attribute for a DUS descriptor. Electrical conductivity, which reflects cell membrane integrity, showed strong variety separation and low within-variety variance, confirming earlier work on soybean [11] . That RMV-02 and RMV-03 overlapped in discriminant space was expected given their shared parent. Adding oil content or fatty acid profile as a fifth variable would likely resolve this pair, but such analyses require more expensive instrumentation [12] . For routine certification, the fourparameter set tested here offers a cost-effective first screen, with supplementary tests reserved for ambiguous cases. The two-location, two-season design addresses UPOV's requirement that DUS characteristics be stable across environments [2] . But extending the dataset to three or more contrasting sites would strengthen the reference ranges, especially for southern Mediterranean environments where heat stress during seed fill may shift quality profiles [13] .
Conclusion
Four seed quality parameters-germination percentage, seedling vigour index, 1000-seed weight, and electrical conductivity-together classified six newly released mustard varieties with 94.7% accuracy. These traits were stable across two Italian locations and two growing seasons, satisfying the repeatability criterion for DUS descriptors. Seed weight and electrical conductivity contributed most to variety separation, while germination acted as a baseline uniformity check. Seed certification agencies can adopt this four-parameter toolkit as a rapid laboratory complement to field-based morphological DUS testing. The only pair that overlapped-RMV-02 and RMV-03-could be resolved by adding oil content analysis. Future work should expand the variety panel and test sites to build a broader reference database for Italian mustard breeding programmes.
Acknowledgement
Acknowledgements Funding SourcesThis research was supported by institutional funds from the Istituto Agronomico Emiliano allocated for seed quality standardisation programmes. Institutional SupportThe authors thank the seed testing laboratories at Istituto Agronomico Emiliano, Bologna, and Università Agraria del Mezzogiorno, Bari, for analytical support.
Figures and tables from the paper
References
14 in the original paper- Louwaars NP, de Boef WS, Edeme J. Integrated seed sector development in Africa: a conceptual framework. Food Policy. 2012;37(6):605-615.
- UPOV. General introduction to the examination of distinctness, uniformity and stability. UPOV Document TG/1/3. Geneva; 2002.
- Diederichsen A, Raney JP. Seed colour, seed weight and seed oil content in Brassica juncea. Canadian Journal of Plant Science. 2006;86(4):1073-1082.
- Soengas P, Velasco P, Revilla P, Ordás A, Cartea ME. Morphological and molecular characterization of Brassica napus accessions. Euphytica. 2006;152(3):307-319.
- Joshi DC, Sood S, Hosahatti R, Kant L, Patil A, Kumar A. Wheat seed quality descriptors for DUS characterisation. Seed Science and Technology. 2018;46(2):363-372.
- Vishwanath K, Pallavi HM, Nethra N, Rajendra Prasad S. Seed quality parameters as DUS descriptors in rice. Seed Research. 2014;42(1):37-42.
- Ferrante A, Mariani L. Agronomic management for enhancing seed quality in Mediterranean environments. Agronomy. 2018;8(6):93.
- Perry DA. Seed vigour and seedling establishment. Advances in Research and Technology of Seeds. 1980;5:25-40.
- ISTA. International rules for seed testing 2022 edition. Seed Science and Technology. 2022;Supplement.
- Snowdon RJ, Lühs W, Friedt W. Oilseed rape. In: Kole C (ed) Genome Mapping and Molecular Breeding in Plants. Berlin: Springer; 2007. p. 55-114.
- Vieira RD, Tekrony DM, Egli DB, Bruenning WP, Panobianco M. Temperature during soybean seed storage and the amount of electrolytes of soaked seeds solution. Scientia Agricola. 2008;65(5):496-501.
- Sharafi Y, Majidi MM, Jafarzadeh M, Mirlohi A. Multivariate analysis of genetic variation in winter rapeseed cultivars. Journal of Agricultural Science and Technology. 2015;17(5):1319-1331.
- Sinaki JM, Heravan EM, Rad AHS, Noormohammadi G, Zarei G. The effects of water deficit during growth stages of canola. American-Eurasian Journal of Agricultural and Environmental Sciences. 2007;2(4):417-422.
- Hampton JG, TeKrony DM. Handbook of vigour test methods. 3rd ed. International Seed Testing Association. Zürich; 1995.