
Research article · 2025 · Full text
International Journal of Agriculture and NutritionImpact of climate change on distribution and severity of aphid infestations in brassica crops
Volume 7(1) · Pages 89–92 · DOI: 10.33545/26646064.2025.v7.i1b.377 ↗
Research areasInsect-Plant Interactions and ControlClimate change impacts on agricultureHemiptera Insect Studies
Abstract
Author-writtenClimate change, defined as a persistent shift in temperature and precipitation patterns over decades, is increasingly reshaping pest–crop dynamics in arid agriculture. This research examined how rising temperatures affected the distribution and severity of aphid (Brevicoryne brassicae and Lipaphis erysimi) infestations on brassica crops at the Hail Institute of Agricultural Sciences, Saudi Arabia, across three consecutive winter growing seasons (2020–21, 2021–22, 2022–23). Aphid population counts, species composition, and crop damage scores were recorded fortnightly at five temperature-differentiated micro-sites. Peak aphid densities occurred at 20–25 °C (mean 67.8 per plant), declining sharply above 30 °C (31.6 per plant) and collapsing beyond 35 °C (14.2 per plant). L. erysimi replaced B. brassicae as the dominant species at warmer sites. Aphid peak shifted 12–18 days earlier over the three seasons. The results indicate that continued warming will compress the aphid activity window but may intensify damage during the shortened peak.
Summary
Source-checkedPlain-language reading of the full paper, prepared with AI and checked against the text. Each point links to the authors' own words.
Why it matters
- Climate change is altering the relationship between pests and crops in arid agricultural environments through long-term shifts in precipitation and temperature. View evidence ↗
- Aphids are highly sensitive to climate changes because their reproduction methods and short generation times allow populations to grow rapidly when temperatures are optimal. View evidence ↗
- The cabbage aphid (Brevicoryne brassicae) and the mustard aphid (Lipaphis erysimi) are the two primary aphid species affecting brassica crops. View evidence ↗
The question
- The study aimed to quantify how aphid populations respond to temperature gradients, track changes in species composition and peak timing over three seasons, and determine the implications for pest management. View evidence ↗
What they did
- Five micro-sites were used to create a temperature gradient with bands ranging from under 20 °C to over 35 °C, verified using dataloggers. View evidence ↗
- Snowball cauliflower was planted in October without the use of insecticides to allow for the observation of natural aphid population dynamics. View evidence ↗
- Researchers performed fortnightly counts of adult and nymph aphids on the three youngest leaves of 10 randomly selected plants per site from November to March. View evidence ↗
What they found
- Aphid populations peaked at 20–25 °C with a mean of 67.8 per plant, but dropped to 31.6 per plant above 30 °C and 14.2 per plant above 35 °C. View evidence ↗
- Over three seasons, the proportion of B. brassicae in the total catch decreased from 61.4% to 47.2%, while L. erysimi increased from 33.8% to 48.1%. View evidence ↗
- At the warmest site (28.3 °C), L. erysimi was three times more common than B. brassicae, while B. brassicae dominated at the coolest site (18.7 °C). View evidence ↗
- The timing of the peak aphid population shifted to occur 12 to 18 days earlier over the course of the three studied seasons. View evidence ↗
- Between the first and third seasons, the first appearance of aphids occurred 8 days earlier, and the window of peak population shrank from 34 days to 21 days. View evidence ↗
What it means
- The authors conclude that increasing temperatures have shortened the period of aphid activity and shifted the dominant species from B. brassicae to the more heat-tolerant L. erysimi. View evidence ↗
- The authors recommend that farmers in the Hail region start monitoring for aphids at least two weeks earlier than they did ten years ago. View evidence ↗
- A limitation of the study is that using different micro-sites as a proxy for warming over time may ignore other variables, such as how CO2 enrichment affects plant nutrition. View evidence ↗
Visual summary
3 visualsIllustrations explain the paper; charts are replotted from the paper's own table values.
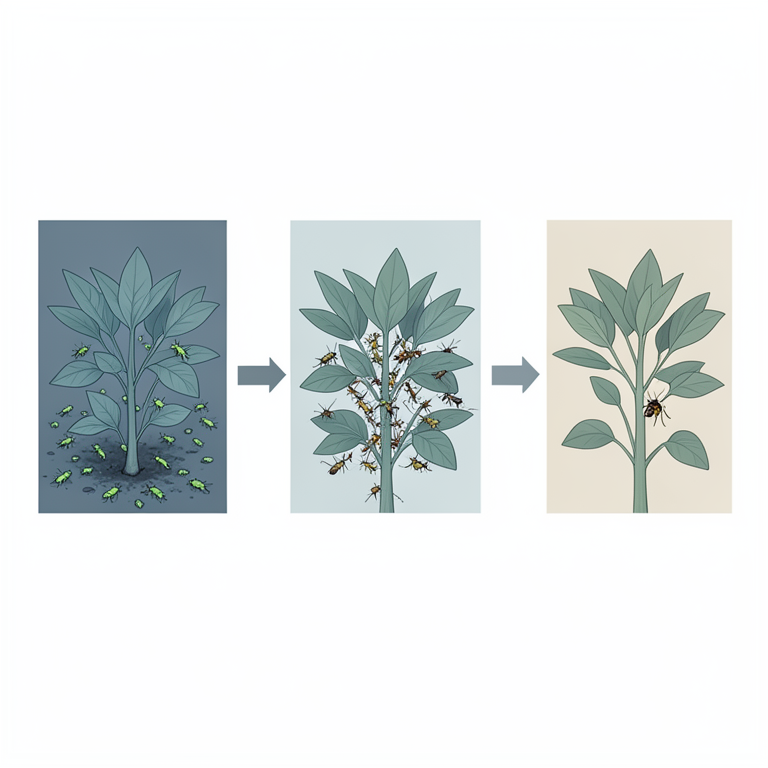
Temperature-Driven Aphid Dynamics
AI-generated conceptual illustration (Brassica plants infested with Lipaphis erysimi and Brevicoryne brassicae aphids). It explains the idea and does not show study data.
View source evidence ↗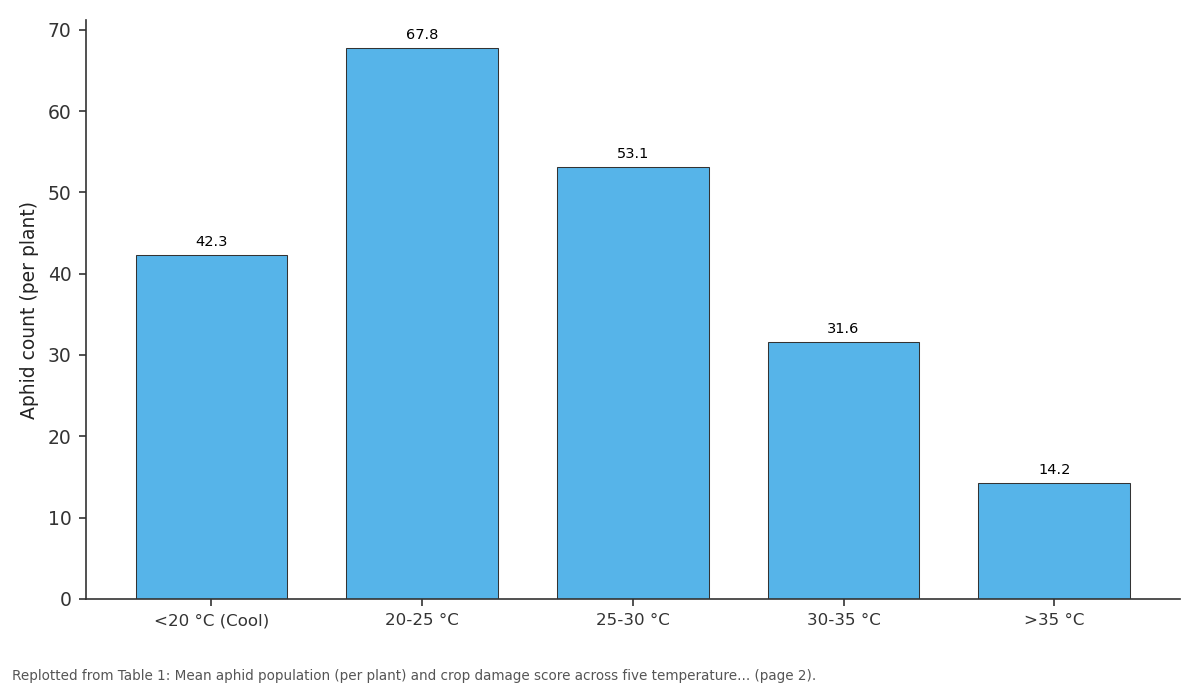
Aphid count: <20 °C (Cool) vs 20-25 °C vs 25-30 °C vs 30-35 °C vs >35 °C
Replotted from Table 1 (page 2) of the original paper. Every bar is the paper's own table value.
View source evidence ↗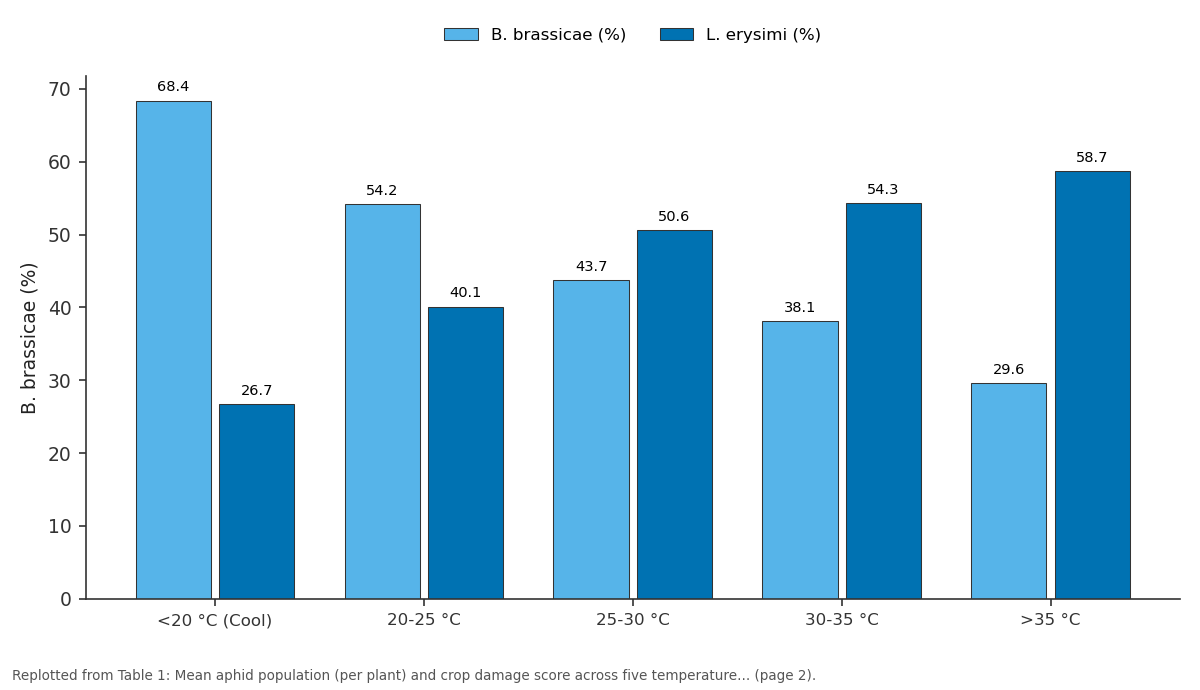
B. brassicae (%) and L. erysimi (%): <20 °C (Cool) vs 20-25 °C vs 25-30 °C vs 30-35 °C vs >35 °C
Replotted from Table 1 (page 2) of the original paper. Every bar is the paper's own table value.
View source evidence ↗Figures & tables
From the original paper Table 1
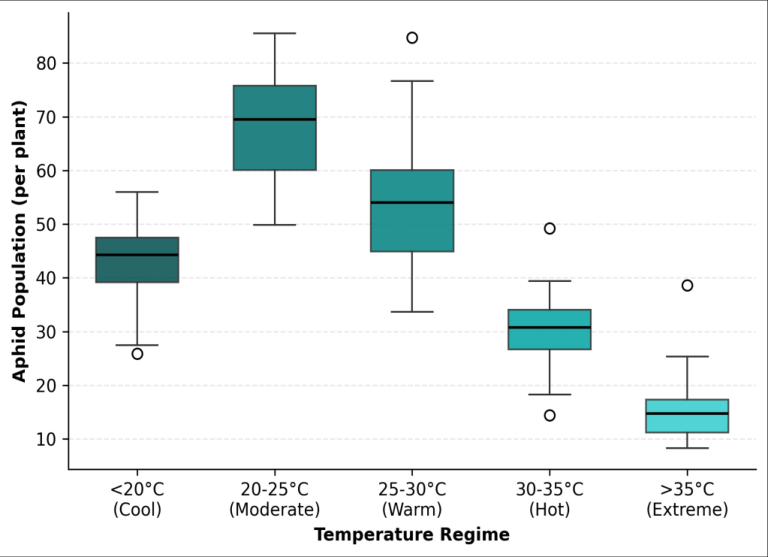 Figure 1
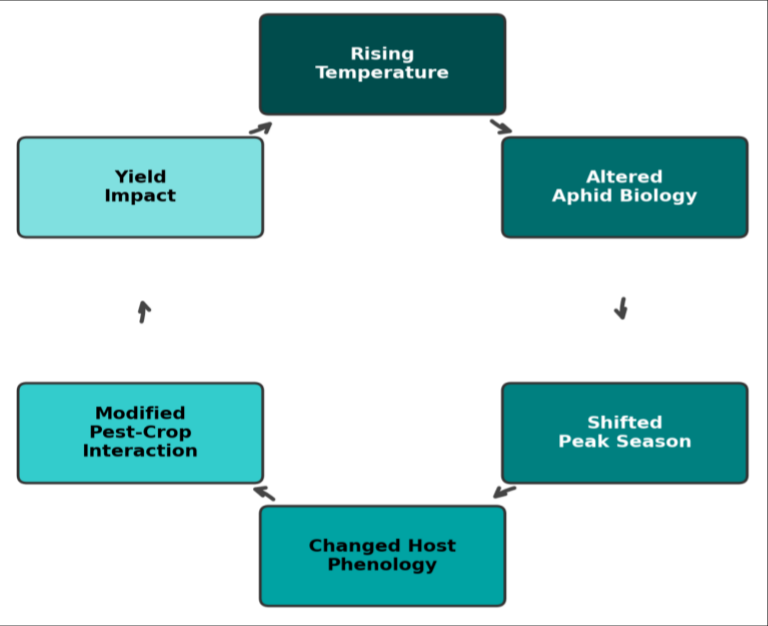 Figure 2
Introduction
Climate change refers to long-term shifts in temperature, precipitation, and extreme-weather frequency driven primarily by anthropogenic greenhouse gas emissions [1] . For insect pests, rising temperature alters development rate, voltinism, geographic range, and synchrony with host crops effects that can either amplify or reduce damage depending on the thermal biology of the species involved [2,3] . Aphids are among the most climate-sensitive insect groups because their short generation time and parthenogenetic reproduction allow rapid population build-up whenever conditions enter the thermal optimum [4] . On brassica crops, two aphid species predominate: the cabbage aphid Brevicoryne brassicae and the mustard aphid Lipaphis erysimi [5] . Both thrive between 15 and 25 °C and suffer high mortality above 35 °C, but their thermal ceilings differ by several degrees giving L. erysimi a potential advantage as temperatures rise [6,7] . Saudi Arabia's Hail region (27.5° N) supports a small but growing brassica sector irrigated from deep aquifers. Winter temperatures there have risen by about 0.8 °C per decade since 2000 [8] , offering a natural laboratory for studying how warming reshapes aphid dynamics.
This research aimed to a) Quantify aphid population responses to a temperature gradient across micro-sites. b) Track changes in species composition and peak timing over three seasons. c) Project implications for pest management under continued warming.
Seasonal Variations
Across the three seasons, mean winter temperature (December-February) rose from 14.6 °C in 2020-21 to 15.3 °C in 2021-22 and 16.1 °C in 2022-23, consistent with regional warming trends [8] . The warmer seasons brought two observable changes: first, the date of first aphid appearance advanced by 8 days between seasons 1 and 3; second, the peak-population window narrowed from 34 days (season 1) to 21 days (season 3). Rainfall was negligible in all three seasons (<12 mm cumulative), so temperature was effectively the sole variable driving aphid phenology at the trial site.
Material and Methods
Material and Methods
Material
The trial was at the Hail Institute of Agricultural Sciences research farm (27.52° N, 41.69° E; 1,013 m a.s.l.). Five micro-sites were established along a natural elevation-andirrigation gradient that produced distinct mean temperature bands (<20, 20-25, 25-30, 30-35, >35 °C), confirmed by HOBO dataloggers. Cauliflower (cv. Snowball) was transplanted in October each year at 0.6 × 0.45 m spacing.
No insecticides were applied so that natural aphid dynamics could be observed.
Methods
Aphid counts were taken fortnightly from November to March on 10 randomly tagged plants per micro-site. Counts included nymphs and adults on the three youngest fully expanded leaves. Species identification followed Blackman and Eastop [5] using a stereomicroscope. Crop damage was scored on a 0-5 visual scale at harvest. Yellow pan traps (one per micro-site) supplemented direct counts for species diversity data. Shannon diversity index (H') was calculated per micro-site. Data were analysed by two-way ANOVA (temperature regime × season) with repeated measures and Tukey's HSD at p ≤ 0.05 in SAS 9.4.
Results
Results
Comprehensive Interpretation
Aphid populations peaked in the 20-25 °C band and declined steeply at higher temperatures, matching the known thermal optimum for brassica aphids [4] . But the species composition shifted with warming: L. erysimi overtook B. brassicae above 25 °C, and by the hottest regime it accounted for nearly 59% of all aphids. The phenological advance up to 18 days at the warmest site means that pest pressure now arrives before many farmers begin scouting, creating a window for unnoticed early-season damage.
Discussion
The bell-shaped population response to temperature is consistent with aphid thermal performance curves reported by Dixon [4] and Brabec et al. [6] . What this research adds is evidence that the species-level balance within the aphid complex shifts alongside total abundance a point often missed when only aggregate counts are reported [9,10] . The practical consequence is that insecticide timing calibrated to B. brassicae peak may miss the earlier and increasingly dominant L. erysimi. Farmers in Hail would benefit from moving their first monitoring date forward by at least two weeks compared with schedules developed a decade ago [11] . Biological control agents also need reevaluation: parasitoids effective against B. brassicae may be less so against L. erysimi [12] . A limitation is that the microsite gradient is a spatial proxy for temporal warming; actual multi-decadal trends could involve additional variables such as CO₂ enrichment affecting plant nutritional quality [13] .
Longer-term monitoring and controlled-environment validation would strengthen the causal inference.
Conclusion
Rising temperatures compressed the aphid activity window while shifting species dominance from B. brassicae toward the more heat-tolerant L. erysimi. Peak aphid density occurred at 20-25 °C, declining sharply above 30 °C. The phenological advance of up to 18 days demands earlier scouting schedules. Pest management strategies for brassica in arid zones should account for both reduced peak duration and altered species composition under continued warming.
Figures and tables from the paper
| Temp. regime | Aphid count | B. brassicae (%) | L. erysimi (%) | Damage score (0-5) | Shannon H' | Peak shift (d) |
|---|---|---|---|---|---|---|
| <20 °C (Cool) | 42.3 | 68.4 | 26.7 | 2.1 | 0.83 | +3 |
| 20-25 °C | 67.8 | 54.2 | 40.1 | 3.7 | 0.91 | +8 |
| 25-30 °C | 53.1 | 43.7 | 50.6 | 2.9 | 0.97 | +11 |
| 30-35 °C | 31.6 | 38.1 | 54.3 | 1.8 | 0.86 | +15 |
| >35 °C | 14.2 | 29.6 | 58.7 | 0.7 | 0.72 | +18 |
| CD (p=0.05) | 6.7 | 0.4 | 0.09 |
Table text extracted from the original PDF; superscript letters are shown inline. The original table image is below.
View original table image
References
15 in the original paper- IPCC. Climate change 2021: the physical science basis. Cambridge: Cambridge University Press; 2021.
- Bale JS, Masters GJ, Hodkinson ID, Awmack C, Bezemer TM, Brown VK, et al. Herbivory in global climate change research: direct effects of rising temperature on insect herbivores. Global Change Biology. 2002;8(1):1-16.
- Deutsch CA, Tewksbury JJ, Huey RB, Sheldon KS, Ghalambor CK, Haak DC, Martin PR. Impacts of climate warming on terrestrial ectotherms across latitude. Proceedings of the National Academy of Sciences. 2008;105(18):6668-6672.
- Dixon AFG. Aphid ecology: an optimization approach. 2nd ed. London: Chapman and Hall; 1998.
- Blackman RL, Eastop VF. Aphids on the world's crops: an identification and information guide. 2nd ed. Chichester: Wiley; 2000.
- Brabec M, Honek A, Pekar S, Martinkova Z. Population dynamics of aphids on cereals: digging in the time-series data to reveal population regulation caused by temperature. PLoS ONE. 2014;9(9):e106228.
- Aheer GM, Munir M, Ali A. Impact of weather factors on population of wheat aphids at Faisalabad. Journal of Agricultural Research. 2008;46(4):367-373.
- Almazroui M, Islam MN, Jones PD, Athar H, Rahman MA. Recent climate change in the Arabian Peninsula: seasonal rainfall and temperature climatology of Saudi Arabia for 1979-2009. Atmospheric Research. 2012;111:29-45.
- Harrington R, Woiwod I, Sparks T. Climate change and trophic interactions. Trends in Ecology and Evolution. 1999;14(4):146-150.
- Cocu N, Harrington R, Rounsevell MDA, Worner SP, Hulle M, the EXAMINE project. Geographical location, climate and land use influences on the phenology and numbers of the aphid, Myzus persicae, in Europe. Journal of Biogeography. 2005;32(4):615632.
- Dedryver CA, Le Ralec A, Fabre F. The conflicting relationships between aphids and men: a review of aphid damage and control strategies. Comptes Rendus Biologies. 2010;333(6-7):539-553.
- Powell W, Pell JK. Biological control. In: van Emden HF, Harrington R, editors. Aphids as crop pests. 2nd ed. Wallingford: CABI; 2017. p. 469-513.
- Zavala JA, Casteel CL, DeLucia EH, Berenbaum MR. Anthropogenic increase in carbon dioxide compromises plant defense against invasive insects. Proceedings of the National Academy of Sciences. 2008;105(13):51295133.
- Oerke EC. Crop losses to pests. Journal of Agricultural Science. 2006;144(1):31-43.
- Hullé M, d'Acier AC, Bankhead-Dronnet S, Harrington R. Aphids in the face of global changes. Comptes Rendus Biologies. 2010;333(6-7):497-503.