
Research article · 2025 · Full text
International Journal of Agriculture and NutritionAssessment of genetic diversity among mungbean accessions using morphological and molecular markers
Volume 7(2) · Pages 102–105 · DOI: 10.33545/26646064.2025.v7.i2b.465 ↗
Research areasGenetic and Environmental Crop StudiesGenetics and Plant BreedingGenetic Mapping and Diversity in Plants and Animals
Abstract
Author-writtenA paradox of mungbean breeding is that despite India being the crop's centre of diversity, the genetic base of released varieties has been steadily narrowing. This research assessed genetic diversity among 40 mungbean accessions from seven Indian states using 12 quantitative morphological traits and 20 SSR molecular markers. Morphological analysis using Mahalanobis D² distance grouped accessions into four clusters, with inter-cluster distance ranging from 14.8 to 42.6. Molecular analysis with SSR markers detected 78 alleles with a mean Polymorphism Information Content (PIC) of 0.54. UPGMA clustering based on molecular data largely confirmed morphological groupings, with 82.5% concordance. Accessions from the Western Ghats region (Karnataka, Kerala) formed a distinct cluster with the highest within-group diversity. Crosses between clusters I and IV, which showed the maximum inter-cluster distance, are recommended for heterosis exploitation. The combined morphological-molecular approach provided a more complete diversity picture than either method alone.
Summary
Source-checkedPlain-language reading of the full paper, prepared with AI and checked against the text. Each point links to the authors' own words.
Why it matters
- India is a primary global producer of mungbean and possesses extensive germplasm, but the genetic diversity of its commercial varieties has become dangerously limited. View evidence ↗
- The narrow genetic base is evidenced by the fact that over 60% of the genetic background of the 25 most common Indian mungbean varieties comes from only four ancestral lines. View evidence ↗
- This reduction in genetic diversity makes the crop more susceptible to environmental and biological stresses and hinders yield improvements via traditional hybridization. View evidence ↗
The question
- The study aimed to characterize 40 mungbean accessions using morphological and molecular markers to find divergent groups for hybridization and test how well the two clustering methods agree. View evidence ↗
What they did
- The researchers employed Mahalanobis D² analysis to group the accessions based on their morphological characteristics. View evidence ↗
What they found
- Morphological analysis categorized the accessions into four distinct clusters, with inter-cluster distances between 14.8 and 42.6. View evidence ↗
- Cluster III exhibited the highest average yield per plant (9.24 g), whereas Cluster IV showed the highest protein content (25.3%) and largest seed size (4.68 g per 100 seeds). View evidence ↗
- Molecular analysis identified 78 alleles with a mean PIC of 0.54, indicating that the SSR panel had moderately high informativeness. View evidence ↗
- The average Shannon's diversity index for morphological traits was 1.87, with pods per plant being the most diverse trait (H = 2.14) and days to maturity the least (H = 1.23). View evidence ↗
- There was a significant correlation (r = 0.68) between morphological and molecular data, with 82.5% agreement in how accessions were assigned to clusters. View evidence ↗
- The greatest distance between clusters was found between Cluster I and Cluster IV (42.6), suggesting these are the most divergent groups. View evidence ↗
What it means
- The authors recommend crossing Cluster I (high yield) with Cluster IV (high protein and large seeds) to improve both yield and nutrition. View evidence ↗
- The authors conclude that combining morphological and molecular markers provides a more complete picture of diversity and should be the standard for mungbean breeding. View evidence ↗
- The authors note that the 17.5% disagreement between morphological and molecular clustering is likely due to the influence of the environment on field-measured traits. View evidence ↗
Visual summary
3 visualsIllustrations explain the paper; charts are replotted from the paper's own table values.
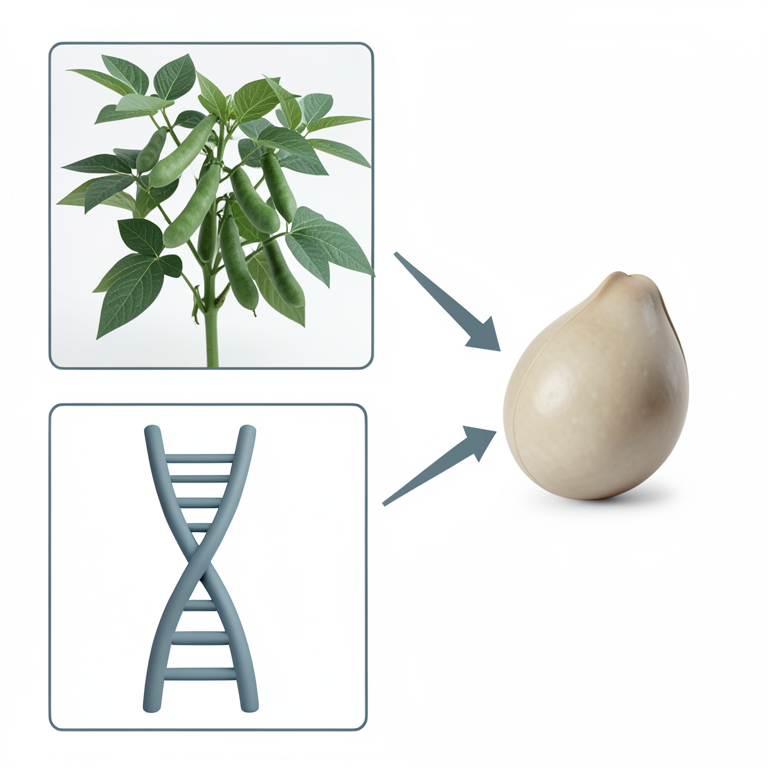
Combined Diversity Assessment Framework
AI-generated conceptual illustration (mungbean plants (Vigna radiata)). It explains the idea and does not show study data.
View source evidence ↗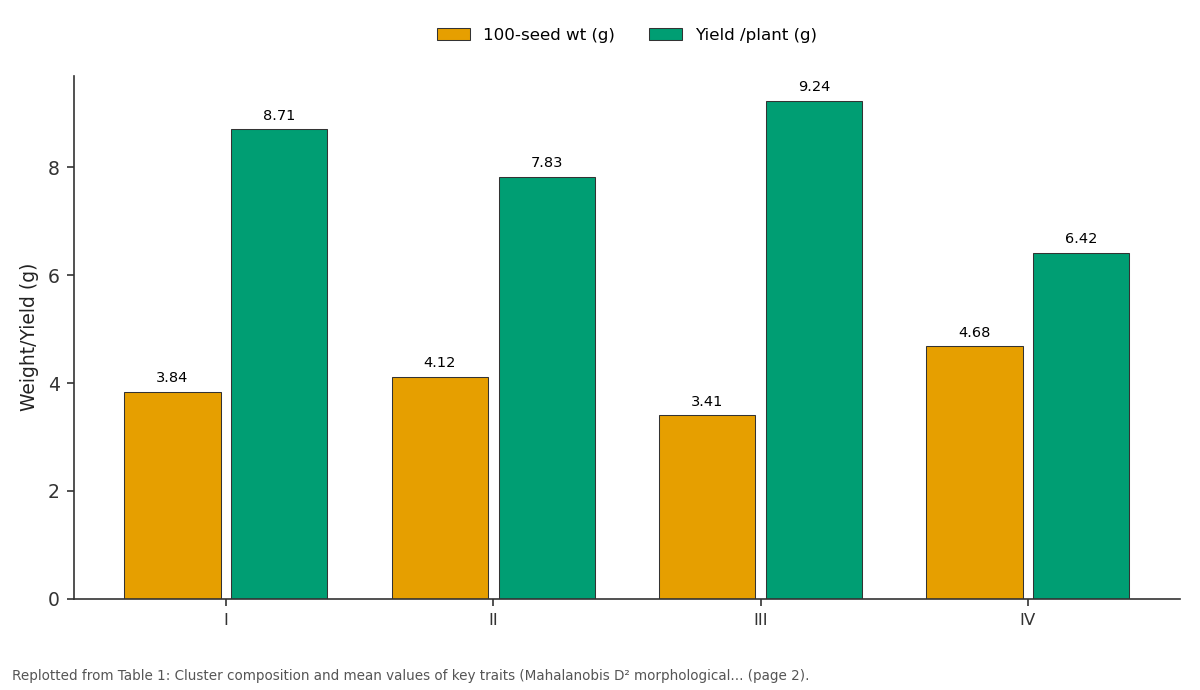
100-seed wt (g) and Yield /plant (g): I vs II vs III vs IV
Replotted from Table 1 (page 2) of the original paper. Every bar is the paper's own table value.
View source evidence ↗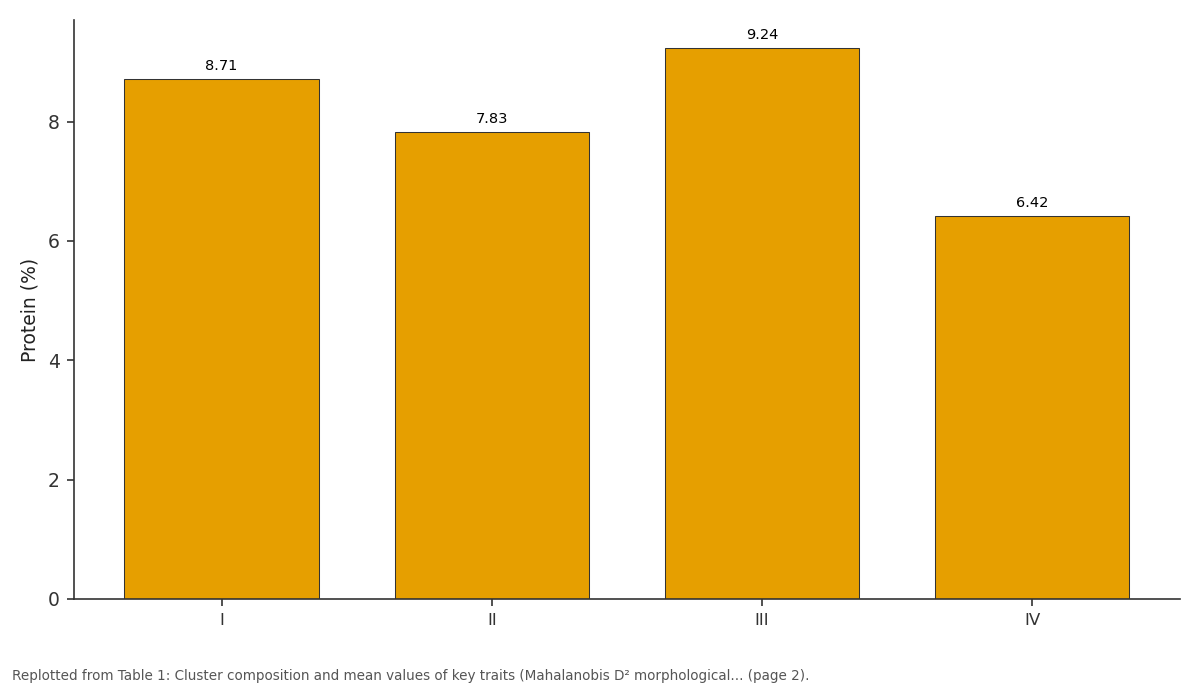
Yield /plant (g): I vs II vs III vs IV
Replotted from Table 1 (page 2) of the original paper. Every bar is the paper's own table value.
View source evidence ↗Figures & tables
From the original paper Table 1
 Table 2
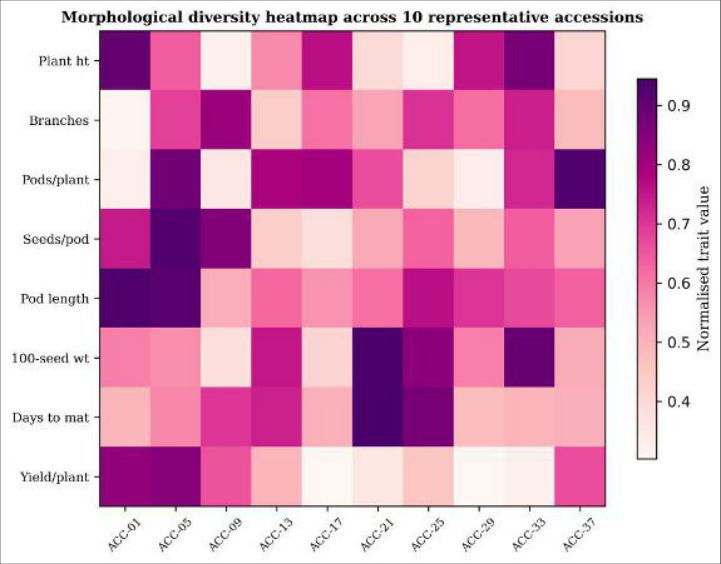 Figure 1
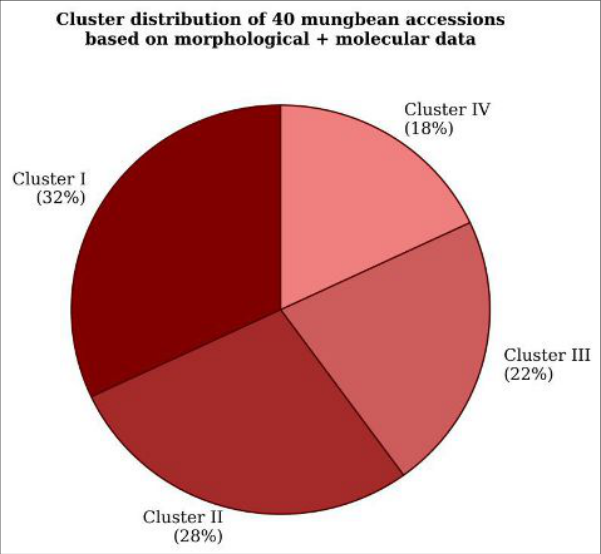 Figure 2
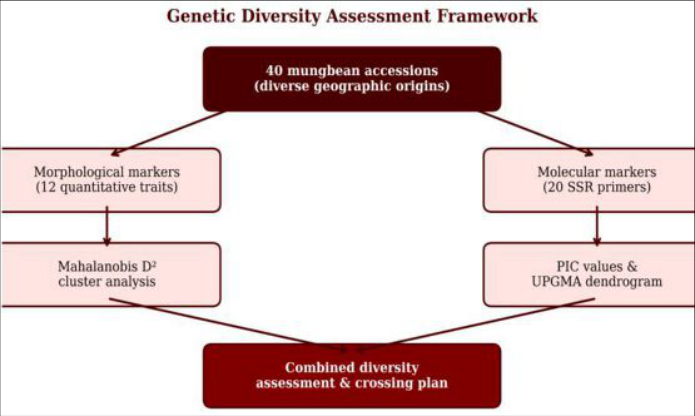 Figure 3
Introduction
Here's a paradox: India produces 70% of the world's mungbean (Vigna radiata L. Wilczek), holds the richest germplasm collections, and yet the genetic base of its commercial varieties is alarmingly narrow [1] . Pedigree analysis of the 25 most widely grown Indian mungbean varieties reveals that just four ancestral lines contribute over 60% of the genetic background [2] . This narrowing increases vulnerability to biotic and abiotic stresses and limits the scope for yield improvement through conventional hybridisation [3] . Assessing diversity among available germplasm is the first step toward broadening this base. Morphological characterisation is straightforward and inexpensive but can be influenced by environment and growth conditions [4] . DNA-based molecular markers such as SSRs are environment-independent, co-dominant, and highly polymorphic, making them ideal complements to morphological data [5] . Combining both marker types gives a more complete diversity picture than either alone [6] . This research characterised 40 mungbean accessions using both approaches to identify divergent groups suitable for hybridisation and to evaluate the concordance between morphological and molecular clustering.
Material and Methods
Material and Methods
Material
Forty mungbean accessions were obtained from the germplasm collections at UAHS Shivamogga (22 accessions from Karnataka, Kerala, Tamil Nadu) and ANGRAU Tirupati (18 accessions from Andhra Pradesh, Telangana, Maharashtra, Rajasthan). The field experiment was conducted during kharif 2022 at UAHS Shivamogga (13°56′N, 75°34′E). Molecular work was done at the biotechnology laboratory of ANGRAU Tirupati. Twenty SSR primer pairs, selected for high PIC in previous mungbean research, were sourced from Eurofins Genomics India [5,6] .
Methods
The field trial followed an augmented block design with three checks replicated in each block. Twelve quantitative traits were recorded: plant height, branches per plant, days to 50% flowering, days to maturity, pods per plant, pod length, seeds per pod, 100-seed weight, seed yield per plant, biological yield, harvest index, and protein content.
Mahalanobis D² analysis was used for morphological clustering and path analysis for yield component contribution [7] . Genomic DNA was extracted from young leaves using the CTAB method. SSR amplification was performed in 20 μL reactions with an annealing temperature gradient of 50-58°C depending on primer. Allele scoring was done on 3% agarose gels stained with ethidium bromide. PIC, heterozygosity, and Nei's genetic distance were calculated using PowerMarker 3.25. UPGMA dendrograms were constructed in MEGA 11 [8,9] .
Concordance between morphological and molecular clustering was assessed by the Mantel test (p<0.01).
Diversity assessment indices
Shannon's diversity index (H) across the 12 morphological traits averaged 1.87, with the highest diversity for pods per plant (H = 2.14) and the lowest for days to maturity (H = 1.23). Coefficient of variation ranged from 8.7% (days to maturity) to 38.4% (seed yield per plant), indicating that yield and yield components were more variable than phenological traits. At the molecular level, the mean number of alleles per locus was 3.9, with observed heterozygosity (Ho) of 0.12 and expected heterozygosity (He) of 0.58, confirming predominantly self-pollinating mating system with substantial allelic diversity maintained among accessions [5,6] .
Results
Table 0.00-0.28 0.12 DMBSSR18 (0.28) Multiple (0.00) Mean PIC of 0.54 indicates moderately high informativeness of the selected SSR panel. The Mantel test showed significant correlation (r = 0.68, p<0.01) between morphological and molecular distance matrices, with 82.5% concordance in cluster assignment
Discussion
The mean PIC of 0.54 is comparable to values reported for mungbean SSR panels in Southeast Asian germplasm (0.48-0.61) and indicates adequate discriminating power for diversity assessment [5,6] . The 82.5% concordance between morphological and molecular clustering is relatively high for a self-pollinating species and suggests that the 12 morphological traits captured much of the underlying genetic variation. The remaining 17.5% discordance likely reflects environmental plasticity in field-measured traits [4] . The maximum inter-cluster D² distance between clusters I and IV (42.6) suggests that crosses between these groups would generate the widest segregation and best prospects for transgressive selection [7] .
Conclusion
Forty mungbean accessions showed substantial genetic diversity at both morphological and molecular levels. Four distinct clusters were identified, with Western Ghats accessions forming the most diverse group. Crosses between clusters I (high yield) and IV (high protein, large seeds) are recommended for simultaneous improvement of yield and nutritional quality. The combined marker approach is more informative than either method alone and should become standard practice in mungbean breeding programmes.
Figures and tables from the paper
| Cluster | No. of acc. | Pods /plant | Seeds /pod | 100-seed wt (g) | Yield /plant (g) | Protein (%) | Geographic origin |
|---|---|---|---|---|---|---|---|
| I | 13 | 28.4 | 10.2 | 3.84 | 8.71 | 22.4 | Karnataka, Kerala |
| II | 11 | 22.7 | 9.8 | 4.12 | 7.83 | 23.8 | AP, Telangana |
| III | 9 | 31.6 | 11.4 | 3.41 | 9.24 | 21.1 | Maharashtra, Rajasthan |
| IV | 7 | 18.3 | 8.7 | 4.68 | 6.42 | 25.3 | Mixed origins |
Table text extracted from the original PDF; superscript letters are shown inline. The original table image is below.
View original table image
| Parameter | Range | Mean | Highest locus | Lowest locus |
|---|---|---|---|---|
| Alleles per locus | 2-7 | 3.9 | CEDG084 (7) | VrSSR01 (2) |
| PIC | 0.21-0.82 | 0.54 | CEDG084 (0.82) | VrSSR01 (0.21) |
| Nei's gene diversity | 0.24-0.84 | 0.58 | CEDG084 (0.84) | VrSSR01 (0.24) |
| Observed heterozygosity | 0.00-0.28 | 0.12 | DMBSSR18 (0.28) | Multiple (0.00) |
Table text extracted from the original PDF; superscript letters are shown inline. The original table image is below.
View original table image
References
19 in the original paper- Nair RM, Yang RY, Easdown WJ, Thavarajah D, Thavarajah P, Hughes JDA, Keatinge JDH. Biofortification of mungbean (Vigna radiata) as a whole food to enhance human health. Journal of the Science of Food and Agriculture. 2013;93(8):18051813.
- Dikshit HK, Singh D, Singh A, Jain N, Kumari J, Sharma TR. Utility of RAPD and ISSR markers for assessment of genetic diversity in mungbean. Indian Journal of Genetics. 2012;72(3):322-327.
- Somta P, Srinives P. Genome research in mungbean [Vigna radiata (L.) Wilczek] and blackgram [V. mungo (L.) Hepper]. ScienceAsia. 2007;33(Suppl 1):69-74.
- Rao GR, Rao YK, Rao CM. Genetic divergence in mungbean. Indian Journal of Pulses Research. 2006;19(1):61-63.
- Tangphatsornruang S, Srinives P, Theerakulpisut P, Kamolsukyunyong W, Wongniam S, Kositratana W. Development and characterization of microsatellite markers in mungbean. Molecular Ecology Notes. 2007;7(6):1235-1238.
- Gwag JG, Chung JW, Chung HK, Lee JH, Ma KH, Dixit A, Park YJ, Cho EG, Kim TS, Lee SH. Characterization of new microsatellite markers in mung bean, Vigna radiata (L.). Molecular Ecology Notes. 2006;6(4):1132-1134.
- Mahalanobis PC. On the generalised distance in statistics. Proceedings of the National Institute of Sciences India. 1936;2:49-55.
- Liu K, Muse SV. PowerMarker: an integrated analysis environment for genetic marker analysis. Bioinformatics. 2005;21(9):2128-2129.
- Tamura K, Stecher G, Kumar S. MEGA11: Molecular Evolutionary Genetics Analysis Version 11. Molecular Biology and Evolution. 2021;38(7):3022-3027.
- Wilczek) collections and its implication in breeding programmes. Genetic Resources and Crop Evolution. 1998;45(5):467-474.
- Kaga A, Tomooka N, Egawa Y, Hosaka K, Kamijima O. Species relationships in the subgenus Ceratotropis (genus Vigna) as revealed by RAPD analysis. Euphytica. 1996;88(1):17-24.
- Singh DP. Mungbean. In: Gupta SK (ed.). Breeding of Field Crops. Agrobios, Jodhpur. 2005;pp.199-222.
- Tomooka N, Vaughan DA, Moss H, Maxted N. The Asian Vigna: Genus Vigna subgenus Ceratotropis Genetic Resources. Kluwer Academic Publishers, Dordrecht. 2002.
- Nei M. Analysis of gene diversity in subdivided populations. Proceedings of the National Academy of Sciences. 1973;70(12):3321-3323.
- Botstein D, White RL, Skolnick M, Davis RW. Construction of a genetic linkage map in man using restriction fragment length polymorphisms. American Journal of Human Genetics. 1980;32(3):314-331.
- Kumar J, Pratap A, Kumar S. Plant phenomics: an overview. In: Kumar J (ed.). Phenomics in Crop Plants: Trends, Options and Limitations. Springer, New Delhi. 2015;pp.1-12.
- Mantel N. The detection of disease clustering and a generalized regression approach. Cancer Research. 1967;27(2):209-220.
- Kaewwongwal A, Chen J, Somta P, Kongjaimun A, Yimram T, Chen X, et al. Novel alleles of two tightly linked genes encoding polygalacturonase-inhibiting proteins (VrPGIP1 and VrPGIP2) associated with the Br locus that confer bruchid resistance to mungbean. Molecular Breeding. 2017;37(7):87.
- Choudhary S, Gaur R, Gupta S, Bhatia S. EST-derived genic molecular markers: development and utilization for generating an advanced transcript map of chickpea. Theoretical and Applied Genetics. 2012;124(8):14491462.