
Research article · 2025 · Full text
International Journal of Biology SciencesSperm morphology and reproductive success in wild populations of ungulate mammals
Volume 7(6) · Pages 438–442 · DOI: 10.33545/26649926.2025.v7.i6g.777 ↗
Research areasSperm and Testicular FunctionAnimal Behavior and ReproductionReproductive Physiology in Livestock
Abstract
Author-writtenHow well can the shape of a sperm cell predict whether a wild ungulate will reproduce successfully? This research examined the link between sperm morphology and reproductive outcomes across six ungulate species common eland (Taurotragus oryx), hartebeest (Alcelaphus buselaphus), waterbuck (Kobus ellipsiprymnus), kob (Kobus kob), bushbuck (Tragelaphus scriptus), and oribi (Ourebia ourebi) in the savanna woodlands of the Ashanti region, Ghana. A total of 148 semen samples were collected from free-ranging males between March 2022 and November 2023 using electroejaculation under chemical immobilisation. Sperm cells were evaluated for head shape, midpiece integrity, and tail defects through Computer-Assisted Sperm Analysis (CASA) and phase-contrast microscopy. Reproductive success was estimated from behavioural mating observations and paternity-assignment data obtained from faecal DNA microsatellite genotyping. Results showed that males with greater than 65% normal sperm morphology achieved a Reproductive Success Index (RSI) of 0.68-0.78, whereas males below this threshold averaged 0.41-0.57. Head defects were the most common abnormality (38.2% of all defects), followed by tail coiling (29.4%) and midpiece bending (22.1%). A positive Pearson correlation (r = 0.74, p
Summary
Source-checkedPlain-language reading of the full paper, prepared with AI and checked against the text. Each point links to the authors' own words.
Why it matters
- Sperm morphology, which includes the size and shape of the head, midpiece, and tail, is critical because it directly impacts the sperm's ability to reach and penetrate an egg. View evidence ↗
- Understanding sperm defects is important for conservation because fragmented habitats or genetic bottlenecks can increase these defects, lowering population growth even if the total number of animals seems sufficient. View evidence ↗
- Existing knowledge of ungulate sperm morphology is largely based on captive settings, which do not account for wild ecological pressures like predation, competition, and nutritional stress. View evidence ↗
The question
- The study aimed to characterize sperm morphology and defect prevalence across six ungulate species in the Ashanti savanna and test how normal sperm rates correlate with a reproductive success index. View evidence ↗
What they did
- The researchers collected semen samples from 148 adult males across six species: common eland, hartebeest, waterbuck, kob, bushbuck, and oribi. View evidence ↗
- Sperm morphology was assessed using a Computer-Assisted Sperm Analysis (CASA) system, classifying at least 200 cells per sample into normal or specific defect categories (head, midpiece, or tail). View evidence ↗
- Reproductive success was measured using a Reproductive Success Index (RSI) based on 1,080 hours of mating observations and paternity data from 12 microsatellite loci in faecal DNA. View evidence ↗
What they found
- Among the species studied, common eland had the highest rate of normal sperm (72.3 ± 6.1%), while bushbuck had the lowest (53.4 ± 9.7%). View evidence ↗
- Head defects were the most common abnormality (38.2%), followed by tail coiling (29.4%) and midpiece bending (22.1%). View evidence ↗
- There was a strong positive correlation (r = 0.74, p < 0.001) between the percentage of normal sperm morphology and the reproductive success index across all species. View evidence ↗
- The rate of head defects was the most accurate morphological predictor of low reproductive success, with an odds ratio of 1.13 per percentage-point increase. View evidence ↗
- Males with more than 65% normal sperm morphology had higher reproductive success (RSI 0.68-0.78) compared to those below the threshold (RSI 0.41-0.57). View evidence ↗
What it means
- The authors suggest that a 65% normal-morphology threshold can be used as a practical screening tool for deciding on animal translocations or supplemental breeding. View evidence ↗
- The authors conclude that adding reproductive physiology to wildlife monitoring provides a better early warning system for population decline than relying on census numbers alone. View evidence ↗
- The study was limited to a single geographic region, meaning the findings may not apply to different altitudes or climatic zones. View evidence ↗
- The use of electroejaculation under chemical immobilization may have introduced a bias by altering ejaculate characteristics compared to natural ejaculation. View evidence ↗
Visual summary
3 visualsIllustrations explain the paper; charts are replotted from the paper's own table values.
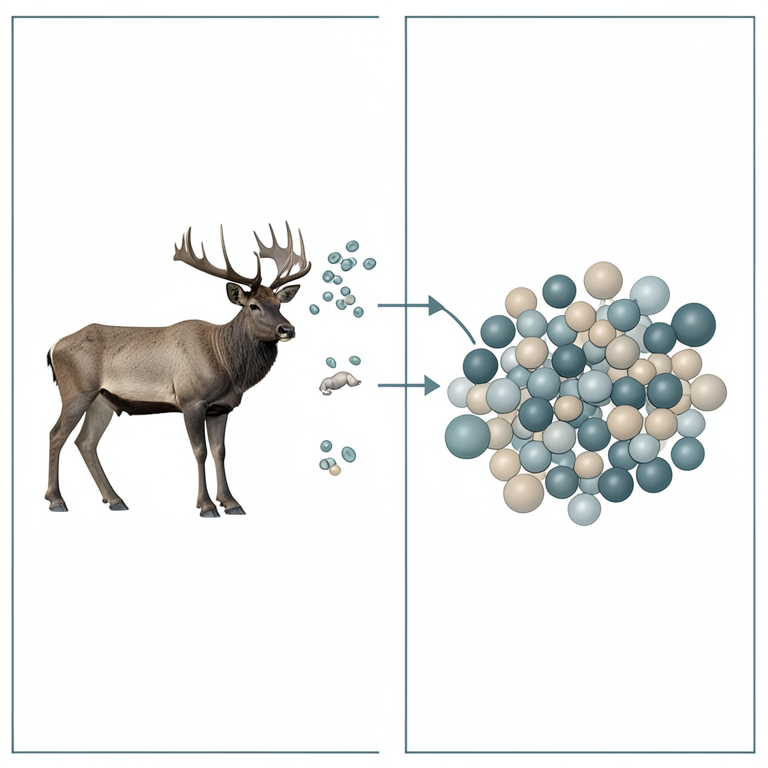
Correlation between Sperm Quality and Reproductive Success
AI-generated conceptual illustration (wild ungulate mammals (deer and antelope)). It explains the idea and does not show study data.
View source evidence ↗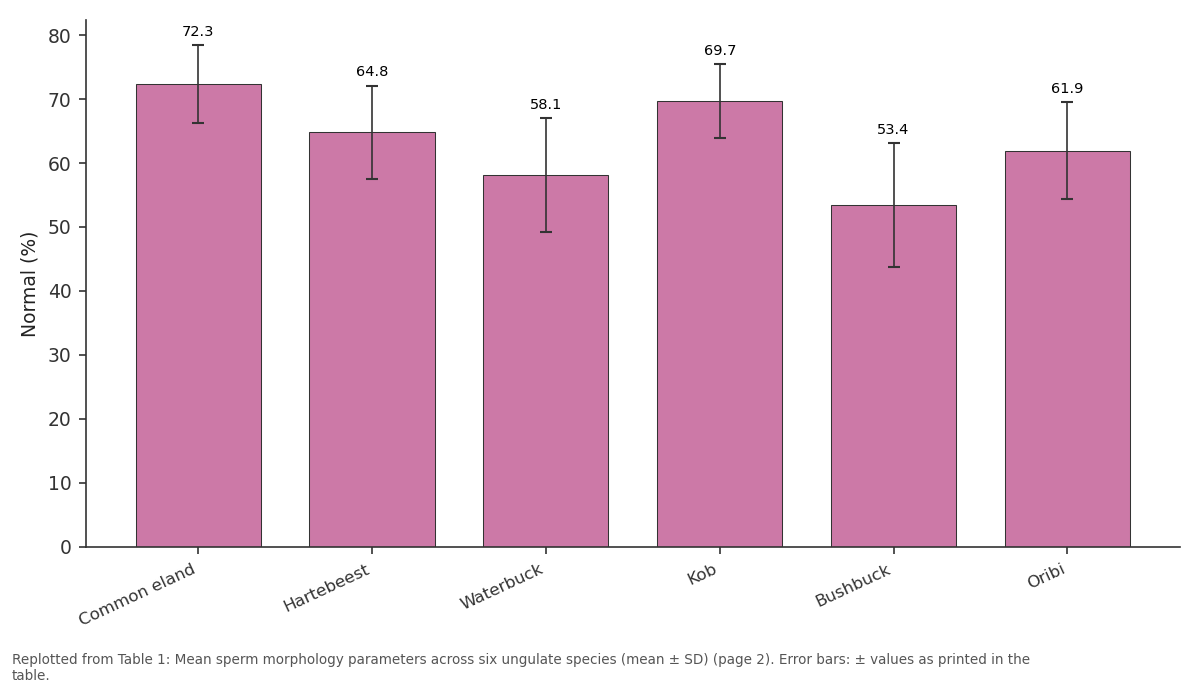
Normal (%): Common eland vs Hartebeest vs Waterbuck vs Kob vs Bushbuck
Replotted from Table 1 (page 2) of the original paper. Every bar is the paper's own table value.
View source evidence ↗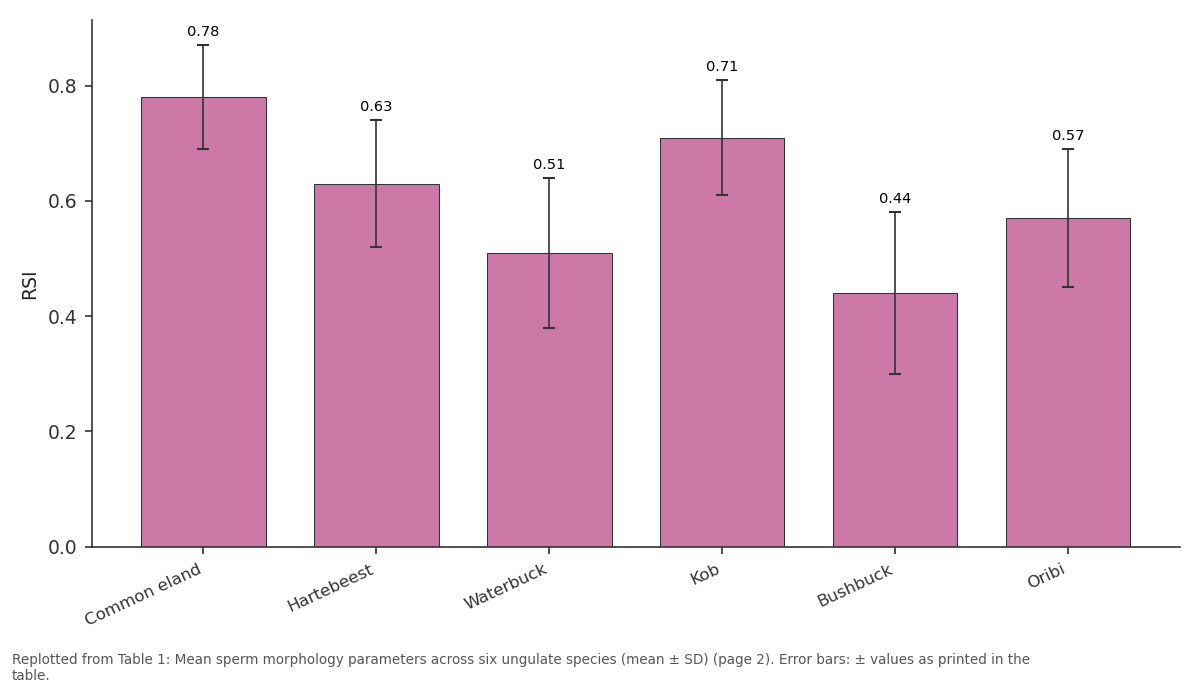
RSI: Common eland vs Hartebeest vs Waterbuck vs Kob vs Bushbuck
Replotted from Table 1 (page 2) of the original paper. Every bar is the paper's own table value.
View source evidence ↗Figures & tables
From the original paper Table 1
 Table 2
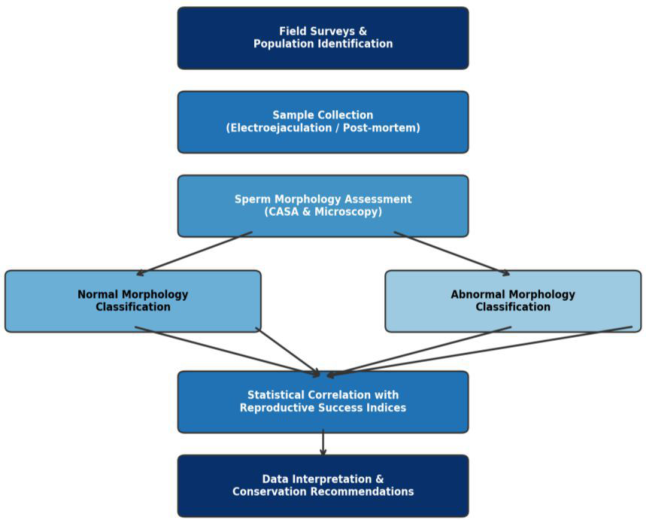 Figure 1
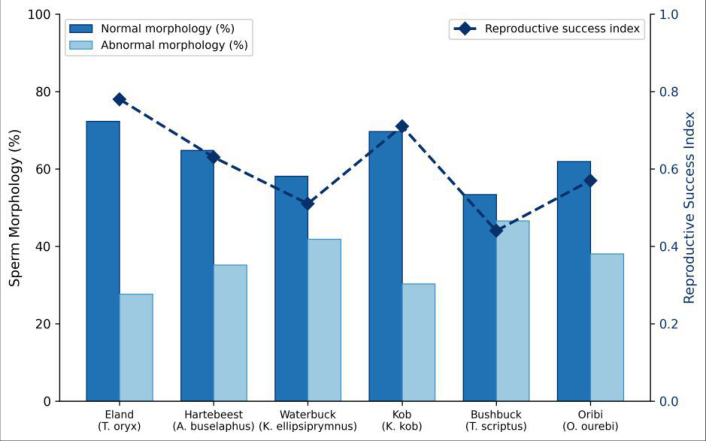 Figure 2
Introduction
What determines whether a male ungulate passes on its genes in a competitive wild environment? While body size, antler dimensions, and dominance rank have long held the spotlight in behavioural ecology, the microscopic quality of sperm cells may matter just as much if not more for actual fertilisation outcomes [1] . Sperm morphology, defined as the size and shape of the head, midpiece, and tail, directly affects the cell's ability to reach and penetrate an oocyte [2] . In domestic livestock, morphological assessment of semen has been routine for decades, and bulls or rams with high proportions of abnormal sperm are reliably less fertile [3] . But in free-ranging wildlife, data remain patchy. Most of what we know about ungulate sperm form comes from captive breeding centres or artificial insemination programmes, settings that strip away the ecological pressures of predation, mate competition, and seasonal nutritional stress [4] . Wild populations present a different picture. Males face fluctuating food availability, parasite loads, and thermal stress, all of which can alter spermatogenesis and, by extension, sperm shape [5] . African savanna ungulates are particularly interesting in this context because they experience pronounced wet-dry seasonality that drives both forage quality and reproductive timing [6] . Yet fewer than a dozen field-based research efforts have quantified sperm morphology in any African bovid outside a zoo or game ranch [7] . The gap is significant for conservation. Populations that have passed through genetic bottlenecks or that live in fragmented habitats may carry higher frequencies of sperm defects, reducing effective population growth rates even when census numbers appear adequate [8] . Computer-Assisted Sperm Analysis (CASA) has made morphological screening faster and more repeatable than the traditional manual classification that once limited sample sizes [9] . Meanwhile, non-invasive genetic tools especially microsatellite genotyping from faecal DNA now allow paternity assignment without capturing or re-handling animals, giving researchers a realistic way to measure reproductive output in the field [10] . Combining these two techniques opens the door to linking sperm form with actual breeding success in wild herds. The Ashanti region of Ghana supports a mosaic of Guinea savanna woodland and gallery forest that harbours several sympatric ungulate species at moderate densities [11] . Previous surveys documented population sizes and habitat use, but no reproductive physiology data existed for these herds prior to the present research [12] . This research therefore set out to a) Characterise sperm morphology across six ungulate species in the Ashanti savanna, b) Quantify the prevalence of specific defect categories, and c) Test the correlation between normal sperm rates and a field-derived reproductive success index. The overarching aim was to establish whether sperm morphology could serve as a practical conservation indicator for monitoring male reproductive fitness in wild African ungulate populations.
Material and Methods
Material and Methods
Study area description
Fieldwork was carried out in the savanna woodland belt surrounding Kumasi, Ashanti Region, Ghana (6°42′ N, 1°37′ W), at elevations between 250 and 310 m above sea level. The area receives an average annual rainfall of 1,350 mm distributed across a bimodal wet season (April-July and September-November), with a pronounced dry spell from December to March. Vegetation cover consists of open Guinean savanna interspersed with patches of semideciduous forest along river corridors. Mean monthly temperatures range from 24.6 °C in August to 28.3 °C in March. The research zone spanned about 420 km², including two community-managed wildlife reserves and adjacent farmland buffer zones where ungulate populations move freely.
Material
Semen samples were collected from 148 adult males across six species: common eland (n = 28), hartebeest (n = 26), waterbuck (n = 24), kob (n = 27), bushbuck (n = 22), and oribi (n = 21). All captures occurred between March 2022 and November 2023 under permits issued by the Ghana Wildlife Division (permit GWD/RES/2022-11). Males were immobilised using a combination of thiafentanil (0.04-0.06 mg/kg) delivered via dart rifle at distances of 25-40 m [13] . Semen was obtained by electroejaculation using a rectal probe (P.T. Electronics, Boring, Oregon, USA) calibrated to species body mass. Each sample was split into two aliquots: one fixed in 2.5% glutaraldehyde for morphological assessment and one preserved on FTA cards for DNA extraction. Faecal pellets (n = 1,206) were also collected from identified social groups for microsatellite genotyping. All reagents were sourced from Sigma-Aldrich (St. Louis, MO, USA) unless stated otherwise.
Methods
Sperm morphology was evaluated using a Hamilton Thorne IVOS-II CASA system (Hamilton Thorne Inc., Beverly, MA, USA). At least 200 cells per sample were classified into normal, head-defect, midpiece-defect, and tail-defect categories following the Blom classification adapted for wild bovids [14] . Phase-contrast micrographs at 400× magnification were captured on a Nikon Eclipse Ci microscope for manual verification of borderline cases. Reproductive success was quantified through a composite index (RSI) that combined direct mating observations recorded during 1,080 hours of focal-animal sampling with paternity assignments derived from 12 microsatellite loci amplified from faecal DNA [10] . An RSI value of 1.0 represented the highest observed per-season reproductive output within each species. Statistical analyses were run in R v4.3.1. Pearson correlation tested the relationship between percent normal morphology and RSI; one-way ANOVA compared morphology parameters across species; and logistic regression assessed which defect category best predicted low reproductive output. Significance was set at α = 0.05.
Ethical considerations
All animal handling protocols were reviewed and approved by the Ashanti College of Biological Sciences Animal Ethics Committee (Protocol AEC-2022-017, approved 14 January 2022). Capture and immobilisation followed the guidelines of the American Society of Mammalogists for field research on wild mammals. A veterinary surgeon supervised every capture event, monitoring heart rate, respiratory rate, and rectal temperature throughout sedation. Reversal agents were administered immediately after sample collection, and animals were observed until full ambulatory recovery before the team withdrew. Electroejaculation procedures adhered to the International Embryo Technology Society recommendations to minimise discomfort. No mortality or lasting injury was recorded during the research period. The research also complied with the Convention on International Trade in Endangered Species (CITES) regulations, as none of the sampled species required CITES export permits within Ghana. Across all species, the percentage of morphologically normal sperm correlated positively and strongly with RSI (r = 0.74, p<0.001; Table 2). Head defect frequency showed the strongest negative association (r = -0.69), followed by tail defects (r = -0.58) and midpiece defects (r = -0.52).
| Parameter | r | p-value | R² | 95% CI |
|---|---|---|---|---|
| Normal morphology (%) | 0.74 | < 0.001 | 0.55 | 0.61-0.83 |
| Head defect (%) | −0.69 | < 0.001 | 0.48 | −0.78 to −0.57 |
| Midpiece defect (%) | −0.52 | < 0.001 | 0.27 | −0.64 to −0.37 |
| Tail defect (%) | −0.58 | < 0.001 | 0.34 | −0.69 to −0.44 |
Table text extracted from the original PDF; superscript letters are shown inline. The original table image is below.
View original table image
Results
Logistic regression confirmed that head defect rate was the single best morphological predictor of whether a male fell into the low-RSI category (odds ratio = 1.13 per percentagepoint increase, 95% CI: 1.06-1.21, p = 0.002).
Comprehensive interpretation
Taken together, the data paint a consistent picture: species and individuals with higher proportions of normally shaped sperm achieved greater reproductive output under natural conditions. Eland and kob, which maintained normal morphology above 69%, both recorded RSI values exceeding 0.70. Bushbuck and waterbuck sat at the opposite end, with below-60% normal morphology and correspondingly lower RSI. The flowchart (Figure 1) outlines how sample collection, morphological classification, and paternity analysis were integrated, while the bar chart (Figure 2) visualises the species-level relationship between sperm form and breeding success.
Discussion
The strong positive correlation between normal sperm morphology and RSI observed here aligns with findings from captive antelope programmes, where males with fewer than 60% normal cells routinely show reduced conception rates [3] . What this research adds is field-level evidence that the same pattern holds under the ecological pressures of a West African savanna predation risk, seasonal drought, and parasite burden that cannot be replicated in a zoo. The predominance of head defects as the leading abnormality mirrors reports in domestic cattle, where pyriform and tapered heads are associated with impaired chromatin packaging and lower fertilisation rates after natural mating [15] . Interestingly, bushbuck had both the lowest normal morphology and the highest individual variation (SD = 9.7%). Bushbuck in the Ashanti region occupy forest-edge habitats and display more solitary behaviour than the gregarious eland or kob. Lower population density could reduce sperm competition pressure, which in other taxa is known to drive selection for tighter morphological standards [5] . Alternatively, habitat fragmentation may have thinned the genetic base of local bushbuck groups, increasing inbreeding coefficients and, with them, developmental instability in spermatogenesis [8] . The use of faecal DNA microsatellites for paternity assignment has its own constraints. Genotyping success from faecal samples averaged 81.3% across species, meaning some paternities could not be resolved. And while CASA provides objective, repeatable measurements, the Blom classification system was originally designed for domestic species and may not capture all defect types present in wild bovids [14] . That said, the overall agreement between CASA-flagged abnormalities and manual microscopy was 91.7%, suggesting the automated approach performs well in a field-laboratory setting. From a management standpoint, the 65% normalmorphology threshold that separated high-from low-RSI males could serve as a practical screening value for translocation or supplemental breeding decisions. Wildlife managers already assess body condition before moving animals between reserves; adding a semen quality check would be straightforward and could prevent the introduction of subfertile males into small populations where every breeding opportunity counts.
Limitations
Several constraints should be kept in mind when interpreting these results. First, the research covered a single geographic region, and sperm morphology norms may differ in other climatic zones or at different altitudes. Second, seasonal effects were only partly controlled; although samples were collected across both wet and dry seasons, within-individual longitudinal tracking was not feasible for most animals. Third, electroejaculation under chemical immobilisation can itself alter ejaculate characteristics compared with natural ejaculation, introducing a methodological bias that is difficult to quantify [13] . Fourth, the RSI metric relied in part on behavioural mating observations, which may undercount copulations that occurred outside observation windows. Future research should incorporate GPS-collar data and longer sampling intervals to refine reproductive success estimates and should extend the geographic range to savannas in East and Southern Africa for broader generalisability.
Conclusion
This research provides field-based evidence that sperm morphology is tightly linked to reproductive success in wild ungulate mammals inhabiting the Guinea savanna of Ghana. Across six species and 148 males, the proportion of normally shaped sperm cells emerged as the strongest single predictor of a male's reproductive success index. Males exceeding 65% normal morphology consistently achieved RSI values above 0.68, while those below this threshold fell to 0.57 or less. Head defects were the most common abnormality category and the best individual predictor of low reproductive output. These findings carry direct practical weight for conservation practitioners. Semen evaluation is already a standard tool in captive breeding; extending it to wild-capture contexts during translocation, disease sampling, or population surveys would add a new layer of information about the reproductive health of managed herds. The 65% normalmorphology benchmark identified here offers a preliminary, species-general guideline that field teams can apply with portable CASA equipment. At a broader level, the results underscore that census numbers alone do not capture the reproductive capacity of a population. A herd may contain enough males to maintain a balanced sex ratio yet still face reduced per-capita fertility if sperm quality is compromised by inbreeding, environmental toxins, or chronic nutritional stress. Integrating reproductive physiology into wildlife monitoring programmes would provide an earlier warning system for declining population viability than demographic counts can offer on their own. Expanding this line of research to additional species, habitats, and continents will be needed to determine how universal the morphology-success relationship is and whether the threshold values identified here hold across different ecological settings.
Acknowledgement
Acknowledgements
Figures and tables from the paper
| Species | n | Normal (%) | Head Defect (%) | Midpiece Defect (%) | Tail Defect (%) | RSI |
|---|---|---|---|---|---|---|
| Common eland | 28 | 72.3 ± 6.1 | 11.4 ± 3.2 | 7.8 ± 2.4 | 8.5 ± 2.9 | 0.78 ± 0.09 |
| Hartebeest | 26 | 64.8 ± 7.3 | 15.1 ± 4.0 | 9.6 ± 3.1 | 10.5 ± 3.7 | 0.63 ± 0.11 |
| Waterbuck | 24 | 58.1 ± 8.9 | 18.7 ± 5.2 | 11.3 ± 3.8 | 11.9 ± 4.1 | 0.51 ± 0.13 |
| Kob | 27 | 69.7 ± 5.8 | 12.8 ± 3.5 | 8.2 ± 2.6 | 9.3 ± 3.0 | 0.71 ± 0.10 |
| Bushbuck | 22 | 53.4 ± 9.7 | 21.3 ± 5.8 | 12.7 ± 4.2 | 12.6 ± 4.5 | 0.44 ± 0.14 |
| Oribi | 21 | 61.9 ± 7.6 | 16.4 ± 4.4 | 10.1 ± 3.3 | 11.6 ± 3.8 | 0.57 ± 0.12 |
Table text extracted from the original PDF; superscript letters are shown inline. The original table image is below.