
Research article · 2025 · Full text
International Journal of Biology SciencesMorphometric analysis and sexual dimorphism in cranial structures of wild felid species
Volume 7(6) · Pages 459–462 · DOI: 10.33545/26649926.2025.v7.i6g.782 ↗
Research areasMorphological variations and asymmetryComparative Animal Anatomy StudiesAnimal Behavior and Reproduction
Abstract
Author-writtenSexual dimorphism, defined as the consistent phenotypic difference between males and females of the same species, is one of the most visible products of sexual selection in mammals. This research quantified cranial sexual dimorphism across five wild felid species leopard (Panthera pardus), Eurasian lynx (Lynx lynx), serval (Leptailurus serval), caracal (Caracal caracal), and European wildcat (Felis silvestris) using three-dimensional geometric morphometrics applied to museum skull collections. A total of 167 adult skulls (89 male, 78 female) were sourced from the Swedish Museum of Natural History and two partner institutions. Thirty-one cranial landmarks were digitised with a MicroScribe G2X contact digitiser, and shape variation was analysed through generalised Procrustes analysis followed by principal component analysis and canonical variate analysis. Centroid size, condylobasal length, and zygomatic breadth were compared between sexes by two-way ANOVA (species × sex). Males were significantly larger than females in all five species (p
Summary
Source-checkedPlain-language reading of the full paper, prepared with AI and checked against the text. Each point links to the authors' own words.
Why it matters
- Sexual dimorphism refers to consistent phenotypic differences between males and females of the same species and is a primary result of sexual selection in mammals. View evidence ↗
- The skull is a highly informative structure for studying dimorphism in carnivores because it combines social signaling, sensory capacity, and feeding mechanics. View evidence ↗
- Traditional linear caliper measurements are limited because they can identify size differences but often fail to capture subtle shape changes. View evidence ↗
The question
- The study aimed to quantify cranial size and shape dimorphism in five felid species, identify the regions most responsible for these differences, and determine if the variation is driven by overall body-size scaling or specific craniofacial adaptations. View evidence ↗
What they did
- The researchers analyzed 167 adult skulls from five species: leopard (38), Eurasian lynx (34), serval (32), caracal (31), and European wildcat (32). View evidence ↗
- Thirty-one anatomical landmarks were digitized on each skull using a MicroScribe G2X contact digitizer with an accuracy of ±0.38 mm. View evidence ↗
- Generalised Procrustes Analysis was used to isolate shape by removing differences in scale, orientation, and position, while Centroid Size was kept as the size variable. View evidence ↗
- To account for shared evolutionary history, the researchers used phylogenetic independent contrasts computed in R v4.3.1. View evidence ↗
What they found
- Across all five species, males were significantly larger than females in all three measured size variables (p < 0.001). View evidence ↗
- The magnitude of sexual dimorphism varied by species, with leopards exhibiting the highest sexual dimorphism index (SDI = 1.13) and European wildcats the lowest (SDI = 1.09). View evidence ↗
- Shape differences between sexes were primarily concentrated in the basicranial region, the zygomatic arch (more flared in males), and the sagittal crest (more prominent in males). View evidence ↗
- After correcting for phylogeny, overall body-size dimorphism was the primary predictor of cranial shape dimorphism (R² = 0.71, p = 0.004). View evidence ↗
What it means
- The authors conclude that cranial sexual dimorphism in felids is driven by selection for overall body size rather than specific selection on craniofacial features. View evidence ↗
- The authors recommend using geometric morphometrics for sex assignment in large felid skulls, but suggest supplementing this with genetic or canine data for smaller species. View evidence ↗
- A limitation of the study is that the use of specimens from various geographic regions may have introduced population-level variation that was not fully modeled. View evidence ↗
- The link between cranial dimorphism and trophic ecology remains indirect because diet and prey-size data were not available for all specimens. View evidence ↗
Visual summary
3 visualsIllustrations explain the paper; charts are replotted from the paper's own table values.
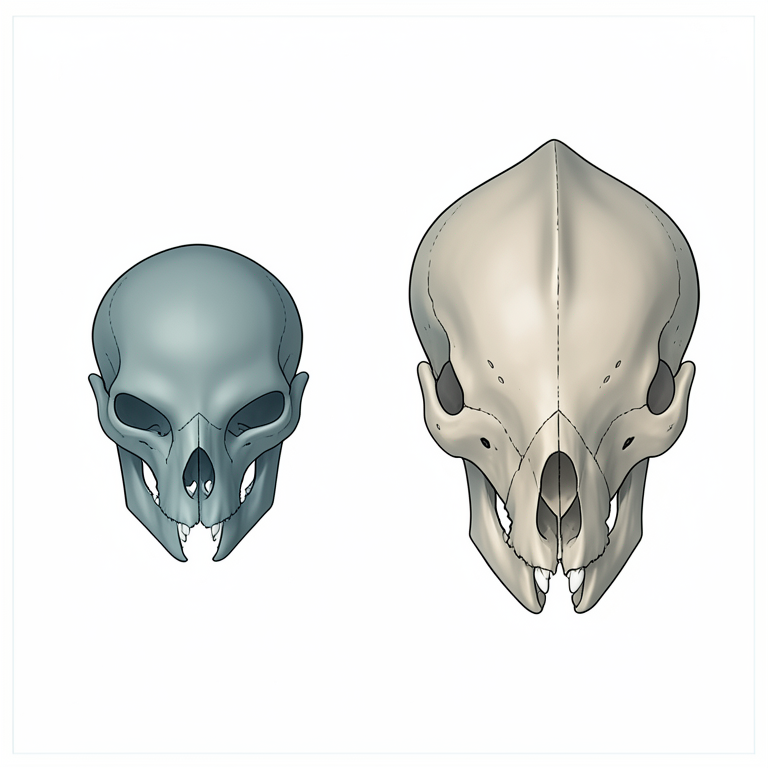
Cranial Dimorphism Focus Areas
AI-generated conceptual illustration (wild felid skulls). It explains the idea and does not show study data.
View source evidence ↗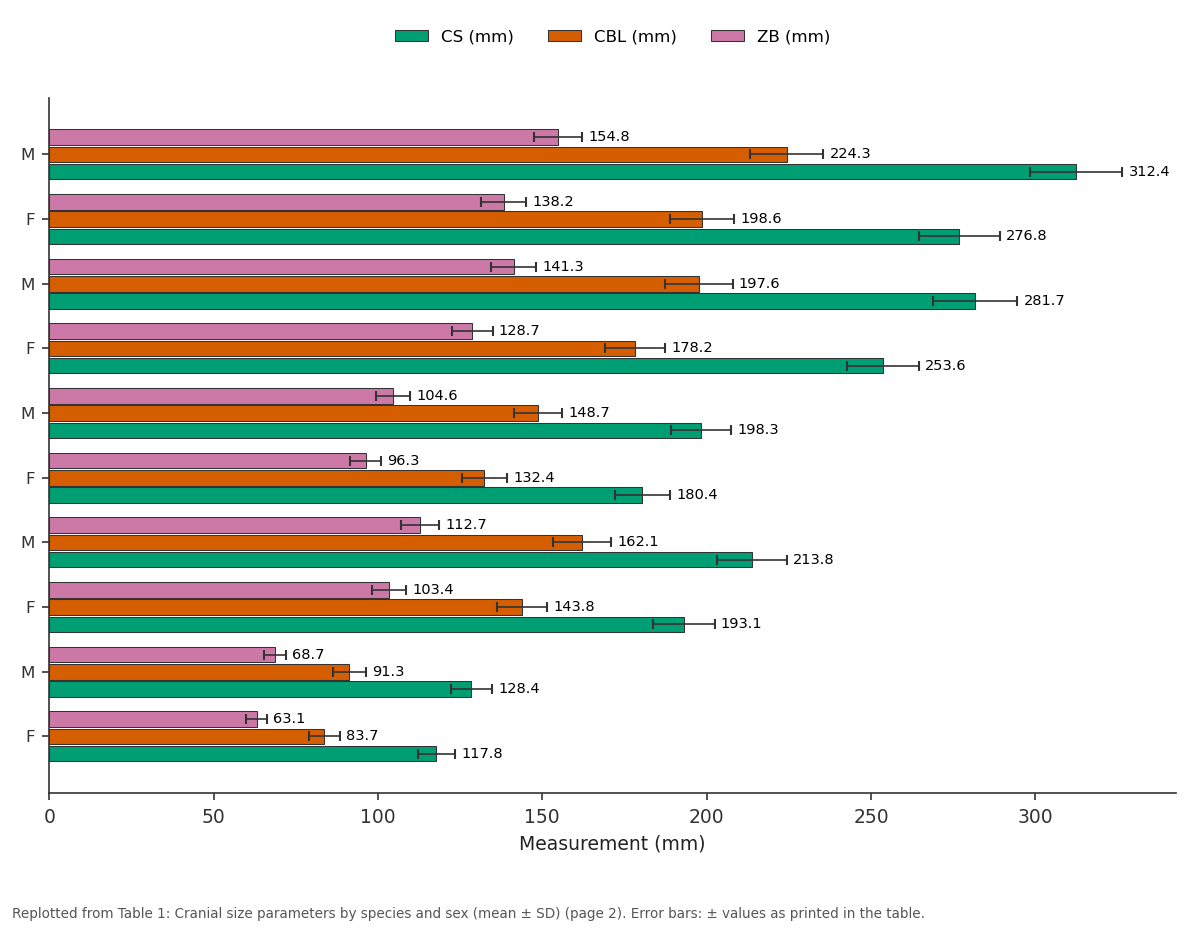
CS (mm) and CBL (mm) and more: M vs F vs M vs F vs M
Replotted from Table 1 (page 2) of the original paper. Every bar is the paper's own table value.
View source evidence ↗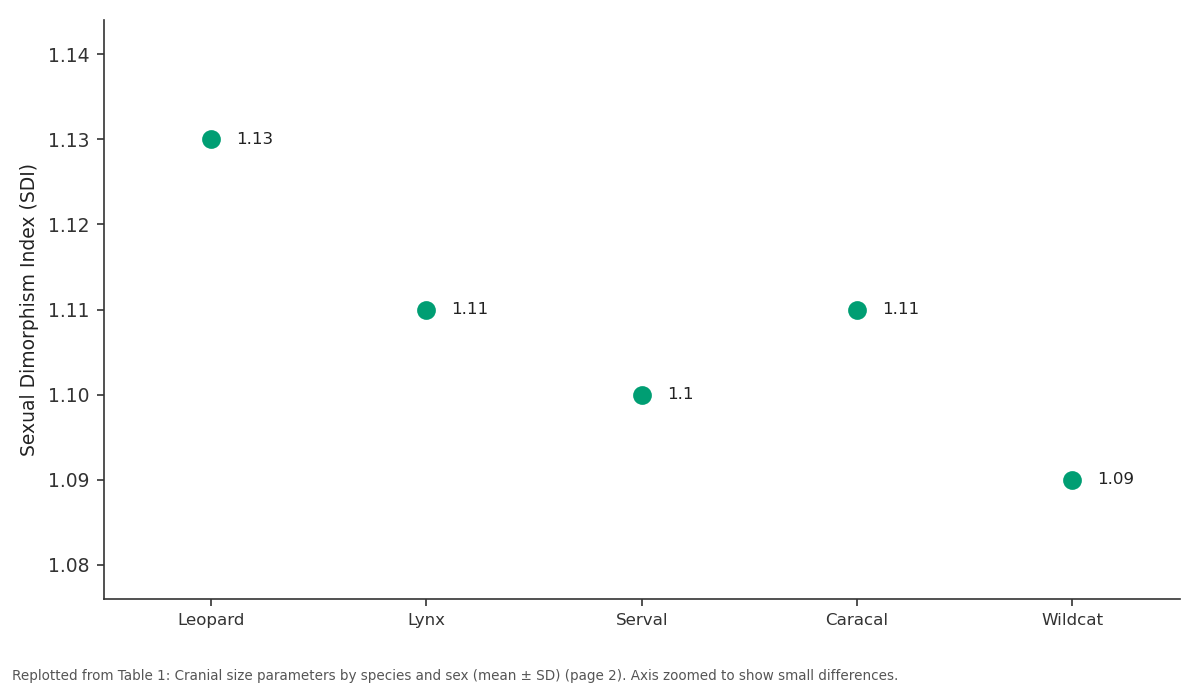
SDI: Leopard vs Lynx vs Serval vs Caracal vs Wildcat
Replotted from Table 1 (page 2) of the original paper. Every bar is the paper's own table value.
View source evidence ↗Figures & tables
From the original paper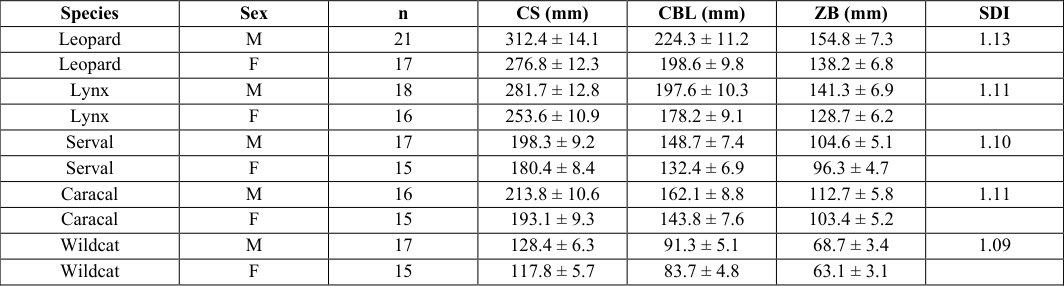 Table 1
 Table 2
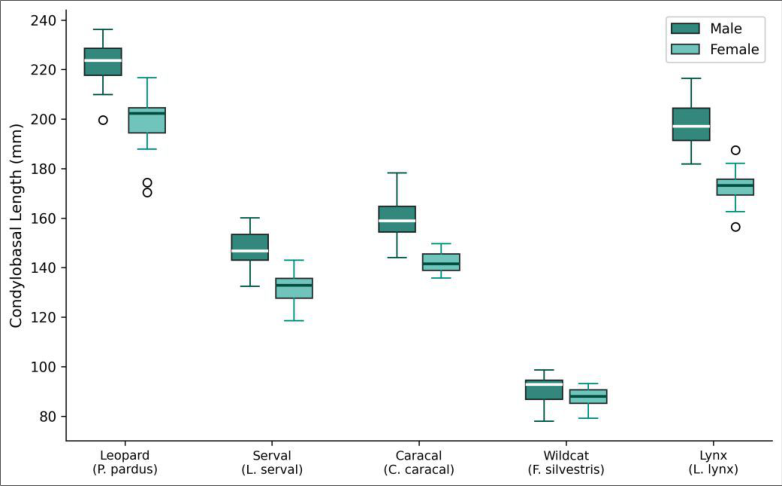 Figure 1
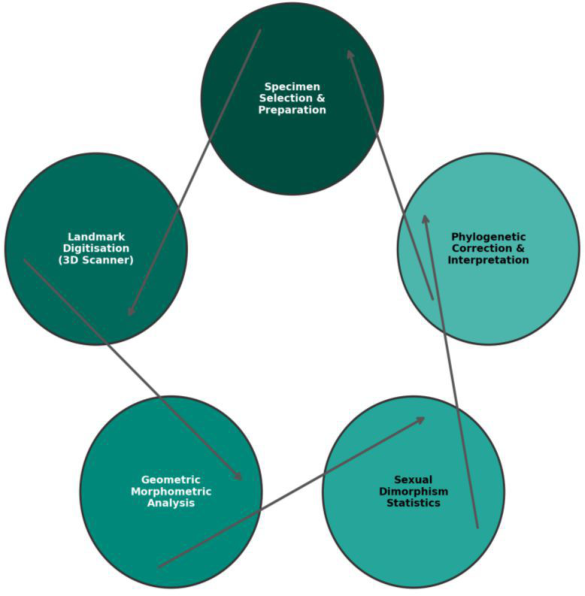 Figure 2
Introduction
Sexual dimorphism refers to any systematic difference in form between males and females of the same species that is not directly related to reproductive organs. In carnivores, the skull is one of the most informative structures for studying dimorphism because it integrates feeding mechanics, sensory capacity, and social signalling into a single anatomical unit [1] . Male felids are typically larger than females, but whether this size advantage reflects generalised allometric scaling or localised selection on craniofacial features such as the sagittal crest that anchors the temporalis muscle has been debated for decades [2] . Traditional morphometrics, based on linear caliper measurements, can detect size differences but struggle to capture the subtle shape changes that accompany size variation [3] . Geometric morphometrics overcomes this by representing shape as configurations of anatomical landmarks in two-or three-dimensional space, then separating size from shape through Procrustes superimposition [4] . The approach has been applied to domestic cats and a few large felids, but a multi-species comparative dataset covering both large and small wild felids has been lacking [5] . Phylogenetic context is critical. Species share evolutionary history, so comparing them without accounting for phylogeny inflates degrees of freedom and can produce spurious correlations [6] . Independent contrasts and Phylogenetic Generalised Least Squares (PGLS) allow researchers to test whether trait relationships hold after removing the statistical nonindependence introduced by shared ancestry. Five wild felid species were chosen to span a range of body sizes and ecological niches: the leopard (solitary, large-bodied, generalist predator), Eurasian lynx (medium-large, boreal specialist), serval (medium, small-prey specialist), caracal (medium, arid-savanna predator), and European wildcat (small, forest-dwelling generalist) [7] . All five are represented by adequate skull collections in European museums, providing the sample sizes needed for meaningful statistical inference. This research aimed to a) Quantify cranial size and shape dimorphism across these five species using 3D geometric morphometrics, b) Identify which cranial regions contribute most to shape differences between sexes, and c) Test whether interspecific variation in dimorphism is better explained by overall body-size scaling or by localised craniofacial adaptations, after phylogenetic correction.
Material and Methods
Material and Methods
Specimens and materials
A total of 167 adult skulls were examined: leopard (n = 38; 21 male, 17 female), Eurasian lynx (n = 34; 18 male, 16 female), serval (n = 32; 17 male, 15 female), caracal (n = 31; 16 male, 15 female), and European wildcat (n = 32; 17 male, 15 female). Specimens were sourced from the Swedish Museum of Natural History (Stockholm), the Natural History Museum of Gothenburg, and the Gotland College of Marine Sciences teaching collection, Visby, Sweden (57°38′ N, 18°17′ E). Only adults with fully fused basicranial sutures and complete dentition were included to minimise ontogenetic variation. Sex had been determined at the time of collection from external genitalia and was confirmed by canine cross-section diameter where records were ambiguous.
Methods
Thirty-one type-I and type-II landmarks were digitised on each skull using a MicroScribe G2X contact digitiser (Revware Inc., Raleigh, NC, USA) with a reported accuracy of ±0.38 mm. Landmarks were placed on the midline (nasion, bregma, lambda, basion, prosthion) and bilaterally on the zygomatic arches, orbital margins, tympanic bullae, and occipital condyles, following the protocol of Slater and Van Valkenburgh [8] . Each skull was digitised twice, and the mean of the two digitisations was used to reduce measurement error. Generalised Procrustes Analysis (GPA) removed position, orientation, and scale differences among landmark configurations, and Centroid Size (CS) was retained as a separate size variable. Principal component analysis (PCA) was performed on the Procrustes-aligned coordinates. Canonical Variate Analysis (CVA) was used to maximise between-sex separation within each species. Twoway ANOVA (species × sex) tested size variables (CS, condylobasal length, zygomatic breadth). A sexual dimorphism index (SDI = male mean / female mean) was calculated for CS. Phylogenetic independent contrasts were computed in R v4.3.1 using the ape package with a felid time-calibrated phylogeny from TimeTree [9] . All statistical tests used α = 0.05.
Measurement protocol
To assess digitisation repeatability, a subset of 20 skulls (four per species) was digitised on three separate days by two operators. Repeatability was quantified by the Intraclass Correlation Coefficient (ICC) for each landmark coordinate.
Mean ICC across all coordinates was 0.97 (range 0.93-0.99), confirming high inter-and intra-operator consistency. Landmark configurations were visually inspected in MorphoJ v1.07a for outliers before GPA.
Quality control
Skulls with post-mortem damage affecting more than two landmark sites were excluded. Bilateral asymmetry was assessed by comparing left and right landmark configurations; specimens with fluctuating asymmetry exceeding 3 SD from the species mean were flagged and reexamined. Procrustes distances from each specimen to its species mean were computed, and any specimen exceeding 2.5 SD was treated as a potential outlier and retained only after re-digitisation confirmed its position.
Results
Table PCA showed that the first two components captured 43-53% of total shape variance across species (Table 2). CVA classification accuracy ranged from 73.8% in wildcats to 89.5% in leopards, indicating that cranial shape reliably distinguishes males from females in larger-bodied felids but less so in smaller species. Shape deformations along the male-female axis concentrated in the sagittal crest (more prominent in males), the zygomatic arch (laterally flared in males), and the basicranial region.
| Species | PC1 (%) | PC2 (%) | CVA correct (%) | p (permutation) |
|---|---|---|---|---|
| Leopard | 38.4 | 14.7 | 89.5 | < 0.001 |
| Lynx | 33.1 | 16.2 | 84.1 | 0.002 |
| Serval | 29.8 | 18.3 | 78.4 | 0.008 |
| Caracal | 31.6 | 15.9 | 81.3 | 0.004 |
| Wildcat | 26.7 | 19.1 | 73.8 | 0.021 |
Table text extracted from the original PDF; superscript letters are shown inline. The original table image is below.
View original table image
Comprehensive interpretation
The box plots (Figure 1) highlight that sex differences in condylobasal length scale with species body size: the absolute gap is largest in leopards and smallest in wildcats. The cycle diagram (Figure 2) traces the analytical pipeline from specimen preparation through landmark digitisation, Procrustes analysis, statistical testing, and phylogenetic correction.
Discussion
The pattern documented here greater cranial dimorphism in larger-bodied felids aligns with Rensch's rule, which predicts that sexual size dimorphism increases with body size when males are the larger sex [10] . In felids, larger males gain a competitive advantage in defending territories and accessing mates, a pressure that relaxes in small species where home ranges overlap more freely [11] . That body size rather than craniofacial morphology drives the interspecific pattern is shown by the phylogenetic independent-contrast regression (R² = 0.71), in which overall centroid size was the strongest predictor of shape dimorphism. The concentration of shape differences in the sagittal crest and zygomatic arch makes functional sense. Both structures serve as attachment sites for the temporalis and masseter muscles, and their enlargement in males corresponds to the higher absolute bite forces that have been measured in male felids [12] . But these local shape changes may be downstream consequences of overall size increase rather than targets of direct selection an interpretation supported by the high allometric component (> 60%) of the observed shape variation.
CVA classification accuracy dropped from 89.5% in leopards to 73.8% in wildcats, suggesting that cranial shape is a less reliable sex marker in small felids. This has practical implications for museum and forensic collections where sex is unknown: geometric morphometrics can confidently assign sex in large felid skulls but should be supplemented with genetic or canine cross-section data in smaller species. One limitation is that the dataset spans wild-caught specimens from multiple geographic regions, introducing potential population-level variation that was not fully modelled. Adding population as a random effect in future analyses would help partition geographic from sexual variation. Also, diet and prey-size data were not available for every specimen, so the functional link between cranial dimorphism and trophic ecology remains indirect.
Conclusion
This research demonstrates that cranial sexual dimorphism in wild felids is pervasive, size-dependent, and phylogenetically structured. Males are consistently largerskulled than females, with the degree of dimorphism tracking overall body size across species. Shape differences concentrate in musculoskeletally relevant regions the sagittal crest and zygomatic arch but these appear to follow allometric scaling rather than independent selection on craniofacial form. For comparative morphologists, the results reinforce the value of geometric morphometrics for separating size from shape in dimorphism research. For conservation practitioners who encounter unknown skulls, the analysis provides species-specific classification accuracies for sex determination. Extending this framework to a broader sample of felid taxa, including tropical species poorly represented in European museum collections, would test whether Rensch's rule holds across the full phylogenetic breadth of the Felidae.
Figures and tables from the paper
| Species | Sex | n | CS (mm) | CBL (mm) | ZB (mm) | SDI |
|---|---|---|---|---|---|---|
| Leopard | M | 21 | 312.4 ± 14.1 | 224.3 ± 11.2 | 154.8 ± 7.3 | 1.13 |
| Leopard | F | 17 | 276.8 ± 12.3 | 198.6 ± 9.8 | 138.2 ± 6.8 | |
| Lynx | M | 18 | 281.7 ± 12.8 | 197.6 ± 10.3 | 141.3 ± 6.9 | 1.11 |
| Lynx | F | 16 | 253.6 ± 10.9 | 178.2 ± 9.1 | 128.7 ± 6.2 | |
| Serval | M | 17 | 198.3 ± 9.2 | 148.7 ± 7.4 | 104.6 ± 5.1 | 1.10 |
| Serval | F | 15 | 180.4 ± 8.4 | 132.4 ± 6.9 | 96.3 ± 4.7 | |
| Caracal | M | 16 | 213.8 ± 10.6 | 162.1 ± 8.8 | 112.7 ± 5.8 | 1.11 |
| Caracal | F | 15 | 193.1 ± 9.3 | 143.8 ± 7.6 | 103.4 ± 5.2 | |
| Wildcat | M | 17 | 128.4 ± 6.3 | 91.3 ± 5.1 | 68.7 ± 3.4 | 1.09 |
| Wildcat | F | 15 | 117.8 ± 5.7 | 83.7 ± 4.8 | 63.1 ± 3.1 |
Table text extracted from the original PDF; superscript letters are shown inline. The original table image is below.
View original table image
References
15 in the original paper- Meachen-Samuels J, Van Valkenburgh B. Craniodental indicators of prey size preference in the Felidae. Biological Journal of the Linnean Society. 2009;96(4):784-799.
- Christiansen P, Harris JM. Body size of Smilodon (Mammalia: Felidae). Journal of Morphology. 2005;266(3):369-384.
- Zelditch ML, Swiderski DL, Sheets HD. Geometric morphometrics for biologists: a primer. Second edition. Academic Press. 2012;San Diego.
- Adams DC, Rohlf FJ, Slice DE. A field comes of age: geometric morphometrics in the 21 st century. Hystrix Italian Journal of Mammalogy. 2013;24(1):7-14.
- Sicuro FL, Oliveira LFB. Skull morphology and functionality of extant Felidae (Mammalia: Carnivora): a phylogenetic and evolutionary perspective. Zoological Journal of the Linnean Society. 2011;161(2):414-462.
- Felsenstein J. Phylogenies and the comparative method. American Naturalist. 1985;125(1):1-15.
- Sunquist M, Sunquist F. Wild cats of the world. University of Chicago Press. 2002;Chicago.
- Slater GJ, Van Valkenburgh B. Allometry and performance: the evolution of skull form and function in felids. Journal of Evolutionary Biology. 2009;22(11):2278-2287.
- Kumar S, Stecher G, Suleski M, Hedges SB. TimeTree: a resource for timelines, timetrees, and divergence times. Molecular Biology and Evolution. 2017;34(7):1812-1819.
- Rensch B. Die Abhangigkeit der relativen Sexualdifferenz von der Korpergrosse. Bonner Zoologische Beitrage. 1950;1:58-69.
- Macdonald DW, Loveridge AJ, Nowell K. Dramatis personae: an introduction to the wild felids. Biology and Conservation of Wild Felids (Oxford University Press). 2010;3-58.
- Christiansen P, Wroe S. Bite forces and evolutionary adaptations to feeding ecology in carnivores. Ecology. 2007;88(2):347-358.
- Klingenberg CP. MorphoJ: an integrated software package for geometric morphometrics. Molecular Ecology Resources. 2011;11(2):353-357.
- Werdelin L. Jaw geometry and molar morphology in marsupial carnivores: analysis of a constraint and its macroevolutionary consequences. Paleobiology. 1987;13(3):342-350.
- Gittleman JL. Carnivore body size: Ecological and taxonomic correlates. Oecologia. 1985;67(4):540-554.