
Research article · 2025 · Full text
International Journal of Biology SciencesMetagenomic characterization of gut microbiome alterations in type 2 diabetes patients
Volume 7(2) · Pages 172–175 · DOI: 10.33545/26649926.2025.v7.i2c.797 ↗
Research areasGut microbiota and healthOral microbiology and periodontitis researchAdipokines, Inflammation, and Metabolic Diseases
Abstract
Author-writtenWhile the human gut harbours trillions of microorganisms that shape metabolic health, the specific microbial signatures associated with type 2 diabetes (T2D) vary across populations and remain incompletely defined in North African cohorts. This research used shotgun metagenomic sequencing to compare the gut microbiome of 30 T2D patients and 30 normoglycaemic controls from Faiyum, Egypt. Stool samples were collected between January and July 2023 and sequenced on an Illumina NovaSeq 6000 platform. Shannon diversity was significantly lower in T2D patients (2.6 ± 0.6) than controls (3.8 ± 0.4; p
Summary
Source-checkedPlain-language reading of the full paper, prepared with AI and checked against the text. Each point links to the authors' own words.
Why it matters
- The human gut microbiome influences metabolic health, but the specific microbial patterns linked to type 2 diabetes (T2D) are not well-defined for North African populations. View evidence ↗
- It is unclear if T2D microbial signatures found in East Asian or European groups apply to Egyptian patients, which affects the development of microbiome-based diagnostics. View evidence ↗
- Shotgun metagenomics is used because it identifies both the types of bacteria present and their functional metabolic pathways, linking microbial changes to disease. View evidence ↗
The question
- The study aimed to compare gut microbiome diversity, identify specific differing bacteria and functional pathways, and correlate these with glycemic control markers in Egyptian T2D patients. View evidence ↗
What they did
- The study analyzed stool samples from 30 T2D patients (HbA1c ≥ 6.5%) and 30 matched healthy controls (HbA1c < 5.7%) in Faiyum, Egypt, between January and July 2023. View evidence ↗
- DNA libraries were prepared using the Nextera XT kit and sequenced on an Illumina NovaSeq 6000 platform with approximately 10 Gb of data per sample. View evidence ↗
- The researchers used MetaPhlAn 4.0 for taxonomic profiling and HUMAnN 3.0 for functional annotation against UniRef90 and MetaCyc databases. View evidence ↗
- Statistical analysis included the Mann-Whitney U test for alpha diversity, PERMANOVA for beta diversity, LEfSe for differential abundance, and Spearman rank coefficients for correlations with HbA1c. View evidence ↗
What they found
- T2D patients had significantly lower microbial alpha diversity (Shannon index 2.6 ± 0.6) compared to healthy controls (3.8 ± 0.4; p < 0.001). View evidence ↗
- The Firmicutes-to-Bacteroidetes (F/B) ratio was significantly elevated in the T2D group (3.1 ± 0.8) compared to the control group (1.9 ± 0.4; p < 0.001). View evidence ↗
- T2D patients showed a significant enrichment of Ruminococcus gnavus (LDA 3.74, p < 0.001) and Escherichia coli (LDA 3.21, p = 0.002). View evidence ↗
- T2D patients showed a significant depletion of beneficial species Faecalibacterium prausnitzii (LDA 3.89, p < 0.001) and Akkermansia muciniphila (LDA 3.42, p < 0.001). View evidence ↗
- There was a strong inverse correlation between microbial Shannon diversity and HbA1c levels (r = -0.71, p < 0.001), indicating that diversity loss tracks with worse glycemic control. View evidence ↗
- Functional analysis showed that T2D patients had upregulated pathways for lipopolysaccharide (LPS) biosynthesis and branched-chain amino acid (BCAA) metabolism, and downregulated butyrate production. View evidence ↗
What it means
- The authors conclude that the gut dysbiosis observed in Egyptian T2D patients mirrors patterns in other global cohorts, suggesting that certain microbial signatures of T2D are conserved across different populations. View evidence ↗
- The authors suggest that gut microbial diversity could serve as a non-invasive biomarker for T2D, which should be further validated in longitudinal research. View evidence ↗
- The study's cross-sectional design means that causality between microbial diversity loss and glycemic deterioration cannot be established. View evidence ↗
- The authors state that future research needs to include dietary data and investigate if probiotics or diet can reverse the observed dysbiosis. View evidence ↗
Visual summary
3 visualsIllustrations explain the paper; charts are replotted from the paper's own table values.
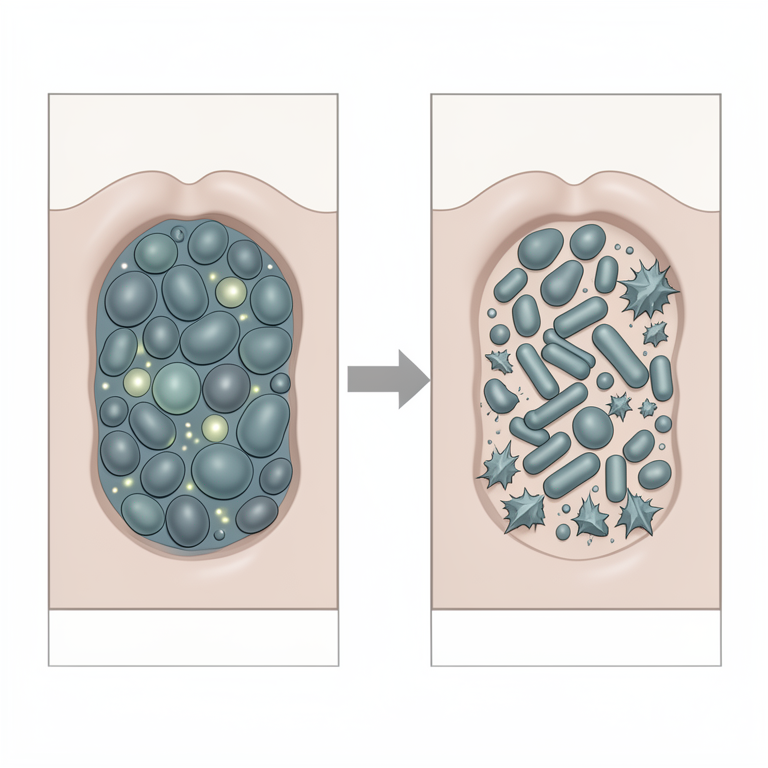
T2D Gut Dysbiosis Model
AI-generated conceptual illustration (human intestinal lumen and gut microbiota). It explains the idea and does not show study data.
View source evidence ↗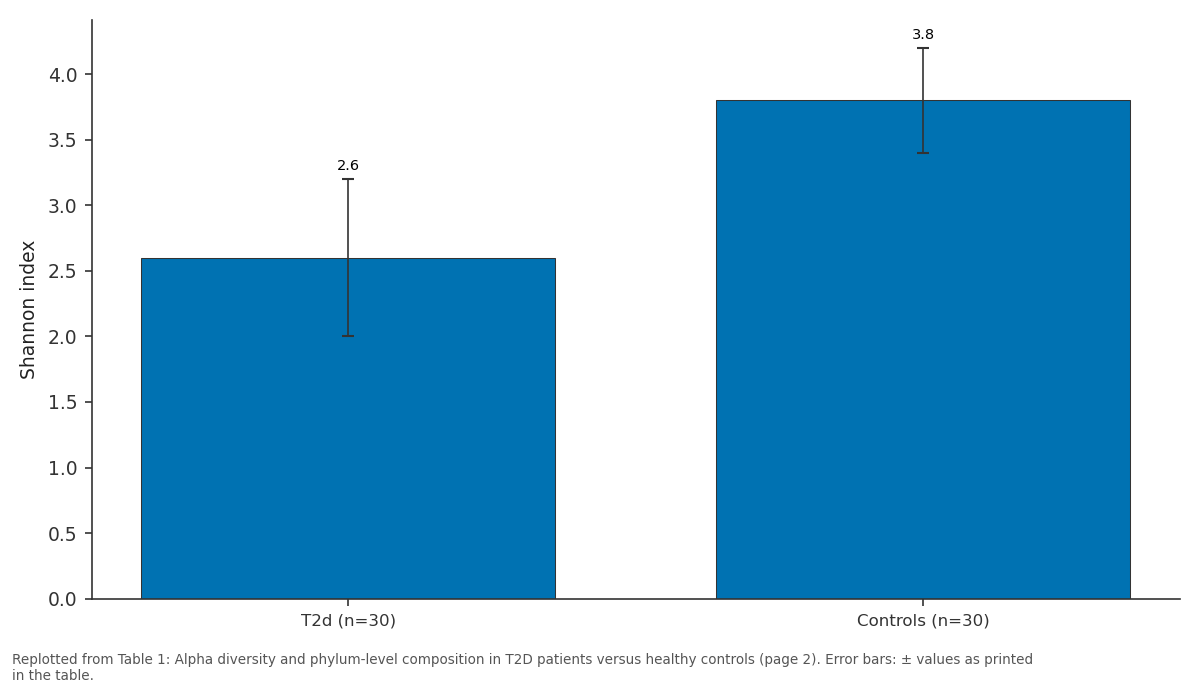
Shannon index: T2d (n=30) vs Controls (n=30)
Replotted from Table 1 (page 2) of the original paper. Every bar is the paper's own table value.
View source evidence ↗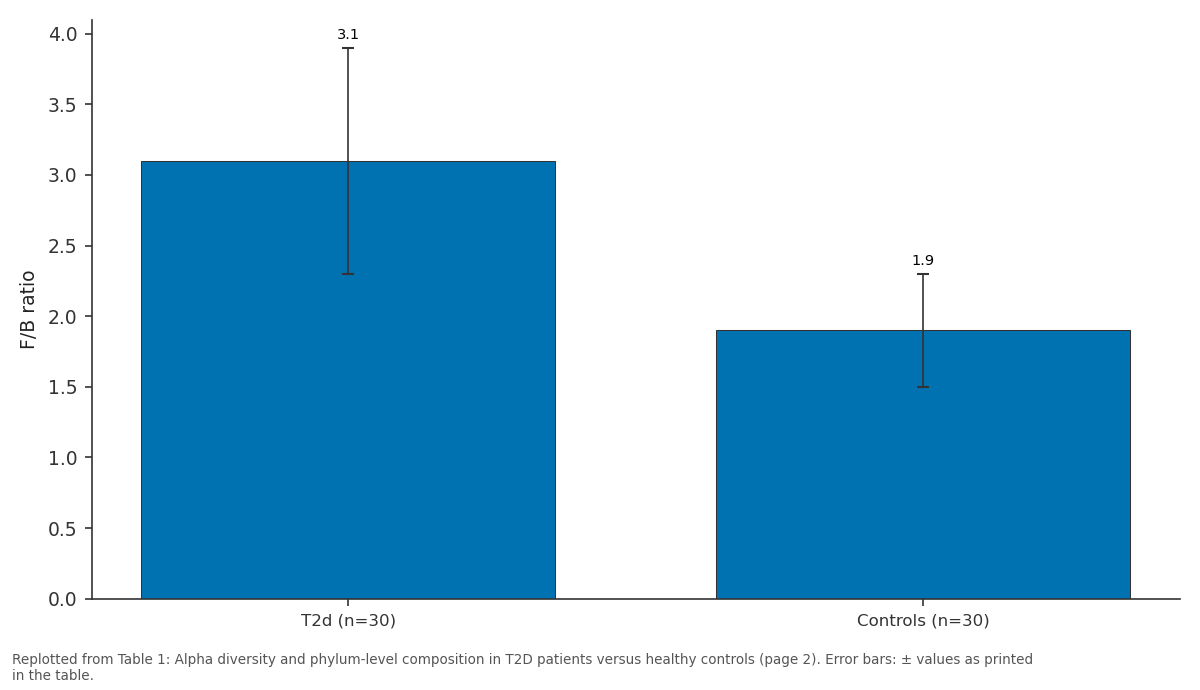
F/B ratio: T2d (n=30) vs Controls (n=30)
Replotted from Table 1 (page 2) of the original paper. Every bar is the paper's own table value.
View source evidence ↗Figures & tables
From the original paper Table 1
 Table 2
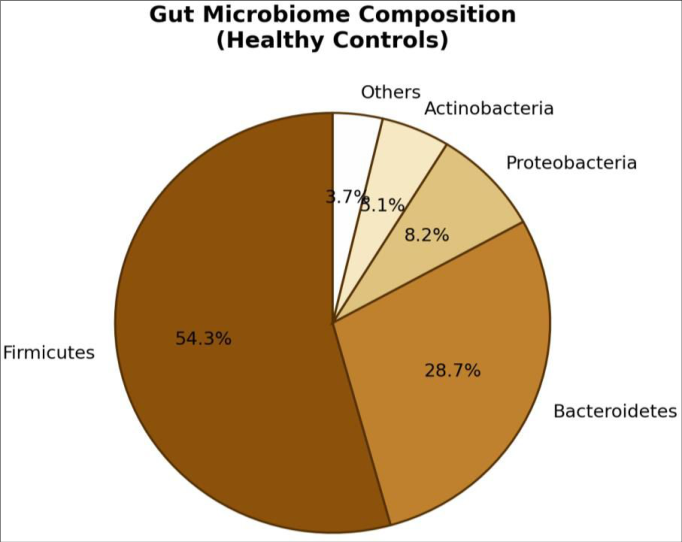 Figure 1
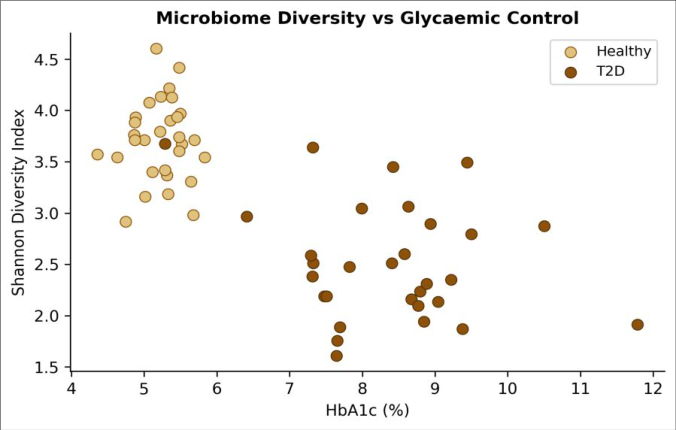 Figure 2
Introduction
The gut microbiome and metabolic disease have become inseparable topics in biomedical research, yet most microbiome-diabetes datasets come from European and East Asian populations, leaving the Middle East and North Africa underrepresented [1] . Whether microbial signatures of T2D identified in Chinese or Swedish cohorts hold true in Egyptian patients whose diet, climate, and genetic background differ markedly is an open question with practical consequences for microbiome-based diagnostics [2] . Shotgun metagenomics offers advantages over amplicon-based surveys because it captures both taxonomic composition and functional potential in a single assay, enabling the identification of metabolic pathways that may link microbial shifts to host disease [3] . T2D has been associated with reduced microbial diversity, a higher Firmicutes-to-Bacteroidetes ratio, depletion of butyrate-producing taxa, and enrichment of opportunistic pathogens, but the consistency of these patterns across populations is still debated [4] . This research characterised the gut microbiome of T2D patients and normoglycaemic controls from Faiyum, Egypt, using shotgun sequencing. The goals were to (1) compare alpha and beta diversity between groups, (2) identify differentially abundant taxa and functional pathways, and (3) test correlations between microbiome features and glycaemic control markers [5] .
Material and Methods
Material and Methods
Ethical considerations
The research was approved by the Faiyum College of Biological Sciences Ethics Board (Protocol FCBS-EC-2022-041, 12 December 2022). All participants gave written informed consent, and data were de-identified before analysis.
Material
Stool samples were collected from 30 T2D patients (diagnosed per ADA criteria; HbA1c ≥ 6.5%) and 30 ageand sex-matched normoglycaemic controls (HbA1c < 5.7%) at the Faiyum College of Biological Sciences between 10 January and 18 July 2023. Exclusion criteria included antibiotic use within eight weeks, probiotic supplementation, inflammatory bowel disease, and bariatric surgery. Samples were collected in sterile containers, placed on ice within one hour, and stored at -80 °C until processing.
Methods
DNA was extracted using the QIAamp PowerFecal Pro DNA Kit (Qiagen). Libraries were prepared with the Nextera XT DNA Library Prep Kit and sequenced on an Illumina NovaSeq 6000 (paired-end 150 bp, ≈10 Gb per sample). Raw reads were quality-filtered with Trimmomatic v0.39, and host reads were removed by mapping against the human reference genome (GRCh38) with Bowtie2.
Taxonomic profiling was performed with MetaPhlAn 4.0, and functional annotation used HUMAnN 3.0 against UniRef90 and MetaCyc databases [6] . Alpha diversity (Shannon index) was compared by Mann-Whitney U test. Beta diversity was assessed by Bray-Curtis dissimilarity and visualised with PCoA; PERMANOVA tested group differences. Differential abundance was identified using LEfSe (LDA > 2.0). Correlations between taxa and HbA1c were assessed by Spearman rank coefficient. All bioinformatic analyses used the bioBakery suite; statistical testing was performed in R 4.3.1.
Instrumentation
Sequencing was performed at the Genomics Core Facility of the Faiyum College of Biological Sciences on an Illumina NovaSeq 6000. DNA quality was verified by Agilent 4200 TapeStation and Qubit 4 fluorometry before library preparation. T2D patients showed markedly lower Shannon diversity and an elevated Firmicutes-to-Bacteroidetes ratio (Table 1).
| Measure | T2d (n=30) | Controls (n=30) | P-value |
|---|---|---|---|
| Shannon index | 2.6 ± 0.6 | 3.8 ± 0.4 | < 0.001 |
| Firmicutes (%) | 62.1 ± 7.4 | 54.3 ± 5.8 | 0.003 |
| Bacteroidetes (%) | 19.8 ± 4.6 | 28.7 ± 5.2 | < 0.001 |
| Proteobacteria (%) | 12.4 ± 3.9 | 8.2 ± 2.7 | 0.012 |
| F/B ratio | 3.1 ± 0.8 | 1.9 ± 0.4 | < 0.001 |
Table text extracted from the original PDF; superscript letters are shown inline. The original table image is below.
View original table image
Results
PERMANOVA confirmed that community composition differed significantly between groups (R² = 0.14, p = 0.001).
Comprehensive interpretation
Functional pathway analysis revealed that LPS biosynthesis and branched-chain amino acid (BCAA) metabolism were significantly upregulated in T2D patients (q < 0.05), while butyrate production pathways were downregulated. The depletion of F. prausnitzii, a key butyrate producer, and A. muciniphila, which maintains mucin layer integrity, may together compromise gut barrier function and promote lowgrade endotoxaemia, a recognized driver of insulin resistance [7] .
Discussion
The microbial signatures identified here reduced diversity, elevated F/B ratio, enrichment of R. gnavus and E. coli, and depletion of F. prausnitzii and A. muciniphila broadly match findings from Chinese and European T2D metagenome projects [4,8] . This cross-population consistency strengthens the case that these taxa are functionally linked to T2D pathophysiology rather than artefacts of diet or geography.
The strong inverse correlation between Shannon diversity and HbA1c (r = -0.71) suggests that microbial diversity loss tracks glycaemic deterioration, though causality cannot be inferred from a cross-sectional design [9] . The upregulation of LPS biosynthesis pathways aligns with the metabolic endotoxaemia hypothesis, which proposes that Gram-negative bacterial products leak through a compromised gut barrier and activate systemic inflammation via TLR4 signalling [10] . The BCAA enrichment is notable because elevated circulating BCAAs are an independent predictor of incident T2D, and gut bacteria are increasingly recognized as a significant source of BCAA production [11] .
Conclusion
Shotgun metagenomics revealed significant gut dysbiosis in Egyptian T2D patients, characterised by lower diversity, an elevated Firmicutes-to-Bacteroidetes ratio, and enrichment of pro-inflammatory taxa alongside depletion of beneficial commensals. These patterns mirror those reported in geographically distant cohorts, suggesting conserved microbial signatures of T2D across populations. The inverse correlation between microbiome diversity and HbA1c positions gut diversity as a potential non-invasive biomarker worth validating in longitudinal studies. Future research should incorporate dietary intake data and test whether targeted probiotic or dietary interventions can reverse the dysbiotic patterns documented here.
Figures and tables from the paper
| Species | Direction in t2d | Lda score | P-value |
|---|---|---|---|
| Ruminococcus gnavus | Enriched | 3.74 | < 0.001 |
| Escherichia coli | Enriched | 3.21 | 0.002 |
| Faecalibacterium prausnitzii | Depleted | 3.89 | < 0.001 |
| Akkermansia muciniphila | Depleted | 3.42 | < 0.001 |
Table text extracted from the original PDF; superscript letters are shown inline. The original table image is below.
View original table image
References
20 in the original paper- Qin J, Li Y, Cai Z, Li S, Zhu J, Zhang F. A metagenome-wide association study of gut microbiota in type 2 diabetes. Nature. 2012;490(7418):55-60.
- Karlsson FH, Tremaroli V, Nookaew I, Bergstrom G, Behre CJ, Fagerberg B. Gut metagenome in European women with normal, impaired and diabetic glucose control. Nature. 2013;498(7452):99-103.
- Franzosa EA, McIver LJ, Rahnavard G, Thompson LR, Schirmer M, Weingart G. Species-level functional profiling of metagenomes and metatranscriptomes. Nature Methods. 2018;15(11):962-968.
- Gurung M, Li Z, You H, Rodrigues R, Jump DB, Morgun A. Role of gut microbiota in type 2 diabetes pathophysiology. EBioMedicine. 2020;51:102590.
- Allin KH, Tremaroli V, Caesar R, Jensen BAH, Damgaard MTF, Bahl MI. Aberrant intestinal microbiota in individuals with prediabetes. Diabetologia. 2018;61(4):810-820.
- Beghini F, McIver LJ, Blanco-Miguez A, Dubois L, Asnicar F, Maharjan S. Integrating taxonomic, functional, and strain-level profiling of diverse microbial communities with bioBakery 3. eLife. 2021;10:e65088.
- Plovier H, Everard A, Druart C, Depommier C, Van Hul M, Geurts L. A purified membrane protein from Akkermansia muciniphila or the pasteurized bacterium improves metabolism in obese and diabetic mice. Nature Medicine. 2017;23(1):107-113.
- Zhong H, Ren H, Lu Y, Fang C, Hou G, Yang Z. Distinct gut metagenomics and metaproteomics signatures in prediabetics and treatment-naive type 2 diabetics. EBioMedicine. 2019;47:373-383.
- Le Chatelier E, Nielsen T, Qin J, Prifti E, Hildebrand F, Falony G. Richness of human gut microbiome correlates with metabolic markers. Nature. 2013;500(7464):541-546.
- Cani PD, Amar J, Iglesias MA, Poggi M, Knauf C, Bastelica D. Metabolic endotoxemia initiates obesity and insulin resistance. Diabetes. 2007;56(7):17611772.
- Pedersen HK, Gudmundsdottir V, Nielsen HB, Hyotylainen T, Nielsen T, Jensen BA. Human gut microbes impact host serum metabolome and insulin sensitivity. Nature. 2016;535(7612):376-381.
- Segata N, Izard J, Waldron L, Gevers D, Miropolsky L, Garrett WS. Metagenomic biomarker discovery and explanation. Genome Biology. 2011;12(6):R60.
- Turnbaugh PJ, Ley RE, Mahowald MA, Magrini V, Mardis ER, Gordon JI. An obesity-associated gut microbiome with increased capacity for energy harvest. Nature. 2006;444(7122):1027-1031.
- Wu H, Esteve E, Tremaroli V, Khan MT, Caesar R, Mannerås-Holm L. Metformin alters the gut microbiome of individuals with treatment-naive type 2 diabetes, contributing to the therapeutic effects of the drug. Nature Medicine. 2017;23(7):850-858.
- Forslund K, Hildebrand F, Nielsen T, Falony G, Le Chatelier E, Sunagawa S. Disentangling type 2 diabetes and metformin treatment signatures in the human gut microbiota. Nature. 2015;528(7581):262-266.
- Zeevi D, Korem T, Zmora N, Israeli D, Rothschild D, Weinberger A. Personalized nutrition by prediction of glycemic responses. Cell. 2015;163(5):1079-1094.
- Tilg H, Moschen AR. Microbiota and diabetes: an evolving relationship. Gut. 2014;63(9):1513-1521.
- Sonnenburg JL, Bäckhed F. Diet-microbiota interactions as moderators of human metabolism. Nature. 2016;535(7610):56-64.
- Zhao L, Zhang F, Ding X, Wu G, Lam YY, Wang X. Gut bacteria selectively promoted by dietary fibers alleviate type 2 diabetes. Science. 2018;359(6380):1151-1156.
- Fan Y, Pedersen O. Gut microbiota in human metabolic health and disease. Nature Reviews Microbiology. 2021;19(1):55-71.