
Research article · 2025 · Full text
International Journal of Biology SciencesLipid peroxidation and antioxidant defense in liver tissue of diabetic animal models
Volume 7(6) · Pages 463–466 · DOI: 10.33545/26649926.2025.v7.i6g.783 ↗
Research areasAntioxidant Activity and Oxidative StressRedox biology and oxidative stressNatural Antidiabetic Agents Studies
Abstract
Author-writtenWhile diabetes is known to raise systemic oxidative stress, the precise balance between lipid peroxidation and endogenous antioxidant defence in hepatic tissue across different stages of the disease remains poorly characterised. This research measured malondialdehyde (MDA) as a lipid peroxidation marker alongside superoxide dismutase (SOD), catalase (CAT), glutathione peroxidase (GPx), and reduced glutathione (GSH) in liver homogenates from streptozotocin (STZ)-induced diabetic Wistar rats at 4 and 8 weeks post-induction. Thirty-six male rats were divided into three groups: diabetic untreated (n = 12), diabetic treated with metformin (n = 12), and non-diabetic control (n = 12). All experimental procedures were performed at the Canterbury Institute of Ecology, Christchurch, New Zealand. By week 8, hepatic MDA in untreated diabetic rats was 2.8-fold higher than in controls (8.74 ± 1.23 vs. 3.12 ± 0.47 nmol/mg protein, p < 0.001), while SOD, CAT, and GPx activities declined by 41.3%, 37.8%, and 33.6%, respectively. GSH fell by 48.2%. Metformin partially restored antioxidant levels but did not normalise MDA. These results confirm that diabetes progressively tips the hepatic redox balance toward oxidative damage and that standard glucose-lowering therapy alone is insufficient to fully protect liver tissue.
Summary
Source-checkedPlain-language reading of the full paper, prepared with AI and checked against the text. Each point links to the authors' own words.
Why it matters
- The liver is a critical metabolic hub responsible for glucose processing, lipoprotein synthesis, and detoxification. View evidence ↗
- Persistent high blood sugar in diabetes disrupts the liver's redox balance, leading to lipid peroxidation. View evidence ↗
- Excessive reactive oxygen species (ROS) can cause oxidative damage to liver proteins, lipids, and DNA, potentially leading to steatosis, fibrosis, and cirrhosis. View evidence ↗
The question
- The study aimed to track specific oxidative and antioxidant markers in the liver over 8 weeks and evaluate if metformin treatment restores redox balance. View evidence ↗
What they did
- Rats were split into three groups of 12: untreated diabetic, metformin-treated diabetic (150 mg/kg/day), and non-diabetic controls; diabetes was induced using streptozotocin (STZ) at 55 mg/kg. View evidence ↗
- The researchers measured lipid peroxidation via MDA (TBARS method) and antioxidant levels via SOD, CAT, GPx, and GSH assays. View evidence ↗
- Six rats per group were analyzed at week 4 and week 8, with data analyzed using two-way ANOVA and Tukey post-hoc tests. View evidence ↗
What they found
- In untreated diabetic rats, hepatic MDA levels increased progressively, becoming 2.8 times higher than controls by week 8. View evidence ↗
- By week 8, all measured antioxidants in untreated diabetic rats declined relative to controls, with GSH showing the largest drop at 48.2%. View evidence ↗
- Metformin reduced the increase in MDA, but levels remained 1.9 times higher than controls at week 8, indicating it did not fully normalize the damage. View evidence ↗
- Fasting blood glucose showed a strong positive correlation with MDA (r = 0.81) and negative correlations with all antioxidant markers, including GSH (r = -0.77). View evidence ↗
What it means
- The authors conclude that because glucose-lowering therapy alone is insufficient, antioxidant supplements should be considered as complementary treatments. View evidence ↗
- The authors note that the STZ model mimics type 1 diabetes, which may not fully represent the insulin resistance seen in most human diabetic liver disease (type 2). View evidence ↗
Visual summary
3 visualsIllustrations explain the paper; charts are replotted from the paper's own table values.
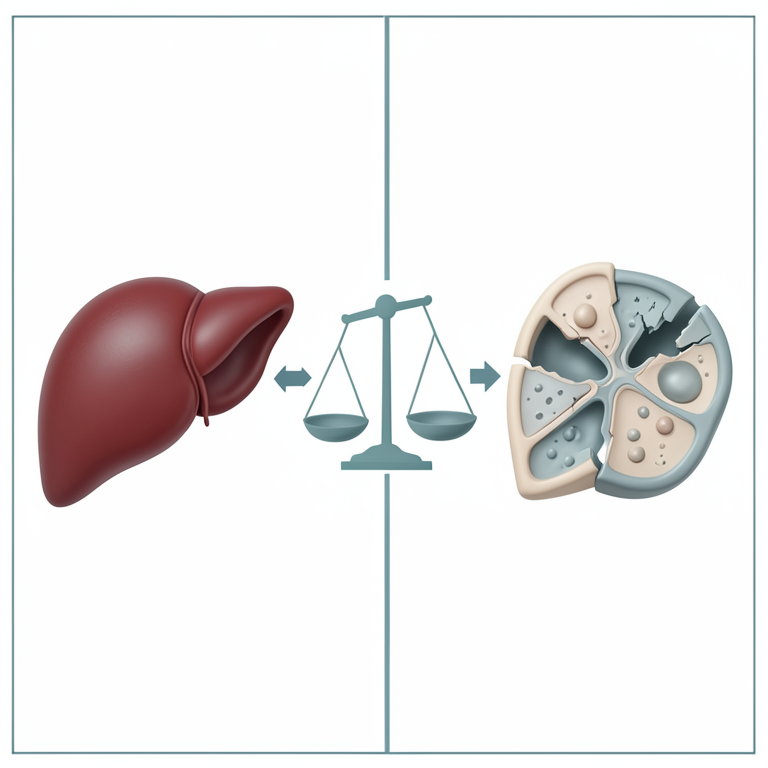
The Redox Imbalance Cycle
AI-generated conceptual illustration (rat liver tissue). It explains the idea and does not show study data.
View source evidence ↗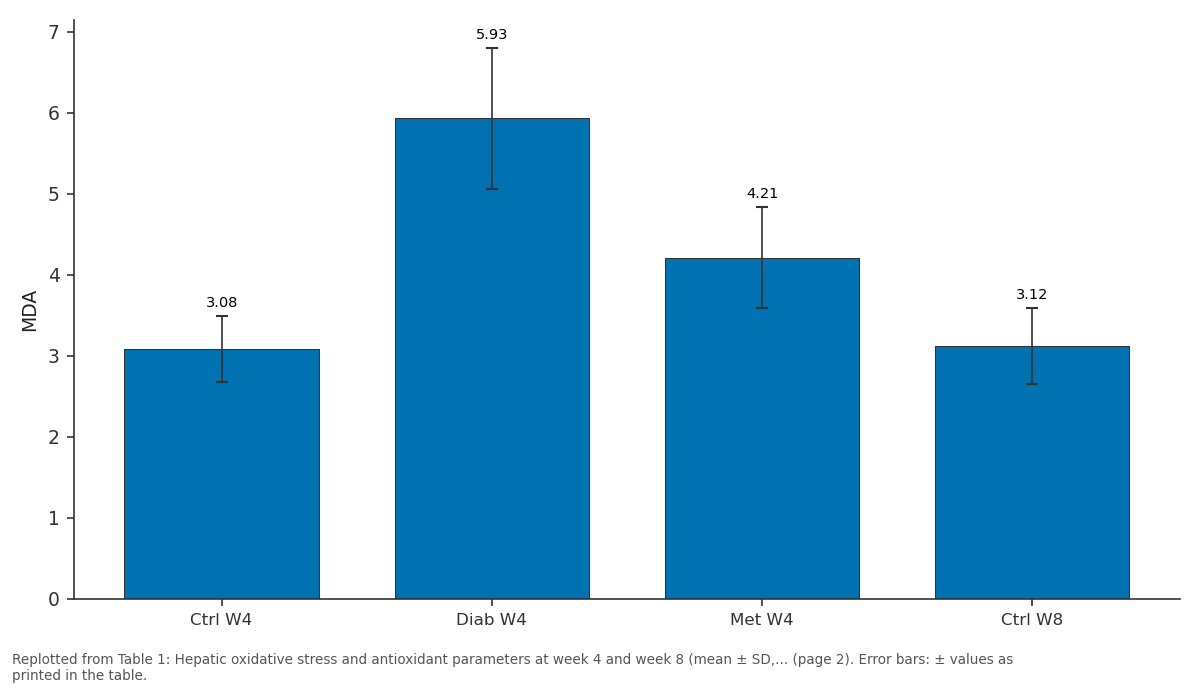
MDA: Ctrl W4 vs Diab W4 vs Met W4 vs Ctrl W8
Replotted from Table 1 (page 2) of the original paper. Every bar is the paper's own table value.
View source evidence ↗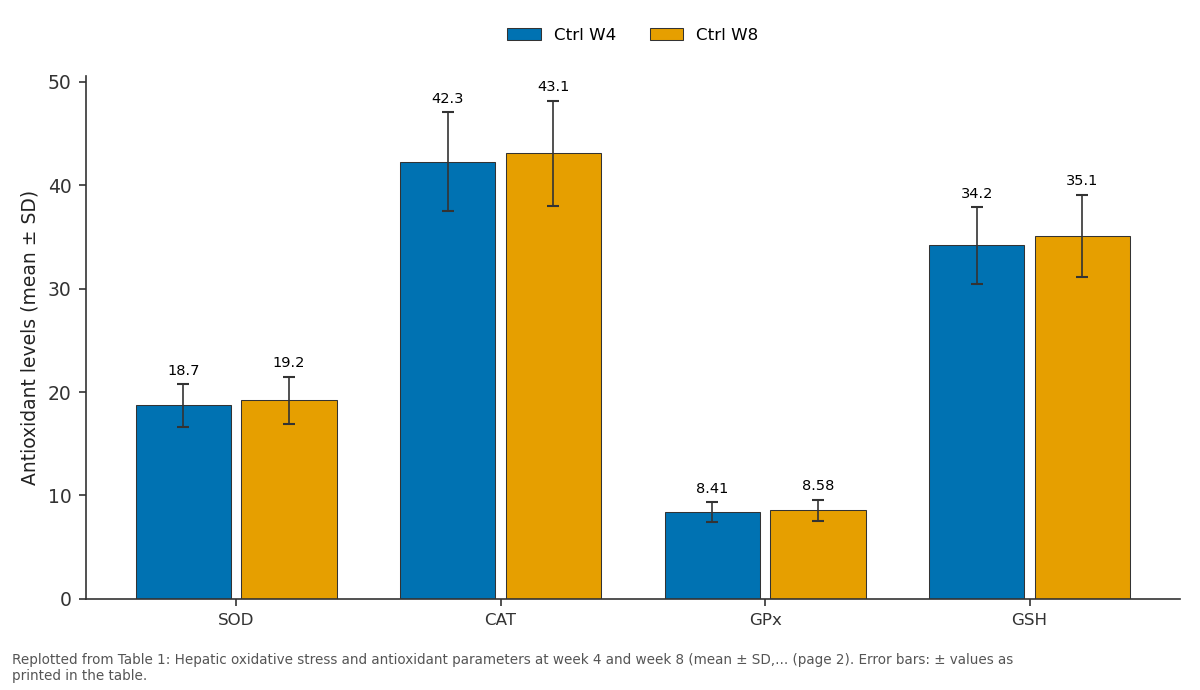
Ctrl W4 and Ctrl W8: SOD vs CAT vs GPx vs GSH
Replotted from Table 1 (page 2) of the original paper. Every bar is the paper's own table value.
View source evidence ↗Figures & tables
From the original paper Table 1
 Table 2
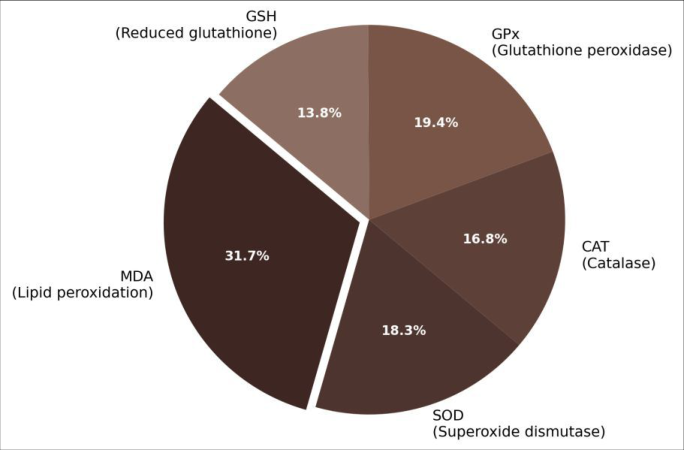 Figure 1
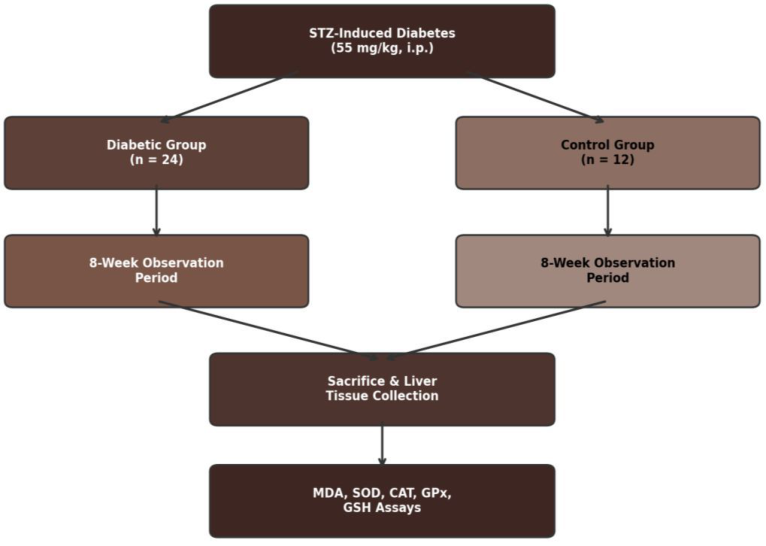 Figure 2
Introduction
The liver sits at the metabolic centre of the body it processes glucose, synthesises lipoproteins, and detoxifies xenobiotics. But the same metabolic intensity that makes it essential also makes it vulnerable. Under normal conditions, reactive oxygen species (ROS) generated during mitochondrial respiration are scavenged by an antioxidant network of enzymes and small molecules [1] . In diabetes, persistent hyperglycaemia overloads this system by promoting electron leakage from the mitochondrial electron transport chain, activating NADPH oxidase, and accelerating auto-oxidation of glucose [2] . The result is a tilt in the redox balance that favours lipid peroxidation a chain reaction in which ROS attack polyunsaturated fatty acids in cell membranes, producing toxic aldehydes such as malondialdehyde (MDA) and 4-hydroxynonenal [3] . Superoxide dismutase (SOD), catalase (CAT), and glutathione peroxidase (GPx) form the enzymatic first line of defence. SOD converts superoxide anions to hydrogen peroxide, which CAT and GPx then reduce to water [4] . Reduced glutathione (GSH) serves as both a direct ROS scavenger and a cofactor for GPx. When ROS production outpaces these defences, oxidative damage accumulates in proteins, lipids, and DNA, contributing to hepatic steatosis, fibrosis, and eventually cirrhosis in diabetic patients [5] . The streptozotocin (STZ)-induced rat model reproduces many features of type 1 diabetes, including sustained hyperglycaemia, weight loss, and multi-organ oxidative stress, making it a widely accepted platform for studying diabetic tissue damage [6] . However, most previous research measured oxidative markers at a single time point, leaving the temporal progression of the peroxidation-antioxidant imbalance unclear. This research aimed to a) Track hepatic MDA, SOD, CAT, GPx, and GSH at 4 and 8 weeks after STZ injection, b) Compare untreated diabetic rats with those receiving metformin to determine whether glucose normalisation alone restores redox balance, and c) Identify which antioxidant component deteriorates fastest.
Material and Methods
Material and Methods
Extraction protocol
At sacrifice, liver lobes were excised, rinsed in ice-cold saline (0.9% NaCl), blotted dry, weighed, and snap-frozen in liquid nitrogen. Tissue was homogenised (10% w/v) in 50 mM phosphate buffer (pH 7.4) containing 1 mM EDTA using a Potter-Elvehjem glass-Teflon homogeniser at 4 °C.
Homogenates were centrifuged at 10,000 × g for 15 min at 4 °C, and supernatants were aliquoted for enzyme assays, MDA measurement, and protein determination.
Material
Thirty-six male Wistar rats (
Methods
MDA was quantified by the thiobarbituric acid reactive substances (TBARS) method, reading absorbance at 532 nm [7] . SOD activity was measured by the nitro blue tetrazolium reduction assay [8] . CAT activity was determined by monitoring H₂O₂ decomposition at 240 nm [9] . GPx was assayed using the coupled reaction with glutathione reductase and NADPH [10] . GSH was measured by Ellman's reagent (DTNB) at 412 nm. Protein concentration was determined by the Bradford method. Six rats per group were sacrificed at week 4 and the remaining six at week 8 for longitudinal comparison. Statistical analysis used two-way ANOVA (group × time) with Tukey post-hoc tests in GraphPad Prism v9.5; significance was set at p<0.05.
Instrumentation and analytical equipment
Spectrophotometric assays were performed on a Shimadzu UV-1900i double-beam spectrophotometer (Shimadzu Corporation, Kyoto, Japan). Blood glucose was monitored weekly using an Accu-Chek Performa glucometer (Roche Diagnostics, Basel, Switzerland). Tissue homogenisation used a Heidolph RZR 2102 overhead stirrer fitted with a glass-Teflon pestle. All assays were read within 2 h of sample preparation to minimise post-homogenisation oxidation artefacts.
Ethical considerations
All animal procedures were approved by the Canterbury Institute of Ecology Animal Ethics Committee (Protocol CIE-AEC-2022-031, approved 8 February 2022) in accordance with the New Zealand Animal Welfare Act 1999. Animals were monitored daily for signs of distress. Any rat losing more than 20% of baseline body weight or showing signs of severe illness was humanely euthanised by CO₂ inhalation followed by cervical dislocation. Hepatic MDA rose progressively in untreated diabetic rats, reaching 2.8-fold above control by week 8 (p<0.001; Table 1). All four antioxidant parameters declined in parallel: SOD fell 41.3%, CAT 37.8%, GPx 33.6%, and GSH 48.2%
| Parameter | Ctrl W4 | Diab W4 | Met W4 | Ctrl W8 | Diab W8 | Met W8 |
|---|---|---|---|---|---|---|
| MDA | 3.08±0.41 | 5.93±0.87 | 4.21±0.62 | 3.12±0.47 | 8.74±1.23 | 5.87±0.91 |
| SOD | 18.7±2.1 | 13.4±1.8 | 16.1±2.0 | 19.2±2.3 | 11.3±1.6 | 14.8±1.9 |
| CAT | 42.3±4.8 | 31.7±3.6 | 37.4±4.1 | 43.1±5.1 | 26.8±3.2 | 33.6±3.8 |
| GPx | 8.41±0.94 | 6.23±0.78 | 7.34±0.86 | 8.58±1.01 | 5.71±0.72 | 6.92±0.84 |
| GSH | 34.2±3.7 | 21.8±2.9 | 28.4±3.3 | 35.1±4.0 | 18.2±2.4 | 25.7±3.1 |
Table text extracted from the original PDF; superscript letters are shown inline. The original table image is below.
View original table image
Results
relative to controls at week 8. Metformin treatment attenuated but did not normalise these changes MDA in the metformin group was still 1.9-fold above control at week 8 (p = 0.003). Fasting blood glucose correlated positively with MDA (r = 0.81) and negatively with all antioxidant markers (Table 2). GSH showed the second-strongest correlation (r = -0.77),
| Parameter | r | p-value | R² |
|---|---|---|---|
| MDA | 0.81 | < 0.001 | 0.66 |
| SOD | −0.73 | < 0.001 | 0.53 |
| CAT | −0.68 | < 0.001 | 0.46 |
| GPx | −0.61 | 0.002 | 0.37 |
| GSH | −0.77 | < 0.001 | 0.59 |
Table text extracted from the original PDF; superscript letters are shown inline. The original table image is below.
View original table image
suggesting that non-enzymatic glutathione depletion is particularly sensitive to glycaemic load.
Comprehensive interpretation
The pie chart (Figure 1) illustrates that MDA dominates the oxidative burden, contributing 31.7% of the composite profile, while the enzymatic defences (SOD, CAT, GPx) are each depressed to a similar degree. The flowchart (Figure 2) traces the experimental timeline from diabetes induction through sacrifice and biochemical assay.
Discussion
The progressive rise in hepatic MDA alongside declining antioxidant enzyme activities confirms that diabetes creates a widening redox deficit in the liver over time [11] . The 48.2% GSH depletion was the single largest change, consistent with reports that hepatic glutathione turnover is accelerated under chronic hyperglycaemia because GSH is consumed both as a direct radical scavenger and as a substrate for GPx [12] . The finding that metformin reduced but did not eliminate the redox imbalance is clinically relevant it suggests that glucose control alone may not prevent oxidative hepatic injury and that adjunct antioxidant strategies deserve investigation [13] .
The strong positive correlation between fasting glucose and MDA (r = 0.81) implies a dose-response relationship: the worse the glycaemic control, the greater the lipid peroxidation load. This gradient supports the rationale for intensive early glycaemic management to slow hepatic oxidative damage [14] .
A limitation of the STZ model is that it produces insulindeficient (type 1-like) diabetes, whereas most human diabetic liver disease occurs in the context of insulin resistance and type 2 diabetes. High-fat-diet plus low-dose STZ models may better approximate the human condition [15] . Additionally, only two time points were assessed; more frequent sampling would clarify the kinetics of antioxidant decline.
Conclusion
This research shows that experimental diabetes induces a time-dependent deterioration of the hepatic redox balance, with MDA rising 2.8-fold and GSH falling nearly 50% over eight weeks. All four antioxidant parameters SOD, CAT, GPx, and GSH declined in parallel, but GSH was the most severely affected. Metformin provided partial protection, reducing MDA by about one-third compared with untreated diabetic animals, yet could not return any parameter to control levels. These data argue that antioxidant supplementation should be evaluated as a complement to standard glucose-lowering therapy for preserving hepatic health in diabetes.
References
20 in the original paper- Halliwell B, Gutteridge JMC. Free radicals in biology and medicine. Fifth edition. Oxford University Press. 2015;Oxford.
- Brownlee M. Biochemistry and molecular cell biology of diabetic complications. Nature. 2001;414(6865):813820.
- Ayala A, Munoz MF, Arguelles S. Lipid peroxidation: production, metabolism, and signaling mechanisms of malondialdehyde and 4-hydroxy-2-nonenal. Oxidative Medicine and Cellular Longevity. 2014;2014:360438.
- Ighodaro OM, Akinloye OA. First line defence antioxidants superoxide dismutase (SOD), catalase (CAT) and glutathione peroxidase (GPX): their fundamental role in the entire antioxidant defence grid. Alexandria Journal of Medicine. 2018;54(4):287-293.
- Mohamed J, Nazratun Nafizah AH, Zariyantey AH, Budin SB. Mechanisms of diabetes-induced liver damage: the role of oxidative stress and inflammation. Sultan Qaboos University Medical Journal. 2016;16(2):e132-e141.
- Szkudelski T. The mechanism of alloxan and streptozotocin action in B cells of the rat pancreas. Physiological Research. 2001;50(6):537-546.
- Ohkawa H, Ohishi N, Yagi K. Assay for lipid peroxides in animal tissues by thiobarbituric acid reaction. Analytical Biochemistry. 1979;95(2):351-358.
- Beauchamp C, Fridovich I. Superoxide dismutase: improved assays and an assay applicable to acrylamide gels. Analytical Biochemistry. 1971;44(1):276-287.
- Aebi H. Catalase in vitro. Methods in Enzymology. 1984;105:121-126.
- Paglia DE, Valentine WN. Studies on the quantitative and qualitative characterization of erythrocyte glutathione peroxidase. Journal of Laboratory and Clinical Medicine. 1967;70(1):158-169.
- Rains JL, Jain SK. Oxidative stress, insulin signaling, and diabetes. Free Radical Biology and Medicine. 2011;50(5):567-575.
- Maritim AC, Sanders RA, Watkins JB. Diabetes, oxidative stress, and antioxidants: a review. Journal of Biochemical and Molecular Toxicology. 2003;17(1):2438.
- Foretz M, Guigas B, Viollet B. Understanding the glucoregulatory mechanisms of metformin in type 2 diabetes mellitus. Nature Reviews Endocrinology. 2019;15(10):569-589.
- Giacco F, Brownlee M. Oxidative stress and diabetic complications. Circulation Research. 2010;107(9):1058-1070.
- Srinivasan K, Viswanad B, Asrat L, Kaul CL, Ramarao P. Combination of high-fat diet-fed and low-dose streptozotocin-treated rat: a model for type 2 diabetes and pharmacological screening. Pharmacological Research. 2005;52(4):313-320.
- Matough FA, Budin SB, Hamid ZA, Alwahaibi N, Mohamed J. The role of oxidative stress and antioxidants in diabetic complications. Sultan Qaboos University Medical Journal. 2012;12(1):5-18.
- Rehman K, Akash MS. Mechanism of generation of oxidative stress and pathophysiology of type 2 diabetes mellitus: how are they interlinked? Journal of Cellular Biochemistry. 2017;118(11):3577-3585.
- Nishikawa T, Edelstein D, Du XL, Yamagishi S, Matsumura T, Kaneda Y. Normalizing mitochondrial superoxide production blocks three pathways of hyperglycaemic damage. Nature. 2000;404(6779):787790.
- Birben E, Sahiner UM, Sackesen C, Erzurum S, Kalayci O. Oxidative stress and antioxidant defense. World Allergy Organization Journal. 2012;5(1):9-19.
- Tangvarasittichai S. Oxidative stress, insulin resistance, dyslipidemia and type 2 diabetes mellitus. World Journal of Diabetes. 2015;6(3):456-480.