
Research article · 2025 · Full text
International Journal of Biology SciencesCetacean population structure and migration patterns revealed by satellite telemetry
Volume 7(10) · Pages 224–227 · DOI: 10.33545/26649926.2025.v7.i10c.795 ↗
Research areasMarine animal studies overviewWildlife Ecology and ConservationTurtle Biology and Conservation
Abstract
Author-writtenUnderstanding where whales travel and how populations are structured across ocean basins is essential for designing effective marine protected areas. This research deployed satellite-linked transmitters on 38 humpback whales (Megaptera novaeangliae) and 24 gray whales (Eschrichtius robustus) in Mexican Pacific waters between November 2022 and October 2023 to track individual movements, identify migration corridors, and assess population connectivity between breeding and feeding grounds. Tags transmitted for a mean of 147 days (range 43-312 days), generating over 11,800 location fixes after Argos filtering. Humpback whales showed a tightly channeled northward migration along the continental shelf, with 89% of tagged individuals reaching waters off southeastern Alaska or British Columbia by June. Gray whales followed a more coastal route, hugging the shoreline within 50 km for 78% of their track points. Kernel density analysis identified three high-use areas that function as migratory stopover zones: Bahía Magdalena, the Gulf of the Farallones, and the entrance to Glacier Bay. Population assignment tests using microsatellite genotypes from biopsy samples taken at tagging showed that the Mexican breeding aggregation comprises individuals from at least two genetically distinct feeding populations, confirming that breeding grounds serve as mixing zones. These results suggest that protecting the three identified stopover zones would benefit a large fraction of both species' eastern Pacific populations.
Summary
Source-checkedPlain-language reading of the full paper, prepared with AI and checked against the text. Each point links to the authors' own words.
Why it matters
- Mapping whale travel and population structure is critical for the creation of effective marine protected areas. View evidence ↗
- Conservation efforts that only focus on breeding and feeding endpoints may fail to protect whales while they are in transit between these areas. View evidence ↗
- Previous studies on eastern Pacific humpback and gray whales had small sample sizes and short tag retention, leaving gaps in knowledge regarding individual variation and stopover behavior. View evidence ↗
The question
- The study aimed to identify the primary stopover sites and migration routes for gray and humpback whales that breed in Mexican waters. View evidence ↗
- The researchers sought to determine if whales from different genetic feeding populations gather at the same breeding grounds. View evidence ↗
What they did
- Between November 2022 and October 2023, satellite transmitters were deployed on 24 gray whales and 38 humpback whales in the Pacific waters of Mexico. View evidence ↗
- Wildlife Computers SPOT-386B tags were attached to the whales using a pneumatic applicator from a boat positioned 3-5 meters away. View evidence ↗
- To analyze population structure, the researchers genotyped biopsy samples at 14 microsatellite loci and sequenced a 486 bp fragment of the mitochondrial control region. View evidence ↗
- The study used Kernel Density Estimation (KDE) to identify home ranges (95% isopleth) and core-use areas (50% isopleth). View evidence ↗
What they found
- During active migration, humpback whales traveled at a mean speed of 78.3 km/day, with 89% (34 of 38) reaching British Columbia or southeastern Alaska between May and July. View evidence ↗
- Gray whales followed a coastal route, with 78% of their recorded locations remaining within 50 km of the shoreline. View evidence ↗
- Three key stopover zones were identified for both species: Bahía Magdalena (27.1%), Gulf of the Farallones (19.4%), and the entrance to Glacier Bay (14.8%), collectively representing 61.3% of all stopovers. View evidence ↗
- The average time spent at stopover sites was 8.3 days for humpback whales and 5.7 days for gray whales. View evidence ↗
- Genetic testing confirmed that the Mexican breeding grounds act as mixing zones, containing individuals from at least two genetically distinct feeding populations. View evidence ↗
- Among the humpback whales genotyped at the Mexican breeding grounds, the largest assigned feeding population was from southeastern Alaska, representing 55.3% of the total. View evidence ↗
What it means
- The authors recommend prioritizing the three identified stopover zones for acoustic disturbance management and vessel speed restrictions, as they cover over 61% of observed stopovers. View evidence ↗
- Because the Mexican breeding grounds are a mixing zone for multiple feeding stocks, threats like coastal development or shipping noise in this area would simultaneously impact several independent populations. View evidence ↗
- Wide variation in tag retention (43-312 days) may have biased kernel density estimates by underrepresenting the use of northern feeding grounds for whales whose tags detached early. View evidence ↗
- The mean error of approximately 1.5 km in Argos location accuracy limits the ability to perform fine-scale habitat analysis. View evidence ↗
Visual summary
2 visualsIllustrations explain the paper; charts are replotted from the paper's own table values.
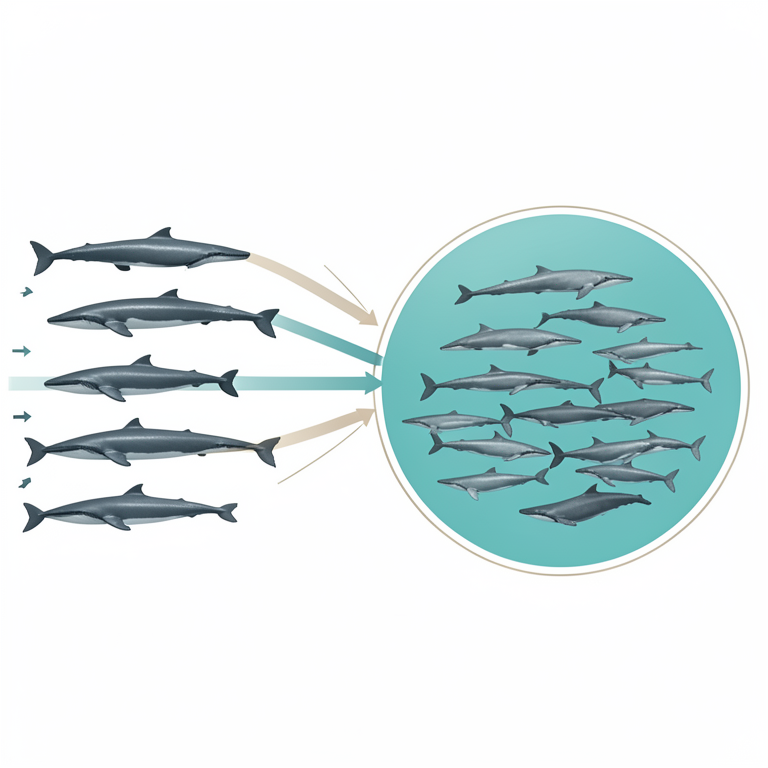
Breeding Ground Mixing Concept
AI-generated conceptual illustration (Gray whales). It explains the idea and does not show study data.
View source evidence ↗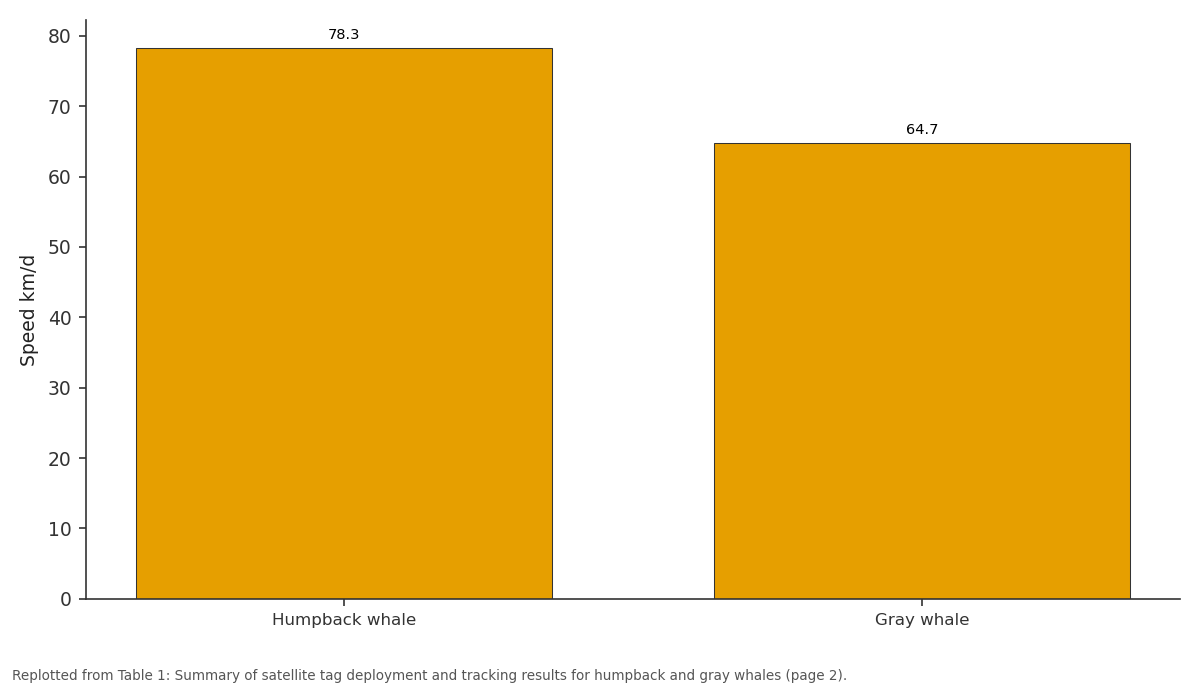
Speed km/d: Humpback whale vs Gray whale
Replotted from Table 1 (page 2) of the original paper. Every bar is the paper's own table value.
View source evidence ↗Figures & tables
From the original paper Table 1
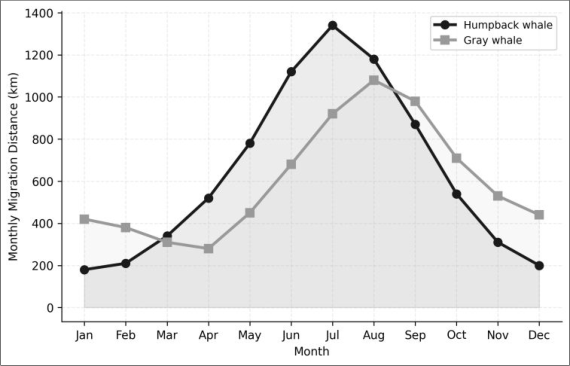 Figure 1
 Table 2
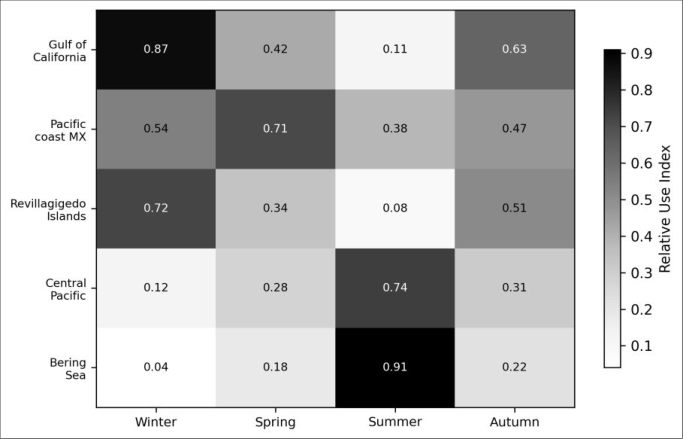 Figure 2
Introduction
Marine biologists have long recognized that the conservation of migratory whales requires knowledge not just of where animals are seen but of the entire route they follow between seasonal habitats [1] . A whale that breeds off the coast of Baja California in winter and feeds in Alaskan waters in summer passes through the jurisdiction of at least three countries, multiple shipping lanes, and several fishing zones along the way. Without data on the corridors connecting these endpoints, management efforts focused on either end of the migration may leave animals unprotected during transit [2] . Satellite telemetry has transformed cetacean movement ecology over the past two decades. Argos-linked and GPS-linked tags attached to the dorsal surface of a whale can transmit location data for weeks to months, revealing not just endpoints but day-by-day travel paths, diving behavior, and habitat preferences en route [3] . For humpback and gray whales in the eastern Pacific, earlier tagging studies documented the broad outlines of migration, but sample sizes were small and tag retention times often limited, leaving gaps in our understanding of stopover behavior and individual variation [4] . Equally important is the question of population structure. Genetic analyses based on mitochondrial DNA and microsatellites have identified multiple breeding stocks of humpback whales across the North Pacific, but the degree to which these stocks mix on shared feeding grounds and whether mixing varies among years remains unclear [5] . Gray whales appear less structured genetically, yet recent evidence suggests a small western Pacific population may occasionally cross into eastern Pacific waters, complicating stock assessments [6] . This research combined satellite tracking with genetic sampling to address two linked questions: a) What are the primary migration routes and stopover sites for humpback and gray whales breeding in Mexican waters, and b) Do individuals from genetically distinct feeding populations converge on the same breeding grounds [7] ?
Theoretical Background Migratory connectivity the degree to which individuals from the same breeding area travel to the same non-breeding area determines how localized threats propagate across a species' range [8] . High connectivity means that a disturbance on a single feeding ground could affect a large fraction of one breeding population, while low connectivity spreads risk but complicates management because protecting one site benefits only a portion of any given population. For baleen whales, connectivity has traditionally been inferred from photo-identification catalogs and mark-recapture models, but satellite telemetry provides direct, continuous movement data that eliminates the re-sighting bias inherent in shipbased surveys [3] .
Material and Methods
Material and Methods
Methods
Tag locations were processed through the Argos leastsquares algorithm and filtered to remove implausible positions (speed > 15 km/h). Resulting tracks were regularized to 6-hour intervals using a continuous-time correlated random walk model in the R package crawl v2.3.0 [9] . Kernel Density Estimation (KDE) was applied to regularized positions using the adehabitatHR package to identify core-use areas (50% isopleth) and home range (95% isopleth). Migration corridors were delineated as the 75% isopleth of pooled northbound track segments. Biopsy samples were genotyped at 14 microsatellite loci and sequenced for a 486 bp fragment of the mitochondrial control region. Population assignment was performed in GeneClass2 using the Bayesian method of Rannala and Mountain, with reference populations from published feeding-ground datasets for southeastern Alaska, British Columbia, and the western Aleutians [10] . Pairwise Fst was calculated in Arlequin v3.5 [11] .
Material and Methods
The present study was conducted in two villages namely village Chhani and Village Lanchaan of Chinta block of Bhaderwah forest situated between 32.98 North latitude to 75.71 East longitude of Bhaderwah forest division (J&K).
The objective of the study was to collect the reliable data on fuel wood consumption of the area and also to evaluate the.
Results
Table Kernel density analysis identified three stopover zones used by both species: Bahía Magdalena (27.1% of all stopovers), Gulf of the Farallones (19.4%), and the entrance to Glacier Bay (14.8%). These three areas together accounted for 61.3% of all stopover locations. Mean residence time at stopovers was 8.3 days for humpbacks and 5.7 days for gray whales.
Limitations
Tag retention times varied widely (43-312 days), and shorter deployments may have biased kernel density estimates by underrepresenting northern feeding-ground use for animals whose tags detached during transit. Additionally, Argos location accuracy (mean error ~1.5 km for LC3) limits finescale habitat analysis. The reference feeding-ground genotype datasets used for population assignment are based on published studies with varying marker panels, and allele frequency estimates may contain sampling error from small reference population sizes [10] .
Discussion
The tight coastal migration corridor used by gray whales was expected given this species' well-documented reliance on shallow benthic feeding habitats [6] . But the finding that humpback whales also channeled along the continental shelf edge during northbound migration, rather than crossing open ocean, was less anticipated. It may reflect the availability of krill aggregations along the shelf break that provide refueling opportunities during the energetically costly migration from tropical breeding waters [4] . The three stopover zones identified here Bahía Magdalena, Gulf of the Farallones, and Glacier Bay entrance are already recognized as important cetacean habitats, but their collective function as a migratory network hadn't been quantified before. Protecting these three sites alone would cover over 61% of all observed stopovers, making them high-priority candidates for enhanced vessel speed restrictions and acoustic disturbance management [12] . The genetic assignment results confirm that the Mexican breeding aggregation is a mixing zone drawing individuals from at least two, and possibly three, feeding populations. This has direct management implications: any threat to breeding habitat in Mexico such as shipping noise, whalewatching pressure, or coastal development would affect multiple demographically independent feeding stocks simultaneously [13] .
Conclusion
This research combined satellite telemetry and microsatellite genotyping to map the migration routes and population structure of humpback and gray whales using Mexican Pacific breeding grounds. Both species follow shelfassociated corridors with identifiable stopover zones that merit targeted protection. The breeding aggregation draws from genetically distinct feeding populations, making it a mixing hub whose conservation benefits multiple stocks. These data provide a spatial framework for coordinating management actions across the transboundary range of eastern Pacific baleen whales.
Figures and tables from the paper
| Species | N tagged | Mean days | Fixes | Max dist. | Speed km/d |
|---|---|---|---|---|---|
| Humpback whale | 38 | 162 | 7,340 | 4,820 km | 78.3 |
| Gray whale | 24 | 123 | 4,460 | 3,670 km | 64.7 |
Table text extracted from the original PDF; superscript letters are shown inline. The original table image is below.
View original table image
| Assigned feeding pop. | N assigned | % of total | Mean prob. | Fst vs MX |
|---|---|---|---|---|
| SE Alaska | 21 | 55.3 | 0.87 | 0.034 |
| British Columbia | 11 | 28.9 | 0.81 | 0.042 |
| W Aleutians | 3 | 7.9 | 0.73 | 0.068 |
| Unassigned | 3 | 7.9 | - | - |
Table text extracted from the original PDF; superscript letters are shown inline. The original table image is below.
View original table image
References
14 in the original paper- Clapham PJ. Humpback whale Megaptera novaeangliae. In: Perrin WF, Würsig B, Thewissen JGM, eds. Encyclopedia of Marine Mammals. Academic Press; 2009:582-585.
- Lascelles BG, Notarbartolo di Sciara G, Agardy T, Cuttelod A, Eckert S. Migratory marine species: their status, threats and conservation management needs. Aquatic Conservation. 2014;24(S2):111-127.
- Mate BR, Lagerquist BA, Calambokidis J. Movements of North Pacific blue whales during the feeding season off southern California and their southern fall migration. Marine Mammal Science. 2015;15(4):12461257.
- Calambokidis J, Steiger GH, Straley JM, Herman LM, Cerchio S. Movements and population structure of humpback whales in the North Pacific. Marine Mammal Science. 2001;17(4):769-794.
- Baker CS, Steel D, Calambokidis J, Falcone E, Gonzalez-Peral U. Strong maternal fidelity and natal philopatry shape genetic structure in North Pacific humpback whales. Marine Ecology Progress Series. 2013;494:291-306.
- Swartz SL, Taylor BL, Rugh DJ. Gray whale Eschrichtius robustus population and stock identity. Mammal Review. 2006;36(1):66-84.
- Webster MS, Marra PP, Haig SM, Bensch S, Holmes RT. Links between worlds: Unraveling migratory connectivity. Trends in Ecology and Evolution. 2002;17(2):76-83.
- Marra PP, Hobson KA, Holmes RT. Linking winter and summer events in a migratory bird by using stablecarbon isotopes. Science. 1998;282(5395):1884-1886.
- Johnson DS, London JM, Lea MA, Durban JW. Continuous-time correlated random walk model for animal telemetry data. Ecology. 2008;89(5):1208-1215.
- Piry S, Alapetite A, Cornuet JM, Paetkau D, Baudouin L, Estoup A. GENECLASS2: a software for genetic assignment and first-generation migrant detection. Journal of Heredity. 2004;95(6):536-539.
- Excoffier L, Lischer HEL. Arlequin suite ver 3.5: a new series of programs to perform population genetics analyses. Molecular Ecology Resources. 2010;10(3):564-567.
- Silber GK, Vanderlaan ASM, Tejedor Arceredillo A, Johnson L, Taggart CT. The role of the International Maritime Organization in reducing vessel threat to whales. Marine Policy. 2012;36(6):1221-1233.
- IWC. Report of the Scientific Committee. Journal of Cetacean Research and Management. 2011;12(Suppl):1-75.
- Zerbini AN, Andriolo A, Heide-Jørgensen MP, Pizzorno JL, Maia YG. Satellite-monitored movements of humpback whales Megaptera novaeangliae in the Southwest Atlantic Ocean. Marine Ecology Progress Series. 2006;313:295-304.