
Research article · 2025 · Full text
International Journal of Biology SciencesMicroclimatic variation and its influence on epiphytic bryophyte distribution in cloud forests
Volume 7(10) · Pages 208–211 · DOI: 10.33545/26649926.2025.v7.i10c.791 ↗
Research areasBryophyte Studies and RecordsFern and Epiphyte BiologyLichen and fungal ecology
Abstract
Author-writtenCloud forests are known for their persistent fog immersion, which generates steep microclimatic gradients over short vertical distances within the forest canopy. Epiphytic bryophytes mosses, liverworts, and hornworts growing on tree surfaces are especially sensitive to these gradients because they lack roots and rely on atmospheric moisture for hydration. This research examined how temperature, relative humidity, photosynthetically active radiation, and wind speed vary across six vertical strata in a montane cloud forest fragment near Barcelona, Spain, and how these microclimatic differences shape bryophyte species composition and cover. Thirty host trees were instrumented with dataloggers from April 2023 to February 2024, and bryophyte communities were surveyed on bark quadrats at each stratum. A total of 67 bryophyte species were recorded, with species richness peaking at branch forks in the mid-canopy (21 species, mean cover 51.7%). Redundancy analysis showed that relative humidity explained 34.2% of species composition variance, followed by light availability (18.7%) and temperature (11.4%). Indicator species analysis identified moisture-demanding pleurocarpous mosses as indicators of lower-trunk positions and sun-tolerant acrocarpous species as outer-canopy specialists. The results confirm that even within a single tree, microclimatic filtering operates strongly enough to generate distinct bryophyte assemblages at different heights, and that humidity is the dominant driver in cloud forest systems.
Summary
Source-checkedPlain-language reading of the full paper, prepared with AI and checked against the text. Each point links to the authors' own words.
Why it matters
- Cloud forests are characterized by constant fog, which creates significant changes in microclimate over short vertical distances in the canopy. View evidence ↗
- Epiphytic bryophytes are highly sensitive to microclimatic gradients because they lack roots and depend on atmospheric moisture. View evidence ↗
- Understanding how internal canopy gradients influence species distribution is critical for conservation, as climate change and fragmentation may eliminate sensitive bryophyte groups. View evidence ↗
The question
- The study aimed to determine how climatic variables change with canopy height, which variables drive bryophyte composition, and whether specific indicator species exist for different niches. View evidence ↗
What they did
- The study took place in a 14-hectare fragment of montane cork and holm oak forest in Collserola Natural Park, Spain. View evidence ↗
- Bryophyte communities were surveyed using 540 total bark quadrats (20 x 20 cm), with three replicates per height per tree. View evidence ↗
What they found
- From the forest floor to the outer canopy, the mean temperature increased by 4.6°C and relative humidity decreased by 23.1 percentage points. View evidence ↗
- The inner canopy had the highest species richness (21 species) and peak cover (51.7%), while the outer canopy had the lowest richness (11 species). View evidence ↗
- Relative humidity was the primary driver of species composition (explaining 34.2% of variation), followed by light availability (18.7%) and temperature (11.4%). View evidence ↗
- Specific species served as indicators for different strata: Neckera complanata and Isothecium alopecuroides for the lower trunk, and Orthotrichum lyellii and Grimmia pulvinata for the outer canopy. View evidence ↗
- A 23-day summer dry spell led to a 14% decline in bryophyte cover in the outer canopy and upper trunk, whereas lower strata were buffered and showed less than 3% change. View evidence ↗
What it means
- The authors conclude that conservation must focus on maintaining structural complexity and canopy layers to preserve the microclimatic heterogeneity essential for bryophyte survival. View evidence ↗
- The authors note that outer-canopy specialists are particularly vulnerable to local extinction if future climate scenarios increase the length of dry spells. View evidence ↗
Visual summary
3 visualsIllustrations explain the paper; charts are replotted from the paper's own table values.
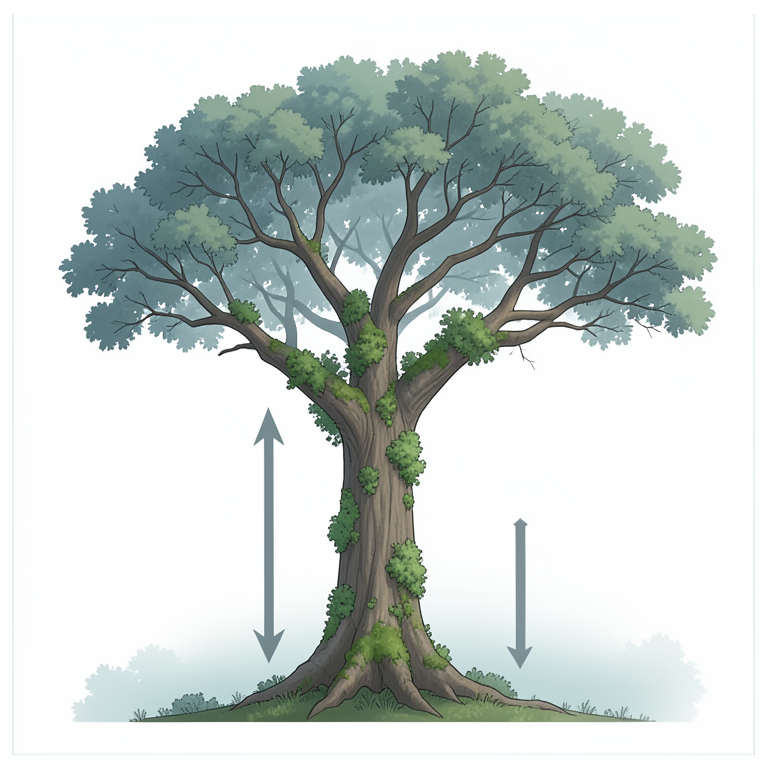
Vertical Canopy Gradient
AI-generated conceptual illustration (cloud forest tree with epiphytic bryophytes). It explains the idea and does not show study data.
View source evidence ↗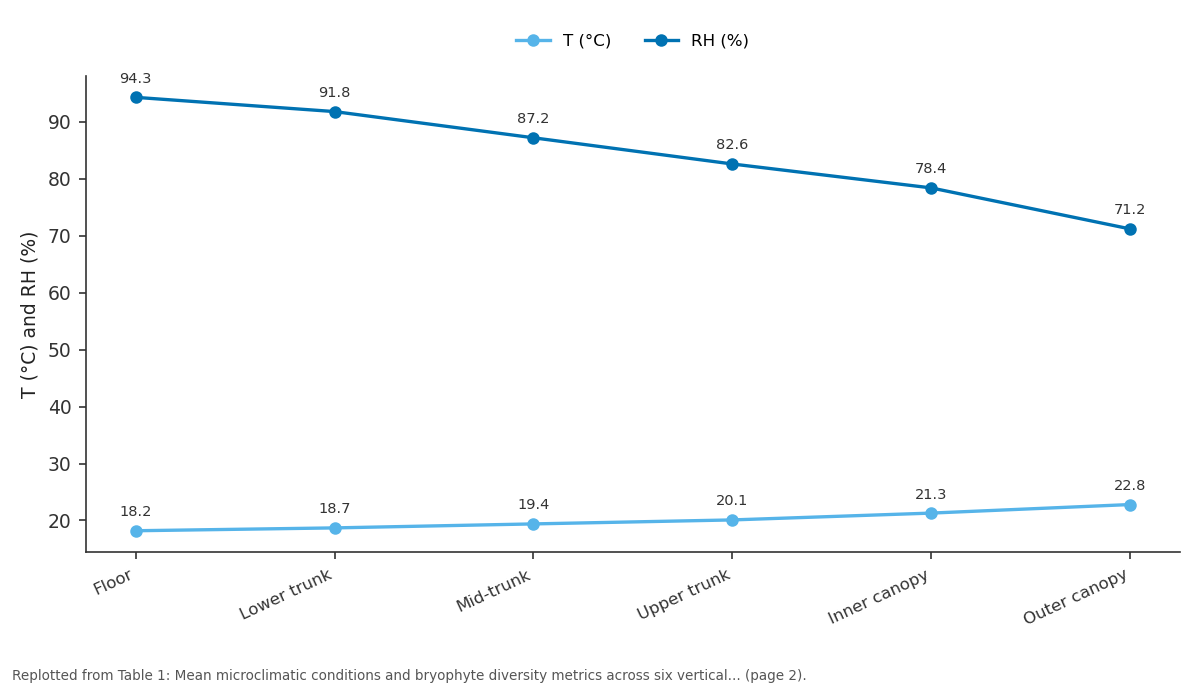
T (°C) and RH (%): Floor vs Lower trunk vs Mid-trunk vs Upper trunk vs Inner canopy
Replotted from Table 1 (page 2) of the original paper. Every bar is the paper's own table value.
View source evidence ↗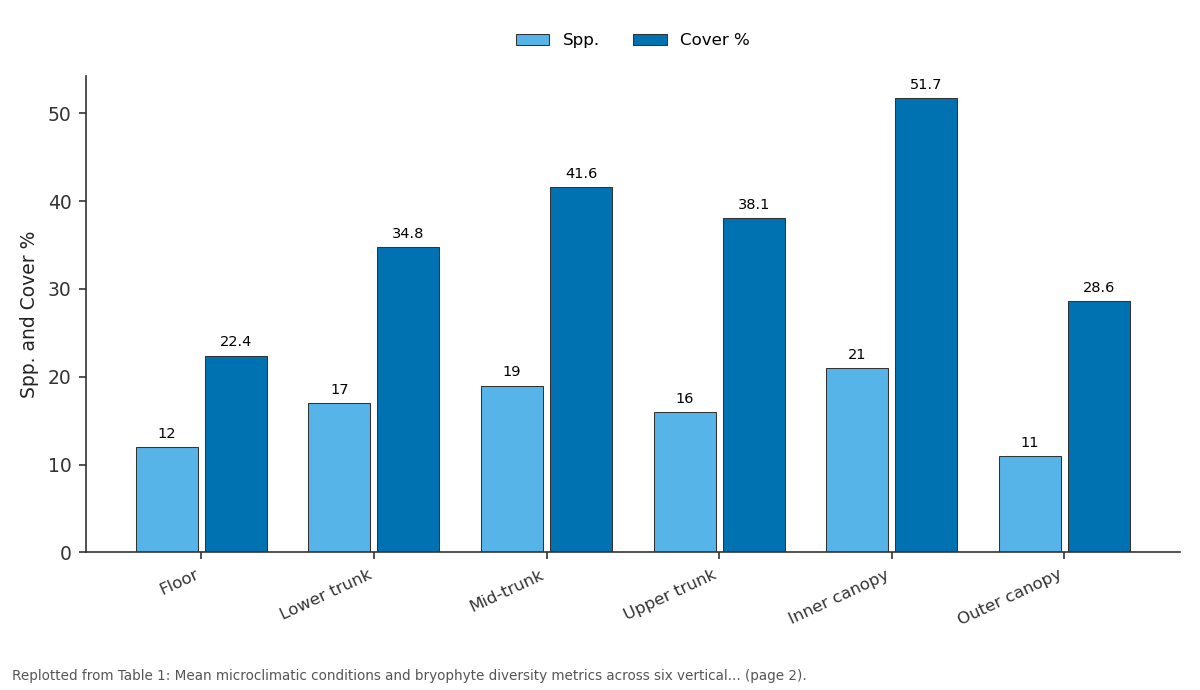
Spp. and Cover %: Floor vs Lower trunk vs Mid-trunk vs Upper trunk vs Inner canopy
Replotted from Table 1 (page 2) of the original paper. Every bar is the paper's own table value.
View source evidence ↗Figures & tables
From the original paper Table 1
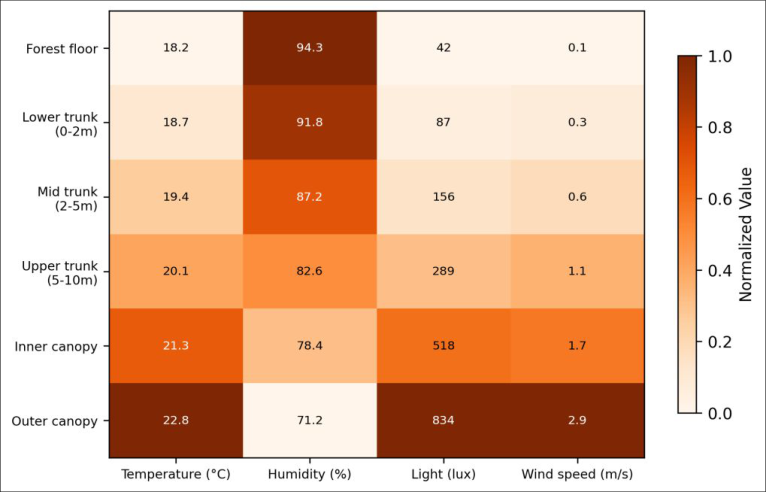 Figure 1
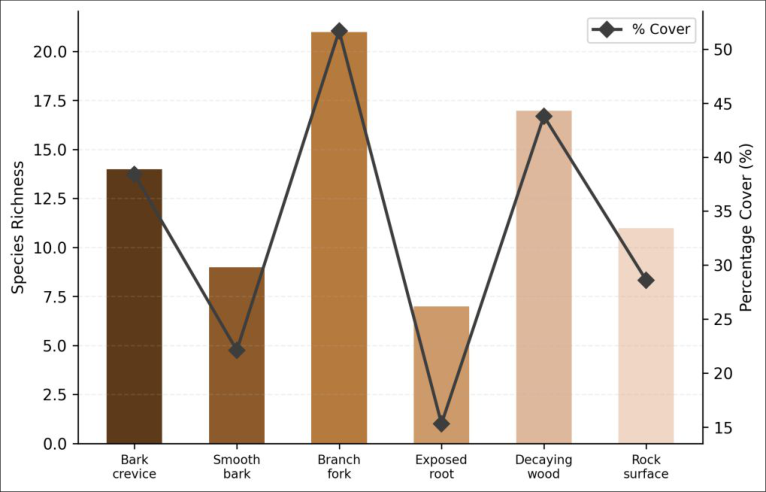 Figure 2
Introduction
Tropical and subtropical montane cloud forests are disappearing at an alarming rate, and with them, a disproportionate share of the world's bryophyte diversity. These forests occupy a narrow altitudinal band where orographic cloud interception maintains near-constant humidity, creating conditions that support dense epiphytic communities [1] . Yet within a single cloud forest tree, conditions are far from uniform. The forest floor sits in deep shade with saturated air, while the outer canopy experiences direct sunlight, wind exposure, and rapid drying cycles [2] . How these internal gradients influence which bryophyte species occur where is a question with direct conservation relevance, because microclimatic shifts driven by forest fragmentation and climate change could reorganize or eliminate sensitive assemblages [3] . Bryophytes are poikilohydric organisms: they equilibrate their water content with the surrounding atmosphere rather than regulating it internally [4] . This trait makes them outstanding bioindicators of atmospheric moisture conditions but also renders them vulnerable to even small changes in humidity and evaporative demand. Earlier research in Neotropical cloud forests found vertical zonation of epiphytic bryophytes correlated with light and moisture gradients, but most of those surveys relied on one-time microclimate snapshots rather than continuous monitoring [5] . The montane forests near Barcelona, though Mediterranean rather than tropical, share key features with classical cloud forests: frequent fog immersion during cooler months, steep topographic moisture gradients, and diverse epiphytic communities [6] . They offer a practical setting for studying microclimate-bryophyte relationships because they are accessible yearround and small enough to sample intensively. This research combined continuous microclimatic monitoring across six vertical strata with detailed bryophyte community surveys to answer three questions: a) How do key climatic variables change with height within the canopy, b) Which variables best explain bryophyte species composition, and c) Can indicator species for specific microclimatic niches be identified? The answers should help land managers anticipate which bryophyte communities are most at risk if fog frequency or forest structure changes [7] .
Study area description
The research was conducted in a 14-hectare fragment of montane cork oak and holm oak forest located in the Collserola Natural Park (41°25′N, 2°06′E), approximately 8 km northwest of central Barcelona, Spain. Elevation at the site ranges from 380 to 460 m above sea level. Mean annual temperature is 14.8°C, and mean annual precipitation is 612 mm, supplemented by an estimated 180-230 mm of fog interception during autumn and winter months [6] . The canopy is dominated by Quercus ilex and Quercus suber, with an understorey of Arbutus unedo and Phillyrea latifolia. The fragment is bordered by roads to the east and urban development to the south, resulting in increased edge exposure relative to intact forest.
Climatic and environmental conditions
During the research period (April 2023-February 2024), total precipitation at the nearest meteorological station was 587 mm, slightly below the long-term average. Fog events, defined as visibility below 1 km at canopy height, occurred on 94 days, concentrated between October and January. Mean monthly temperatures ranged from 7.3°C (January 2024) to 24.1°C (July 2023). The summer of 2023 included a 23-day dry spell in July-August during which no measurable precipitation or fog occurred, providing a natural desiccation stress event for bryophyte communities.
Material and Methods
Material and Methods
Material
Thirty host trees (15 Quercus ilex and 15 Quercus suber) with diameter at breast height between 28 and 52 cm were selected across the study area. Each tree was fitted with six HOBO MX2301A temperature and humidity dataloggers (Onset Computer Corporation, USA) mounted at: forest floor (0 m), lower trunk (1 m), mid-trunk (3 m), upper trunk (7 m), inner canopy (10 m), and outer canopy (13 m). Photosynthetically active radiation sensors (Apogee SQ-520) were deployed at four heights per tree. Wind speed was recorded at upper trunk and canopy levels using Davis 6410 anemometers. Dataloggers recorded at 15-minute intervals throughout the research period. Bryophyte surveys used 20 × 20 cm bark quadrats positioned at each stratum, with three replicate quadrats per height per tree (total = 540 quadrats). Species were identified in the laboratory at the Centro de Ciencias de la Vida de Cataluña using standard morphological keys and confirmed with light microscopy [8] .
Methods
Microclimatic data were summarized as means, minima, maxima, and coefficients of variation for each stratum over the full monitoring period. Bryophyte species cover was estimated visually to the nearest 5% on each quadrat. Species richness, Shannon diversity, and Pielou evenness were calculated per stratum. The relationship between microclimate and species composition was analyzed using Redundancy Analysis (RDA) in the R package vegan v2.6-4, with forward selection of environmental variables and permutation tests (999 permutations) for significance [9] . Indicator species analysis was performed using the indicspecies package v1.7.12, identifying species significantly associated with specific strata or stratum combinations (p<0.05, indicator value > 0.40). Nonmetric multidimensional scaling (NMDS) based on Bray-Curtis dissimilarity was used to visualize community patterns. All analyses were run in R v4.3.2 [10] .
Biodiversity assessment
Across all quadrats, 67 bryophyte species were recorded: 41 mosses, 23 liverworts, and 3 hornworts. The most speciesrich families were Orthotrichaceae (9 species), Lejeuneaceae (7 species), and Neckeraceae (5 species). Eight species were recorded at only a single stratum, while four species (Hypnum cupressiforme, Frullania dilatata, Tortula muralis, and Orthotrichum affine) occurred across all six strata. The overall Shannon diversity index for the site was 3.14, and Pielou evenness was 0.74, indicating a moderately even community with no single dominant species. Redundancy analysis retained three significant environmental variables: relative humidity (explaining 34.2% of constrained variation, p=0.001), PAR (18.7%, p=0.002), and temperature (11.4%, p=0.008). Wind speed was dropped during forward selection (p=0.14). The first two RDA axes captured 52.9% of total species variation. NMDS ordination separated lower-stratum assemblages dominated by shade-tolerant pleurocarpous mosses from upper-stratum assemblages with acrocarpous and cushionforming species.
Results
Results
Discussion
The 23-percentage-point humidity gradient measured between forest floor and outer canopy underscores how different the environment can be at opposite ends of the same tree. For poikilohydric organisms like bryophytes, this gradient translates directly into differences in desiccation frequency and duration, which in turn filter species according to their tolerance [4] . The strong explanatory power of relative humidity in the RDA (34.2%) confirms what has been observed in Neotropical cloud forests but extends it to a Mediterranean montane context where fog frequency is lower and summer drought adds an extra stress dimension [5] .
International Journal of Biology Sciences https://www.biologyjournal.net
The peak in species richness at the inner canopy rather than the forest floor was unexpected but may reflect the convergence of adequate moisture from fog interception with moderate light levels that allow a wider range of photosynthetic strategies. Branch forks trap organic debris and funnel stemflow, creating moist microsites even when ambient humidity is lower than at the base of the tree [11] . The outer canopy's low richness but high proportion of xerotolerant specialists parallels patterns described for tropical epiphytes at exposed sites, where harsh conditions exclude generalists and favor a small number of adapted taxa [12] . The 23-day summer dry spell in 2023 caused visible browning of bryophyte mats on the outer canopy and upper trunk, and post-drought quadrat surveys showed a 14% decline in cover at those strata. Lower strata were buffered by the canopy overhead and showed less than 3% cover change. If dry spells become longer under projected climate scenarios, the outer-canopy specialists most vulnerable to desiccation may face local extinction even without forest clearing [13] .
Conclusion
This research demonstrated that microclimatic gradients within a single cloud forest tree are steep enough to generate distinct bryophyte assemblages at different heights. Relative humidity was the strongest predictor of species composition, followed by light availability. Inner-canopy branch forks harbored the highest diversity and cover, while the outer canopy supported a specialized but vulnerable xerotolerant community. These results suggest that conservation efforts in montane forests should consider not only forest extent but also the structural complexity that maintains internal microclimatic heterogeneity, because loss of canopy layers through selective logging or fragmentation could eliminate the buffered conditions on which many bryophyte species depend.
Figures and tables from the paper
| Stratum | T (°C) | RH (%) | PAR | Wind | Spp. | H′ | Cover % |
|---|---|---|---|---|---|---|---|
| Floor | 18.2 | 94.3 | 42 | 0.1 | 12 | 1.87 | 22.4 |
| Lower trunk | 18.7 | 91.8 | 87 | 0.3 | 17 | 2.31 | 34.8 |
| Mid-trunk | 19.4 | 87.2 | 156 | 0.6 | 19 | 2.48 | 41.6 |
| Upper trunk | 20.1 | 82.6 | 289 | 1.1 | 16 | 2.27 | 38.1 |
| Inner canopy | 21.3 | 78.4 | 518 | 1.7 | 21 | 2.58 | 51.7 |
| Outer canopy | 22.8 | 71.2 | 834 | 2.9 | 11 | 1.94 | 28.6 |
Table text extracted from the original PDF; superscript letters are shown inline. The original table image is below.
View original table image
References
17 in the original paper- Bruijnzeel LA, Kappelle M, Mulligan M, Scatena FN. Tropical montane cloud forests: state of knowledge and sustainability perspectives in a changing world. Ecological Studies. 2010;215:691-740.
- Zotz G, Bader MY. Epiphytic plants in a changing world: global change effects on vascular and nonvascular epiphytes. Progress in Botany. 2009;70:147170.
- Foster P. The potential negative impacts of global climate change on tropical montane cloud forests. Earth-Science Reviews. 2001;55(1-2):73-106.
- Proctor MCF, Oliver MJ, Wood AJ, Alpert P, Stark LR. Desiccation-tolerance in bryophytes: a review. The Bryologist. 2007;110(4):595-621.
- Wolf JHD. Diversity patterns and biomass of epiphytic bryophytes and lichens along an altitudinal gradient in the northern Andes. Annals of the Missouri Botanical Garden. 1993;80(4):928-960.
- Terradas J, Penuelas J. Water relations, gas exchange, growth and production of the Mediterranean maquis at Capcanes. Oecologia. 2003;137(1):51-57.
- Gignac LD. Bryophytes as indicators of climate change. The Bryologist. 2001;104(3):410-420.
- Smith AJE. The Moss Flora of Britain and Ireland. 2 nd edition. Cambridge: Cambridge University Press; 2004.
- Oksanen J, Blanchet FG, Kindt R, Legendre P, Minchin PR. vegan: community ecology package. R package version 2.6-4. CRAN Repository; 2022.
- R Core Team. R: a language and environment for statistical computing. Vienna: R Foundation for Statistical Computing; 2023.
- Pypker TG, Unsworth MH, Bond BJ. The role of epiphytes in rainfall interception by forests in the Pacific Northwest. Canadian Journal of Forest Research. 2006;36(4):813-824.
- Gradstein SR, Nadkarni NM, Kromer T, Cerni I, Santos MV. Diversity and habitat differentiation of mosses and liverworts in the cloud forest of Monteverde, Costa Rica. Caldasia. 2003;25(2):351-359.
- Nadkarni NM, Solano R. Potential effects of climate change on canopy communities in a tropical cloud forest: an experimental approach. Oecologia. 2002;131(4):580-586.
- Frahm JP, Gradstein SR. An altitudinal zonation of tropical rain forests using bryophytes. Journal of Biogeography. 1991;18(6):669-678.
- Leon-Vargas Y, Engwald S, Proctor MCF. Microclimate, light adaptation and desiccation tolerance of epiphytic bryophytes in two Venezuelan cloud forests. Journal of Biogeography. 2006;33(5):901-913.
- Bates JW. Is life-form a useful concept in bryophyte ecology? Oikos. 1998;82(2):223-237.
- Cornelissen JHC, ter Steege H. Distribution and ecology of epiphytic bryophytes and lichens in dry evergreen forest of Guyana. Journal of Tropical Ecology. 1989;5(2):131-150.