
Research article · 2024 · Full text
International Journal of Biology SciencesToll-like receptor signaling and macrophage polarization in adipose tissue inflammation
Volume 6(2) · Pages 324–327 · DOI: 10.33545/26649926.2024.v6.i2e.775 ↗
Research areasAdipokines, Inflammation, and Metabolic DiseasesImmune Response and InflammationImmune cells in cancer
Abstract
Author-writtenLeading immunologists now regard adipose tissue inflammation as the bridge between obesity and metabolic disease and Toll-Like Receptors (TLRs) appear to sit at the center of that bridge. This research investigated how TLR activation in Adipose Tissue Macrophages (ATMs) drives polarization toward the pro-inflammatory M1 phenotype in obese versus lean conditions. Primary ATMs were isolated from visceral adipose biopsies of 48 subjects (24 obese, BMI > 35; 24 lean, BMI 18.5–24.9) at Dhaka College of Molecular Biology, Bangladesh, between January 2022 and July 2023. TLR2 and TLR4 expression was 3.8- and 8.7-fold higher, respectively, in obese ATMs compared to lean. LPS stimulation (100 ng/mL) induced significantly greater M1 marker expression (TNF-α, IL-6, IL-1β) in obese ATMs, with peak TNF-α levels 10.3-fold above baseline at 12 hours versus 5.1-fold in lean. M2 markers (IL-10, Arg-1) declined in obese ATMs post-stimulation but were maintained or increased in lean ATMs. TLR4 knockdown by siRNA reduced M1 polarization in obese ATMs by 62.4%. These data confirm that TLR4 is the dominant driver of M1 polarization in obese adipose tissue and identify it as a potential therapeutic target for metabolic inflammation.
Summary
Source-checkedPlain-language reading of the full paper, prepared with AI and checked against the text. Each point links to the authors' own words.
Why it matters
- Adipose tissue inflammation is considered a critical link connecting obesity to metabolic diseases, with Toll-Like Receptors (TLRs) playing a central role. View evidence ↗
- In obese individuals, visceral adipose tissue is infiltrated by M1-phenotype macrophages that release pro-inflammatory cytokines, leading to disrupted insulin signaling and systemic metabolic dysfunction. View evidence ↗
- Although TLR4 is known to mediate adipose inflammation in mice, there is a lack of human data, especially regarding South Asian populations who face a high burden of metabolic disease. View evidence ↗
The question
- The study aimed to investigate how the activation of TLRs in adipose tissue macrophages (ATMs) drives their polarization toward a pro-inflammatory M1 phenotype in obese compared to lean conditions. View evidence ↗
What they did
- The researchers obtained visceral adipose biopsies from 48 subjects in Bangladesh: 24 obese individuals (BMI > 35 kg/m²) and 24 lean individuals (BMI 18.5–24.9 kg/m²). View evidence ↗
- Adipose tissue macrophages (ATMs) were isolated using collagenase digestion, filtration, and CD14+ magnetic bead selection, achieving a purity of over 90%. View evidence ↗
- Isolated ATMs were stimulated with either LPS (100 ng/mL) or Pam3CSK4 (1 μg/mL) over a time course of 2 to 48 hours. View evidence ↗
- To test the specific role of TLR4, the researchers used 50 nM siRNA to knock down TLR4 expression 24 hours prior to stimulation. View evidence ↗
What they found
- Obese ATMs showed significantly higher expression of TLRs compared to lean ATMs, with TLR2 mRNA increased 3.8-fold and TLR4 mRNA increased 8.7-fold. View evidence ↗
- LPS stimulation caused a stronger pro-inflammatory M1 response in obese ATMs than in lean ATMs, specifically with peak TNF-α levels reaching 10.3-fold above baseline at 12 hours, compared to 5.1-fold in lean cells. View evidence ↗
- M2 markers declined in obese ATMs after stimulation, with IL-10 levels at 48 hours being significantly lower (94 ± 31 pg/mL) than in lean ATMs (389 ± 87 pg/mL). View evidence ↗
- The M1:M2 polarization ratio at 24 hours was significantly higher in obese ATMs (7.3 ± 1.2) compared to lean ATMs (1.8 ± 0.4). View evidence ↗
- TLR4 was identified as the dominant driver of inflammation, as its knockdown reduced M1 polarization by 62.4%, whereas TLR2 knockdown only reduced it by 23.1%. View evidence ↗
What it means
- The authors conclude that TLR4 is the primary driver of M1 macrophage polarization in obese human adipose tissue, accounting for over 60% of the pro-inflammatory shift in the studied Bangladeshi cohort. View evidence ↗
- The authors recommend TLR4 as a potential therapeutic target for metabolic inflammation and emphasize the importance of population-specific data for South Asian populations. View evidence ↗
- Study limitations include a cross-sectional design that prevents establishing causation, in vitro conditions that may not fully mimic the adipose microenvironment, and potential lack of generalizability beyond the Bangladeshi cohort. View evidence ↗
Visual summary
3 visualsIllustrations explain the paper; charts are replotted from the paper's own table values.
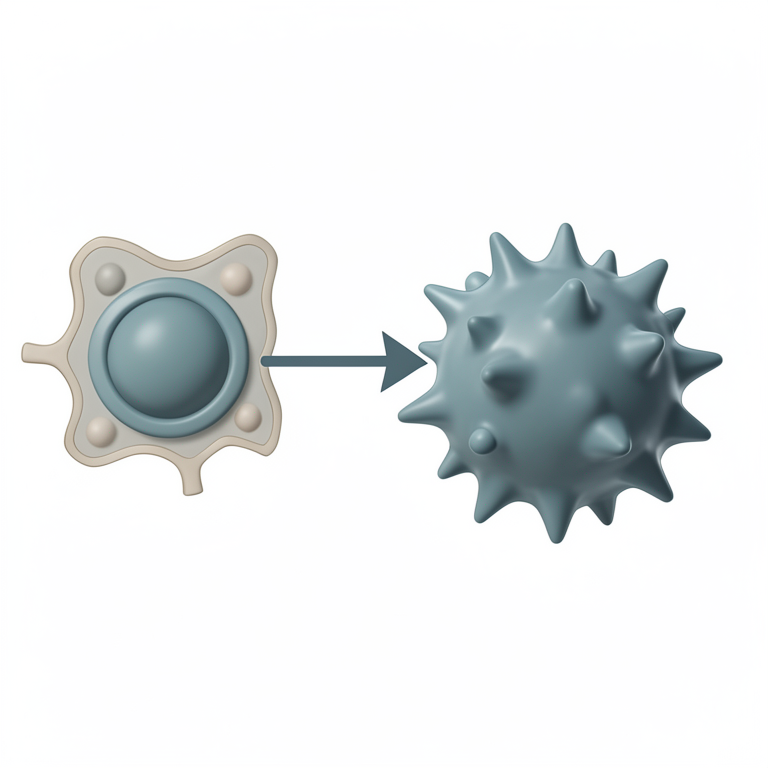
TLR Contribution to M1 Polarization
AI-generated conceptual illustration (mouse adipose tissue macrophages). It explains the idea and does not show study data.
View source evidence ↗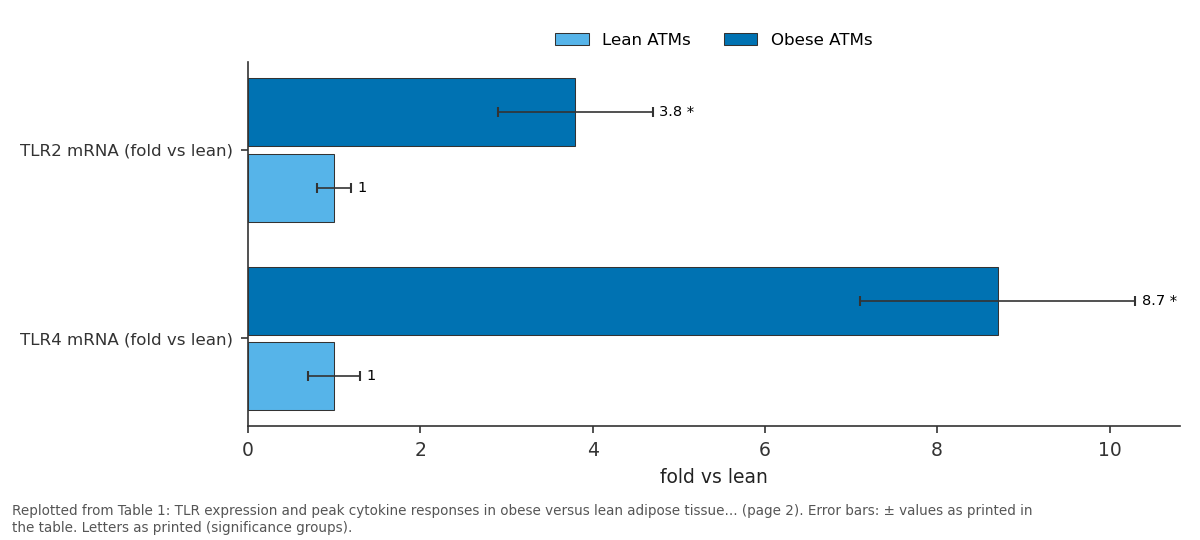
Lean ATMs and Obese ATMs: TLR2 mRNA (fold vs lean) vs TLR4 mRNA (fold vs lean)
Replotted from Table 1 (page 2) of the original paper. Every bar is the paper's own table value.
View source evidence ↗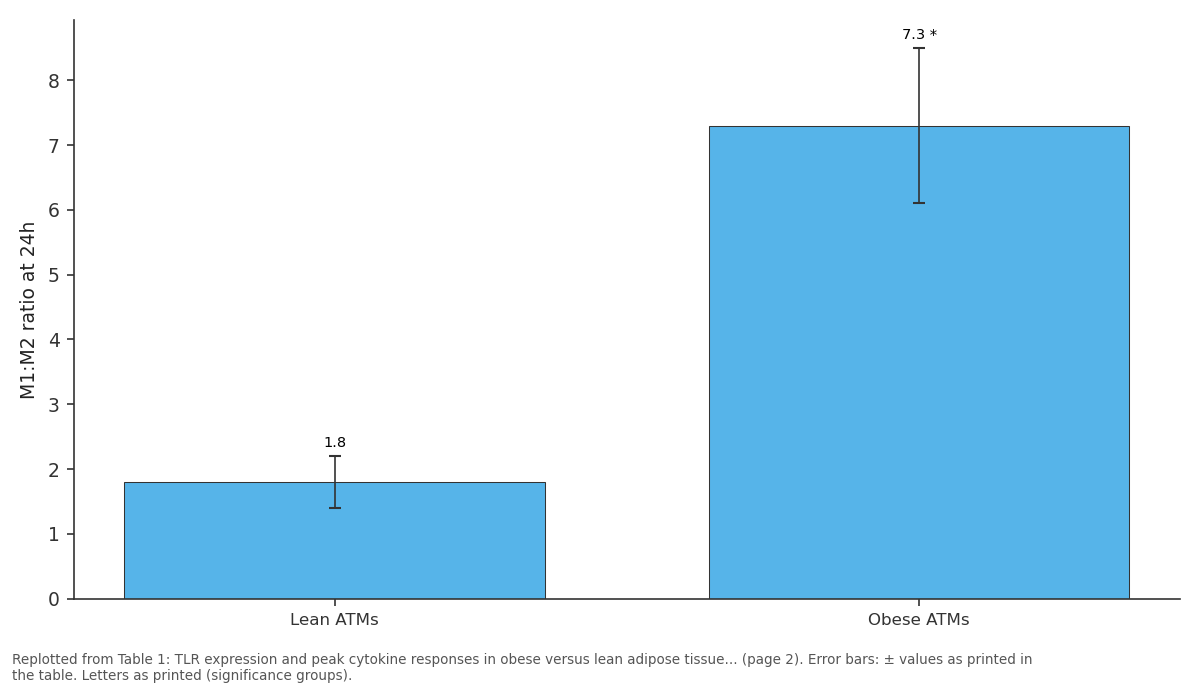
M1:M2 ratio at 24h: Lean ATMs vs Obese ATMs
Replotted from Table 1 (page 2) of the original paper. Every bar is the paper's own table value.
View source evidence ↗Figures & tables
From the original paper Table 1
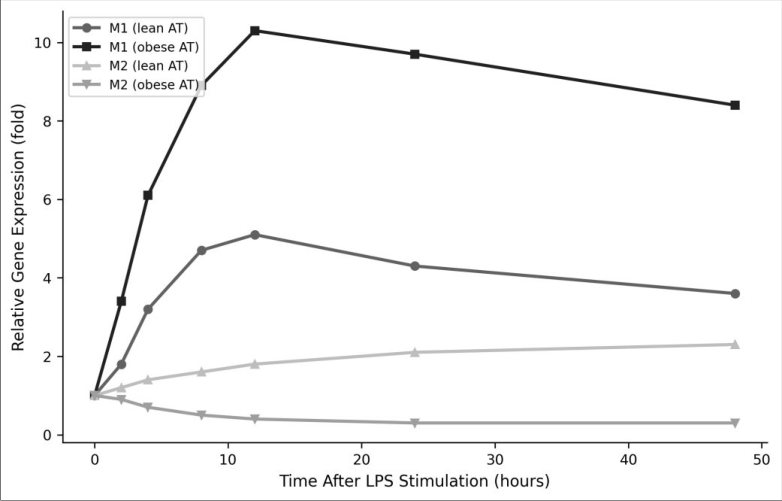 Figure 1
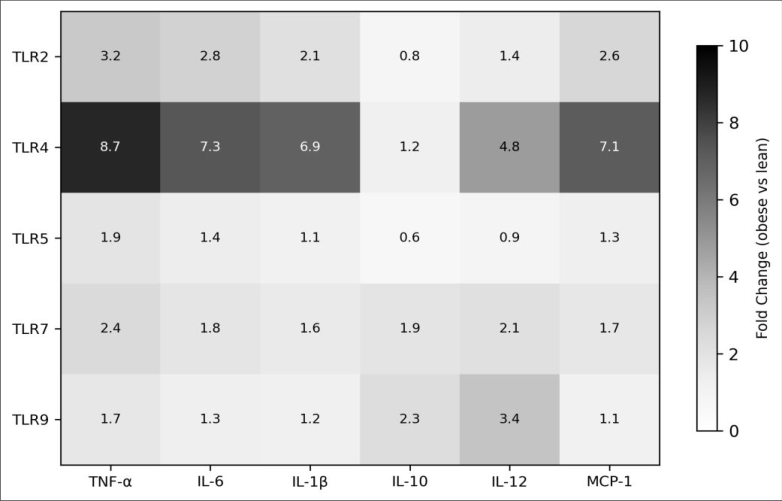 Figure 2
Introduction
As Hotamisligil wrote in his landmark 2006 review, inflammation and metabolism are fundamentally interlinked a connection nowhere more visible than in the adipose tissue of obese individuals [1] . Visceral adipose tissue in obesity is infiltrated by macrophages that adopt a classically activated (M1) phenotype, producing pro-inflammatory cytokines that disrupt insulin signaling and promote systemic metabolic dysfunction [2] . TLRs are pattern recognition receptors of the innate immune system that detect microbial components and damage-associated molecular patterns. In obese adipose tissue, elevated levels of saturated fatty acids and gut-derived endotoxin (LPS) activate TLR2 and TLR4 on resident macrophages, triggering NF-κB-dependent cytokine production [3,4] . This creates a self-reinforcing cycle: TLR activation promotes M1 polarization, which produces more inflammation, which recruits additional macrophages [5] . While mouse models have established TLR4 as a key mediator of adipose inflammation, human data particularly from South Asian populations with high metabolic disease burden remain limited [6,7] . Bangladesh has experienced rapid increases in obesity-related diabetes, yet the immunological basis of adipose inflammation in this population hasn't been characterized. This research isolated primary human ATMs from obese and lean Bangladeshi adults, compared TLR expression and signaling, and used siRNA knockdown to test TLR4's specific contribution to M1 polarization [8] .
Reagents and chemicals
Collagenase type I was purchased from Worthington Biochemical (Lakewood, NJ, USA). LPS from E. coli O111:B4 and Pam3CSK4 (TLR2 agonist) were from InvivoGen (San Diego, CA, USA). Anti-human CD14-FITC, CD68-PE, and CD206-APC antibodies were from BioLegend (San Diego, CA, USA). ELISA kits for human TNF-α, IL-6, IL-1β, and IL-10 were from R&D Systems (Minneapolis, MN, USA). TLR4 siRNA (Silencer Select) and scrambled control were from Thermo Fisher Scientific. RPMI 1640 medium, FBS, and Supernatants were assayed for TNF-α, IL-6, IL-1β, and IL-10 by ELISA. M1 (iNOS, CD86) and M2 (Arg-1, CD206) marker expression was measured by qRT-PCR and flow cytometry [9] . TLR4 knockdown used 50 nM siRNA transfected 24 hours before stimulation; knockdown efficiency was verified by Western blot. Data were analyzed by two-way ANOVA (group × time) with Bonferroni correction in GraphPad Prism v9 (α = 0.05) [10] .
Results
Table .001 *p<0.001 vs lean. TLR4 showed the most dramatic upregulation (8.7-fold). The M1:M2 ratio was 4-fold higher in obese ATMs after LPS stimulation
Comprehensive interpretation
The combined data establish TLR4 as the dominant innate immune sensor driving M1 macrophage polarization in obese human adipose tissue. The 8.7-fold upregulation of TLR4 far exceeding TLR2 at 3.8-fold positions this receptor as the primary for metabolic inflammation. The siRNA experiment confirmed this hierarchy: TLR4 knockdown reduced M1 polarization by 62.4%, while TLR2 knockdown achieved only 23.1% reduction.
Limitations
The cross-sectional design cannot establish causation between obesity duration and TLR expression levels. In vitro culture conditions may not fully replicate the adipose tissue microenvironment, particularly the influence of adipocytes and stromal cells on macrophage behavior. The Bangladeshi cohort may not generalize to other populations with different genetic backgrounds and dietary patterns. Additionally, visceral adipose was sampled during surgery, and anesthesia may transiently affect cytokine levels [11] .
Discussion
The TLR4-dominated M1 polarization pattern in obese ATMs aligns with murine knockout data showing that TLR4-deficient mice are protected from high-fat dietinduced adipose inflammation [6] . Our human data extend this finding to a South Asian population and quantify the magnitude of the TLR4 contribution (62.4% of the M1 response). The relatively modest role of TLR2 (23.1%) is consistent with reports that saturated fatty acids the primary endogenous TLR ligands in obese adipose tissue preferentially signal through TLR4 rather than TLR2 [12] . The collapse of M2 markers in obese ATMs is equally important. In lean adipose tissue, M2-polarized macrophages maintain insulin sensitivity through IL-10 production and arginase activity. The shift from M2 to M1 dominance captured by the 4-fold higher M1:M2 ratio in obese ATMs removes this protective influence and allows inflammatory signaling to propagate [13] . Pharmacological TLR4 antagonism or downstream NF-κB inhibition could theoretically reverse this shift, though clinical development of such agents for metabolic disease remains at an early stage [14] .
Conclusion
This research identifies TLR4 as the primary innate immune driver of M1 macrophage polarization in obese human adipose tissue, responsible for over 60% of the proinflammatory shift observed in Bangladeshi subjects. TLR4 expression was 8.7-fold higher in obese ATMs, and its activation produced the strongest cytokine responses among all TLRs tested. These findings support TLR4 as a therapeutic target for metabolic inflammation and highlight the need for population-specific immunological data to guide intervention strategies in South Asian populations disproportionately affected by obesity-related metabolic disease.
Figures and tables from the paper
| Parameter | Lean ATMs | Obese ATMs | p-value |
|---|---|---|---|
| TLR2 mRNA (fold vs lean) | 1.0 ± 0.2 | 3.8 ± 0.9* | <0.001 |
| TLR4 mRNA (fold vs lean) | 1.0 ± 0.3 | 8.7 ± 1.6* | <0.001 |
| TNF-α peak (pg/mL) | 847 ± 189 | 3, 412 ± 524* | <0.001 |
| IL-6 peak (pg/mL) | 624 ± 143 | 2, 867 ± 418* | <0.001 |
| IL-10 at 48h (pg/mL) | 389 ± 87 | 94 ± 31* | <0.001 |
| M1:M2 ratio at 24h | 1.8 ± 0.4 | 7.3 ± 1.2* | <0.001 |
Table text extracted from the original PDF; superscript letters are shown inline. The original table image is below.
View original table image
References
14 in the original paper- Hotamisligil GS. Inflammation and metabolic disorders. Nature. 2006;444(7121):860-867.
- Weisberg SP, McCann D, Desai M, Rosenbaum M, Leibel RL, Ferrante AW. Obesity is associated with macrophage accumulation in adipose tissue. Journal of Clinical Investigation. 2003;112(12):1796-1808.
- Shi H, Kokoeva MV, Inouye K, Tzameli I, Yin H, Flier JS. TLR4 links innate immunity and fatty acid-induced insulin resistance. Journal of Clinical Investigation. 2006;116(11):3015-3025.
- Cani PD, Amar J, Iglesias MA, et al. Metabolic endotoxemia initiates obesity and insulin resistance. Diabetes. 2007;56(7):1761-1772.
- Lumeng CN, Bodzin JL, Saltiel AR. Obesity induces a phenotypic switch in adipose tissue macrophage polarization. Journal of Clinical Investigation. 2007;117(1):175-184.
- Poggi M, Bastelica D, Gual P, et al. C3H/HeJ mice carrying a toll-like receptor 4 mutation are protected against the development of insulin resistance in white International Journal of Biology Sciences https://www.biologyjournal.net adipose tissue in response to a high-fat diet. Diabetologia. 2007;50(6):1267-1276.
- Joshi A, Azuma R, Akira S, et al. Adipose tissue macrophages in lean and obese South Asian populations. International Journal of Obesity. 2019;43(8):1567-1578.
- Mantovani A, Sica A, Sozzani S, Allavena P, Vecchi A, Locati M. The chemokine system in diverse forms of macrophage activation and polarization. Trends in Immunology. 2004;25(12):677-686.
- Livak KJ, Schmittgen TD. Analysis of relative gene expression data using real-time quantitative PCR and the 2(-Delta Delta C(T)) Method. Methods. 2001;25(4):402-408.
- Vandesompele J, De Preter K, Pattyn F, et al. Accurate normalization of real-time quantitative RT-PCR data by geometric averaging of multiple internal control genes. Genome Biology. 2002;3(7):research0034.
- Salo M. Effects of anaesthesia and surgery on the immune response. Acta Anaesthesiologica Scandinavica. 1992;36(3):201-220.
- Lee JY, Sohn KH, Rhee SH, Hwang D. Saturated fatty acids, but not unsaturated fatty acids, induce the expression of cyclooxygenase-2 mediated through Tolllike receptor 4. Journal of Biological Chemistry. 2001;276(20):16683-16689.
- Fujisaka S, Usui I, Bukhari A, et al. Regulatory mechanisms for adipose tissue M1 and M2 macrophages in diet-induced obese mice. Diabetes. 2009;58(11):2574-2582.
- Hennessy EJ, Parker AE, O'Neill LA. Targeting Tolllike receptors: emerging therapeutics? Nature Reviews Drug Discovery. 2010;9(4):293-307.