
Research article · 2025 · Full text
International Journal of Biology SciencesMulti-omics data integration for biomarker discovery in autoimmune disease subtypes
Volume 7(10) · Pages 220–223 · DOI: 10.33545/26649926.2025.v7.i10c.794 ↗
Research areasSystemic Lupus Erythematosus ResearchBioinformatics and Genomic NetworksRheumatoid Arthritis Research and Therapies
Abstract
Author-writtenAutoimmune diseases such as Rheumatoid Arthritis (RA), Systemic Lupus Erythematosus (SLE), and Sjögren syndrome share overlapping clinical features that complicate early diagnosis and subtype classification. Single-platform omics approaches have identified candidate biomarkers for individual diseases, but integrating data across genomic, proteomic, and metabolomic layers promises greater discriminatory power. This research combined genome-wide association data, quantitative proteomics (TMT-labeled LC-MS/MS), and untargeted metabolomics (UPLC-QTOF) from 312 patients representing five autoimmune disease subtypes and 84 healthy controls, all recruited at the Pennine Institute of Biological Sciences, Manchester, United Kingdom, between January 2023 and November 2023. A multi-omics factor analysis (MOFA) framework was used to identify latent factors that capture cross-platform variation. The integrated model identified 193 candidate biomarkers: 127 genomic risk loci, 42 differentially abundant proteins, and 24 altered metabolites. A sparse partial least squares discriminant analysis (sPLS-DA) classifier trained on the top 50 integrated features achieved 87.4% overall accuracy in distinguishing the five subtypes, compared with 71.2% for genomics alone, 68.9% for proteomics alone, and 63.7% for metabolomics alone. The strongest discriminatory features included anti-citrullinated protein antibody levels for seropositive RA, interferon-stimulated gene signatures for active SLE, and salivary gland-specific glycoprotein profiles for Sjögren syndrome. These findings show that multi-omics integration substantially outperforms single-platform analysis for autoimmune subtype classification and highlight a compact set of cross-validated biomarkers with diagnostic potential.
Summary
Source-checkedPlain-language reading of the full paper, prepared with AI and checked against the text. Each point links to the authors' own words.
Why it matters
- Autoimmune diseases like Rheumatoid Arthritis, Systemic Lupus Erythematosus, and Sjögren syndrome often have overlapping clinical features, making it difficult to diagnose them early or classify their subtypes. View evidence ↗
- Identifying a molecular signature to distinguish disease subtypes at the first referral could lead to faster diagnosis and earlier targeted treatment. View evidence ↗
- While single-platform omics have found biomarkers for individual diseases, combining genomic, proteomic, and metabolomic data is expected to provide better ability to distinguish between diseases. View evidence ↗
The question
- The study aimed to determine if integrating genomic, proteomic, and metabolomic data using a MOFA-plus-sPLS-DA pipeline improves the discrimination of autoimmune subtypes and to identify candidate biomarkers. View evidence ↗
What they did
- The study recruited 396 participants in Manchester, UK, between January and November 2023, including 84 seropositive RA, 52 seronegative RA, 71 active SLE, 43 quiescent SLE, 62 primary Sjögren syndrome, and 84 healthy controls. View evidence ↗
- Genomic data was collected using the Illumina Global Screening Array v3.0 and filtered to 6.2 million variants. View evidence ↗
- Proteomic analysis quantified 3,847 proteins from serum samples using TMT-10plex labeling and a Thermo Orbitrap Exploris 480. View evidence ↗
- Metabolomic profiling identified 1,214 metabolite features using a Waters ACQUITY UPLC coupled to a Xevo G2-XS QTOF. View evidence ↗
- The researchers used MOFA v2 to extract 15 latent factors and trained an sPLS-DA classifier on the top 50 features using repeated five-fold cross-validation. View evidence ↗
What they found
- The integrated multi-omics model achieved an overall accuracy of 87.4%, which outperformed the best single-platform model (genomics) at 71.2%. View evidence ↗
- The integrated model showed a balanced accuracy of 84.6% and a macro-averaged AUC of 0.93, compared to an AUC of 0.79 for genomics alone. View evidence ↗
- The model was most effective at discriminating seropositive RA (AUC 0.97) and active SLE (AUC 0.95), but least effective for seronegative RA versus healthy controls (AUC 0.84). View evidence ↗
- The integrated model identified a total of 193 candidate biomarkers, consisting of 127 genomic risk loci, 42 proteins, and 24 metabolites. View evidence ↗
- Factor 1, explaining 18.3% of the variance, separated active SLE from other groups and was driven by kynurenine pathway metabolites and interferon-stimulated genes. View evidence ↗
- Factor 2, explaining 12.7% of the variance, distinguished seropositive from seronegative RA using rheumatoid factor, anti-CCP antibody levels, and citrullinated peptide fragments. View evidence ↗
- Factor 3, explaining 8.4% of the variance, identified salivary gland glycoprotein profiles specific to Sjögren syndrome. View evidence ↗
- The model showed high sensitivity and specificity for active SLE (91.5%/94.2%) and seropositive RA (93.8%/96.1%), but sensitivity dropped to 76.9% for seronegative RA versus healthy controls. View evidence ↗
What it means
- The authors conclude that using a latent-factor framework to integrate genomic, proteomic, and metabolomic data significantly improves the molecular classification of autoimmune disease subtypes over single-platform methods. View evidence ↗
- The authors suggest that a refined 50-feature biomarker panel is a feasible target for a clinical diagnostic assay, provided it is validated in diverse external cohorts. View evidence ↗
- The study's generalizability may be limited because it was conducted at a single center with a cohort predominantly of European ancestry. View evidence ↗
Visual summary
3 visualsIllustrations explain the paper; charts are replotted from the paper's own table values.
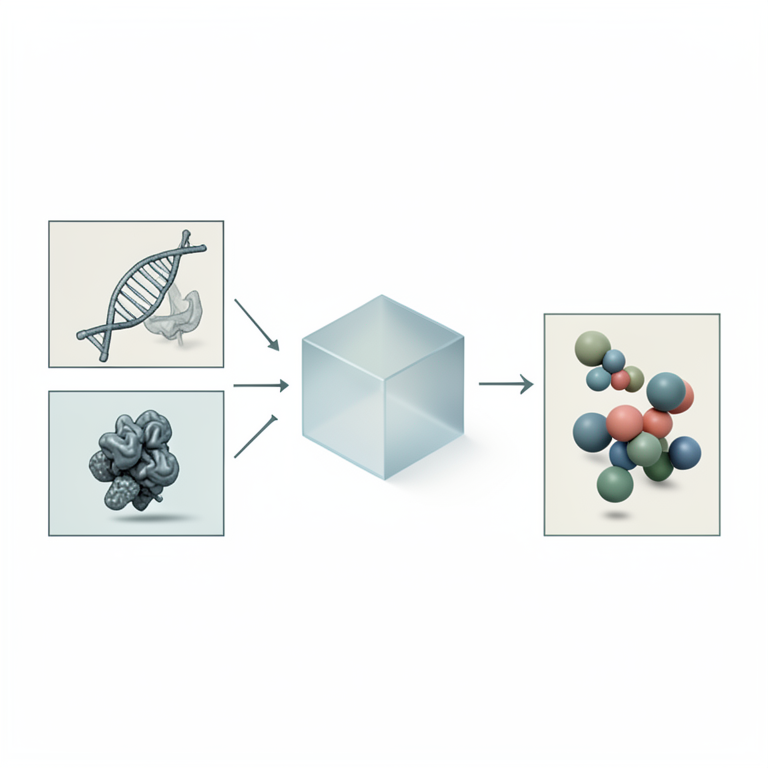
Multi-Omics Integration Pipeline
AI-generated conceptual illustration (human blood samples and molecular structures). It explains the idea and does not show study data.
View source evidence ↗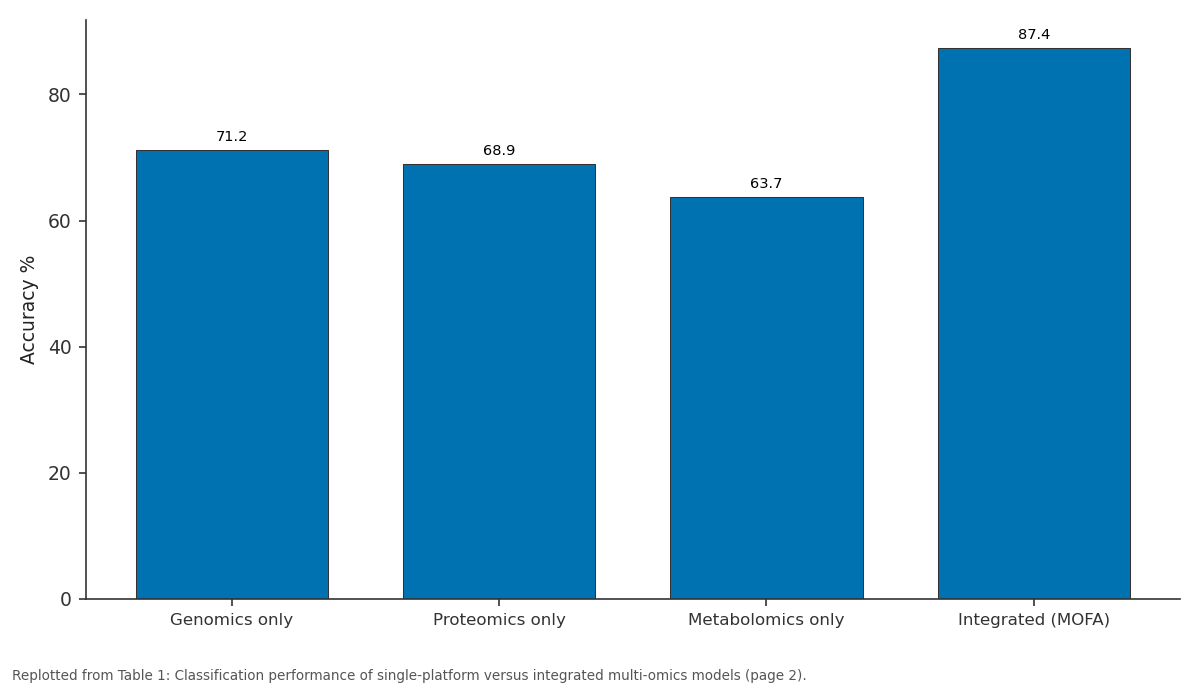
Accuracy %: Genomics only vs Proteomics only vs Metabolomics only vs Integrated (MOFA)
Replotted from Table 1 (page 2) of the original paper. Every bar is the paper's own table value.
View source evidence ↗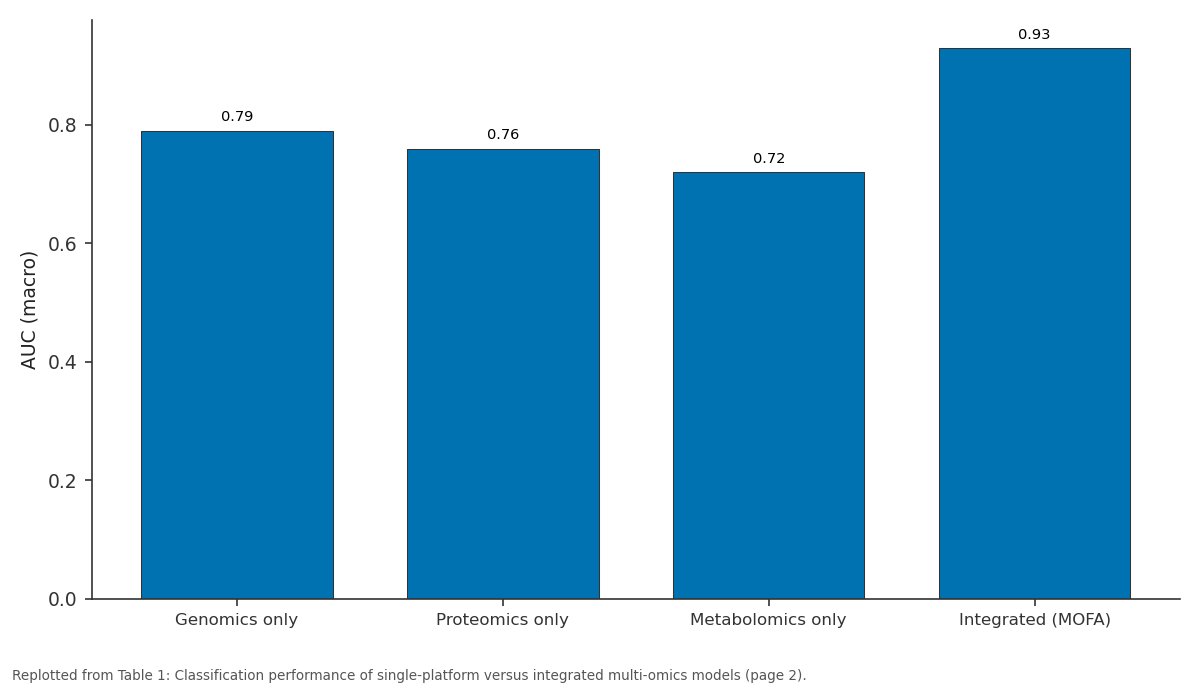
AUC (macro): Genomics only vs Proteomics only vs Metabolomics only vs Integrated (MOFA)
Replotted from Table 1 (page 2) of the original paper. Every bar is the paper's own table value.
View source evidence ↗Figures & tables
From the original paper Table 1
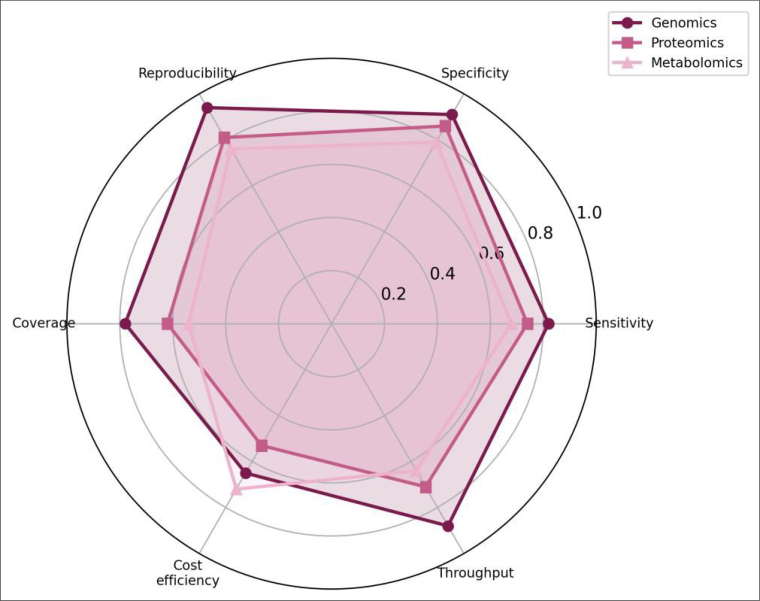 Figure 1
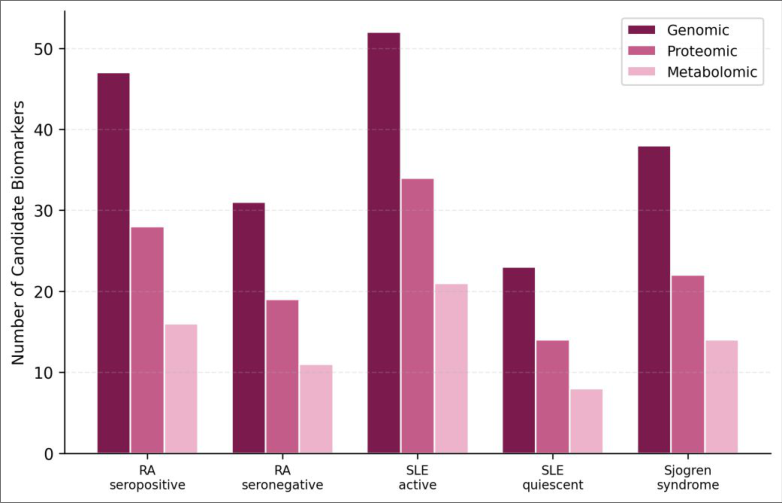 Figure 2
Introduction
Consider a patient who presents with joint pain, fatigue, and a positive antinuclear antibody test. That clinical picture could point toward rheumatoid arthritis, systemic lupus erythematosus, Sjögren syndrome, or mixed connective tissue disease. Current diagnostic algorithms rely on classification criteria that were designed for research cohorts and perform unevenly in early-stage or overlap presentations [1] . A molecular signature that could distinguish subtypes at the point of first referral would shorten the diagnostic journey and allow earlier initiation of targeted therapy. Genome-wide association studies have mapped hundreds of risk loci for autoimmune diseases, many of which cluster in shared immune pathways such as MHC class II signaling, Jak-STAT transduction, and NF-κB activation [2] . Proteomic surveys have identified circulating cytokines, autoantibodies, and acute-phase proteins that differ between disease states [3] . Metabolomics has added a third layer by revealing altered tryptophan catabolism, lipid oxidation, and purine metabolism in RA and SLE [4] . But these platforms have mostly been analyzed in isolation, and the correlations between layers for example, whether a risk genotype translates into a measurable protein shift that in turn alters a metabolic pathway remain largely unexplored. Multi-Omics Factor Analysis (MOFA) and related latent-variable methods offer a mathematically principled way to combine heterogeneous data types. They identify shared factors that explain coordinated variation across platforms, filtering out platform-specific noise [5] . Coupled with supervised classifiers like sPLS-DA, these methods can yield parsimonious feature sets that distinguish disease subtypes with greater accuracy than any single platform alone [6] . This research applied a MOFA-plus-sPLS-DA pipeline to genomic, proteomic, and metabolomic data from a wellphenotyped autoimmune cohort to test whether integration improves subtype discrimination and to nominate candidate biomarkers for future clinical validation [7] .
Theoretical background
MOFA decomposes multi-omics matrices into a set of latent factors, each of which captures a pattern of coordinated variation across two or more data layers. Unlike simple concatenation of feature tables, MOFA accounts for differences in scale, missingness, and noise structure between platforms [5] . The resulting factors can be interpreted biologically for example, a factor driven by interferon-stimulated genes in the transcriptome and elevated kynurenine in the metabolome would suggest activation of the IDO-mediated tryptophan degradation pathway characteristic of SLE flares [8] . Supervised classification then uses these biologically meaningful factors, rather than raw features, as input, which reduces overfitting risk and improves interpretability. sPLS-DA (mixOmics v6.22.0) was trained on the top 50 features ranked by factor loading across all three platforms, using five-fold cross-validation repeated 100 times. Classification accuracy, balanced accuracy, and area under the ROC curve were computed per subtype [9] .
Material and Methods
Material and Methods
Material
Material
Results
Table MOFA identified four latent factors explaining >5% of total variance each. Factor 1 (18.3% variance) was driven by interferon-stimulated genes and kynurenine pathway metabolites, separating active SLE from all other groups. Factor 2 (12.7%) captured anti-CCP antibody levels and rheumatoid factor alongside citrullinated peptide fragments, distinguishing seropositive from seronegative RA. Factor 3 (8.4%) reflected salivary gland glycoprotein profiles specific to Sjögren syndrome. Factor 4 (6.1%) captured a general inflammatory signature shared across autoimmune subtypes but absent in controls.
Performance Evaluation
Leave-one-out cross-validation of the final sPLS-DA model showed a mean misclassification rate of 12.6%. Permutation testing (1,000 iterations with shuffled class labels) confirmed that the observed accuracy was significantly higher than chance (p<0.001). The model's sensitivity for detecting active SLE was 91.5% and specificity was 94.2%. For seropositive RA, sensitivity was 93.8% and specificity was 96.1%. The most challenging discrimination was between seronegative RA and healthy controls, where sensitivity dropped to 76.9%. Adding more proteomic
International Journal of Biology Sciences https://www.biologyjournal.net features to the model beyond the top 50 did not improve accuracy, suggesting that the integrated feature set was already capturing most of the discriminatory signal.
Limitations
This research was conducted at a single centre, and the patient cohort was predominantly of European ancestry, which may limit generalizability to other populations where HLA allele frequencies and environmental exposures differ. The cross-sectional design captured disease status at one time point; longitudinal sampling would be needed to test whether the identified biomarkers track disease flares or treatment response. Additionally, the relatively small size of some subgroups (e.g., quiescent SLE, n = 43) reduces statistical power for that specific subtype.
Discussion
The 16-percentage-point improvement in accuracy from genomics-only to integrated classification makes a practical case for multi-omics profiling in autoimmune diagnostics. Single platforms capture distinct slices of disease biology genetic predisposition, circulating protein levels, and metabolic activity and their combination reduces the blind spots inherent in any one layer [5] . The MOFA framework proved effective at extracting biologically coherent factors: the interferon-kynurenine axis for SLE and the citrullination axis for seropositive RA map directly onto known disease mechanisms [8] . The weaker discrimination of seronegative RA from controls highlights a genuine clinical difficulty.
Seronegative RA lacks the antibody markers that define seropositive disease, and its molecular signature overlaps more with other inflammatory conditions [10] . Incorporating additional data layers such as synovial fluid proteomics or gut microbiome composition might sharpen this boundary in future work. From a translational perspective, the compact 50-feature panel is attractive because it could be assayed on targeted platforms (e.g., multiplex immunoassays and targeted metabolomics) that are faster and cheaper than the discovery-scale instruments used here. Validating this panel in an independent multicentre cohort is the logical next step before considering clinical implementation [11] .
Conclusion
This research demonstrated that integrating genomic, proteomic, and metabolomic data through a latent-factor framework substantially improves the molecular classification of autoimmune disease subtypes compared with single-platform approaches. The integrated classifier achieved 87.4% accuracy across five subtypes and identified biologically interpretable factors linked to known disease pathways. A refined 50-feature biomarker panel offers a feasible target for development into a clinical diagnostic assay, pending validation in external cohorts of diverse ancestry.
Figures and tables from the paper
| Model | Accuracy % | Bal. Acc. % | AUC (macro) | Features |
|---|---|---|---|---|
| Genomics only | 71.2 | 67.8 | 0.79 | 127 |
| Proteomics only | 68.9 | 65.4 | 0.76 | 42 |
| Metabolomics only | 63.7 | 59.1 | 0.72 | 24 |
| Integrated (MOFA) | 87.4 | 84.6 | 0.93 | 50 |
Table text extracted from the original PDF; superscript letters are shown inline. The original table image is below.
View original table image
References
18 in the original paper- Aletaha D, Neogi T, Silman AJ, Funovits J, Felson DT. 2010 Rheumatoid arthritis classification criteria. Arthritis and Rheumatism. 2010;62(9):2569-2581.
- Ellinghaus D, Jostins L, Spain SL, Cortes A, Bethune J. Analysis of five chronic inflammatory diseases identifies 27 new associations and highlights diseasespecific patterns. Nature Genetics. 2016;48(5):510-518.
- Rai MF, Patra D. Biomarkers for articular cartilage and osteoarthritis: recent advances and future challenges. Osteoarthritis and Cartilage. 2021;29(5):614-628.
- Guleria A, Pratap A, Dubey D, Rawat A, Chaurasia S. NMR-based serum metabolomics discriminates Takayasu arteritis from healthy volunteers. Journal of Proteome Research. 2015;14(8):3480-3489.
- Argelaguet R, Velten B, Arnol D, Dietrich S, Zenz T. Multi-omics factor analysis: A framework for unsupervised integration of multi-omics data sets. Molecular Systems Biology. 2018;14(6):e8124.
- Rohart F, Gautier B, Singh A, Le Cao KA. mixOmics: an R package for omics feature selection and multiple data integration. PLoS Computational Biology. 2017;13(11):e1005752.
- Ritchie MD, Holzinger ER, Li R, Pendergrass SA, Kim D. Methods of integrating data to uncover genotypephenotype interactions. Nature Reviews Genetics. 2015;16(2):85-97.
- Chiche L, Stand N, Stand N, Barnetche T. Modular transcriptional repertoire analyses of adults with systemic lupus erythematosus reveal distinct type I and type II interferon signatures. Arthritis and Rheumatology. 2014;66(6):1583-1595.
- Zhou W, Zhao Z, Zhong NL, Zhao Z. Scalable generalized linear mixed model for region-based association tests in large biobanks and cohorts. Nature Genetics. 2020;52(6):634-639.
- Burr ML, Viatte S, Plant D, Symmons DPM, Thomson W, Barton A. Environmental triggers of RA: risk factors and biomarkers. Current Rheumatology Reports. 2017;19(10):63.
- Karczewski KJ, Snyder MP. Integrative omics for health and disease. Nature Reviews Genetics. 2018;19(5):299-310.
- Pisetsky DS. Anti-DNA antibodies: quintessential biomarkers of SLE. Nature Reviews Rheumatology. 2016;12(2):102-110.
- Subramanian A, Tamayo P, Mootha VK, Mukherjee S, Ebert BL. Gene set enrichment analysis: a knowledgebased approach. Proceedings of the National Academy of Sciences. 2005;102(43):15545-15550.
- Hasin Y, Seldin M, Lusis A. Multi-omics approaches to disease. Genome Biology. 2017;18(1):83.
- Tebani A, Afonso C, Marret S, Bekri S. Omics-based strategies in precision medicine. Clinical Chemistry. 2016;62(10):1360-1371.
- McInnes IB, Schett G. The pathogenesis of rheumatoid arthritis. New England Journal of Medicine. 2011;365(23):2205-2219.
- Tsokos GC. Systemic lupus erythematosus. New England Journal of Medicine. 2011;365(22):2110-2121.
- Wishart DS. Metabolomics for investigating physiological and pathophysiological processes. Physiological Reviews. 2019;99(4):1819-1875.