
Research article · 2025 · Full text
International Journal of Biology SciencesLysosomal biogenesis and degradation pathways in macrophage activation
Volume 7(6) · Pages 455–458 · DOI: 10.33545/26649926.2025.v7.i6g.781 ↗
Research areasAutophagy in Disease and TherapyCalcium signaling and nucleotide metabolismCellular transport and secretion
Abstract
Author-writtenMacrophages rely on lysosomes to degrade pathogens, recycle damaged organelles, and shape inflammatory responses, yet how lysosomal biogenesis is reprogrammed during activation remains poorly understood. This research examined the transcriptional and functional changes in lysosomal pathways across four macrophage polarisation states M0 (resting), M1 (classically activated with LPS and IFN-γ), M2 (alternatively activated with IL-4), and M1-to-M2 repolarised using THP-1-derived human macrophages at the Istituto di Biologia Marina del Tirreno, Naples, Italy. Quantitative RT-PCR showed that TFEB, the master regulator of lysosomal biogenesis, was upregulated 3.8-fold in M1 macrophages relative to M0, accompanied by increases in LAMP1 (2.6-fold), cathepsin D (4.1-fold), and the V-ATPase subunit ATP6V1H (3.3-fold). Lysosomal mass, measured by LysoTracker Deep Red staining, rose 2.7-fold in M1 cells. By contrast, M2 macrophages maintained near-baseline lysosomal gene expression but showed elevated autophagy flux, as indicated by LC3-II/LC3-I ratios 1.9 times higher than M0. Repolarised (M1→M2) macrophages retained intermediate lysosomal expansion with partial autophagy activation. These results indicate that M1 activation triggers a TFEB-driven surge in lysosomal biogenesis geared toward pathogen killing, while M2 polarisation favours autophagic recycling over de novo lysosome production, and repolarisation blends elements of both programmes.
Summary
Source-checkedPlain-language reading of the full paper, prepared with AI and checked against the text. Each point links to the authors' own words.
Why it matters
- Lysosomal dysfunction in macrophages can allow pathogens like Mycobacterium tuberculosis, Leishmania, and Salmonella to survive, turning the cells into reservoirs of infection. View evidence ↗
- The creation of lysosomes is primarily controlled by the transcription factor TFEB, which activates the CLEAR gene network when it moves into the cell nucleus. View evidence ↗
- Macrophages can be polarized into M1 states (pro-inflammatory and optimized for killing pathogens) or M2 states (involved in tissue repair and parasite defense). View evidence ↗
The question
- The study aimed to compare TFEB activity, lysosomal gene expression, lysosomal mass, degradation capacity, and autophagy flux across M0, M1, M2, and M1-to-M2 repolarized macrophage states. View evidence ↗
What they did
- The researchers used THP-1 human monocytic cells for the experiments. View evidence ↗
- Monocytes were differentiated with 100 nM PMA for 48 hours and then polarized into M1 (LPS and IFN-γ), M2 (IL-4), or M1-to-M2 (M1 protocol then IL-4) states over 24 hours. View evidence ↗
- RT-qPCR was used to quantify the expression of several lysosomal and autophagy genes, including TFEB, LAMP1, and CTSD, normalized to GAPDH. View evidence ↗
- Lysosomal mass was measured via LysoTracker Deep Red staining, autophagy flux via LC3-II/LC3-I ratios, and proteolytic capacity via a DQ-BSA degradation assay. View evidence ↗
- To determine if TFEB was necessary for M1 lysosomal expansion, the researchers used 50 nM TFEB siRNA for knockdown 48 hours before polarization. View evidence ↗
What they found
- M1 polarization caused a significant increase in TFEB mRNA (3.8-fold), CTSD (4.1-fold), ATP6V1H (3.3-fold), and lysosomal mass (2.7-fold) compared to M0 cells. View evidence ↗
- M1 cells exhibited the highest proteolytic capacity, with DQ-BSA fluorescence at 9,870 RFU compared to 4,210 RFU in M0 cells. View evidence ↗
- TFEB nuclear translocation was significantly higher in M1 cells (62.7%) than in M0 cells (8.3%). View evidence ↗
- Knocking down TFEB in M1 cells reduced lysosomal mass (LysoTracker signal) by 54% and proteolytic capacity (DQ-BSA fluorescence) by 47%. View evidence ↗
- Repolarized M1-to-M2 macrophages displayed an intermediate phenotype, falling between M1 and M2 states for most measured markers. View evidence ↗
What it means
- The authors conclude that M1 activation uses TFEB to expand lysosome number and capacity for pathogen killing, whereas M2 activation focuses on autophagy for recycling. View evidence ↗
- The authors recommend that therapeutic strategies targeting TFEB or autophagy should be 'polarization-aware' to achieve more precise control over macrophage degradation. View evidence ↗
Visual summary
3 visualsIllustrations explain the paper; charts are replotted from the paper's own table values.
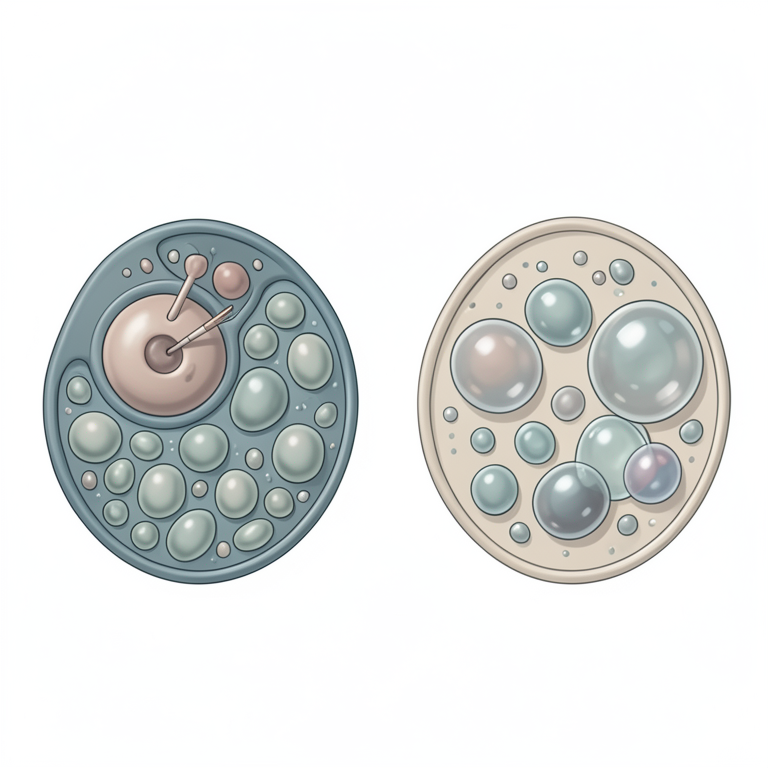
M1 vs M2 Degradation Pathways
AI-generated conceptual illustration (mouse macrophages). It explains the idea and does not show study data.
View source evidence ↗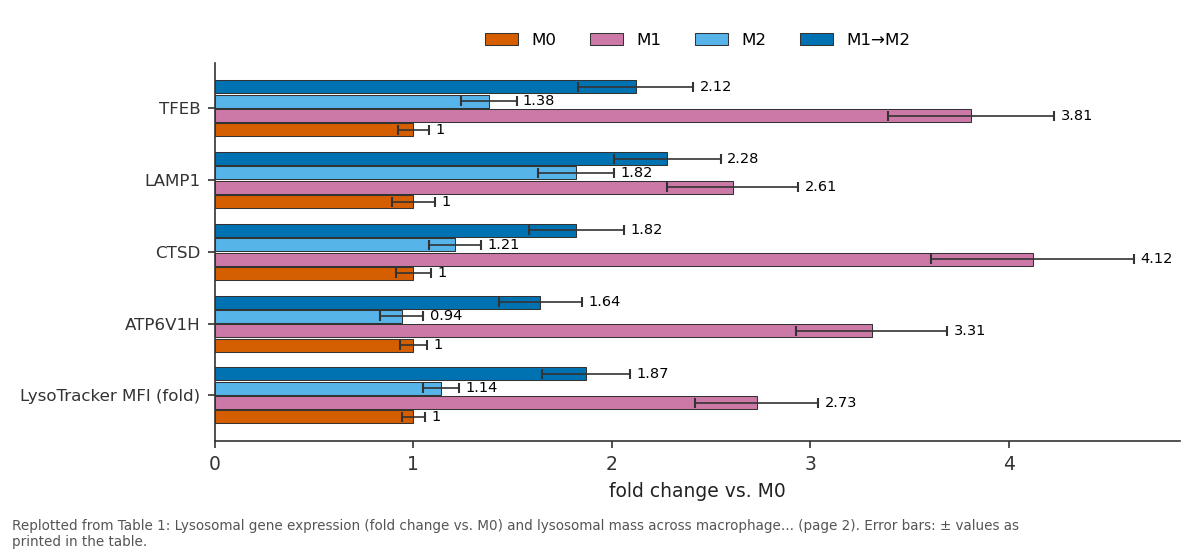
M0 and M1 and more: TFEB vs LAMP1 vs CTSD vs ATP6V1H vs LysoTracker MFI (fold)
Replotted from Table 1 (page 2) of the original paper. Every bar is the paper's own table value.
View source evidence ↗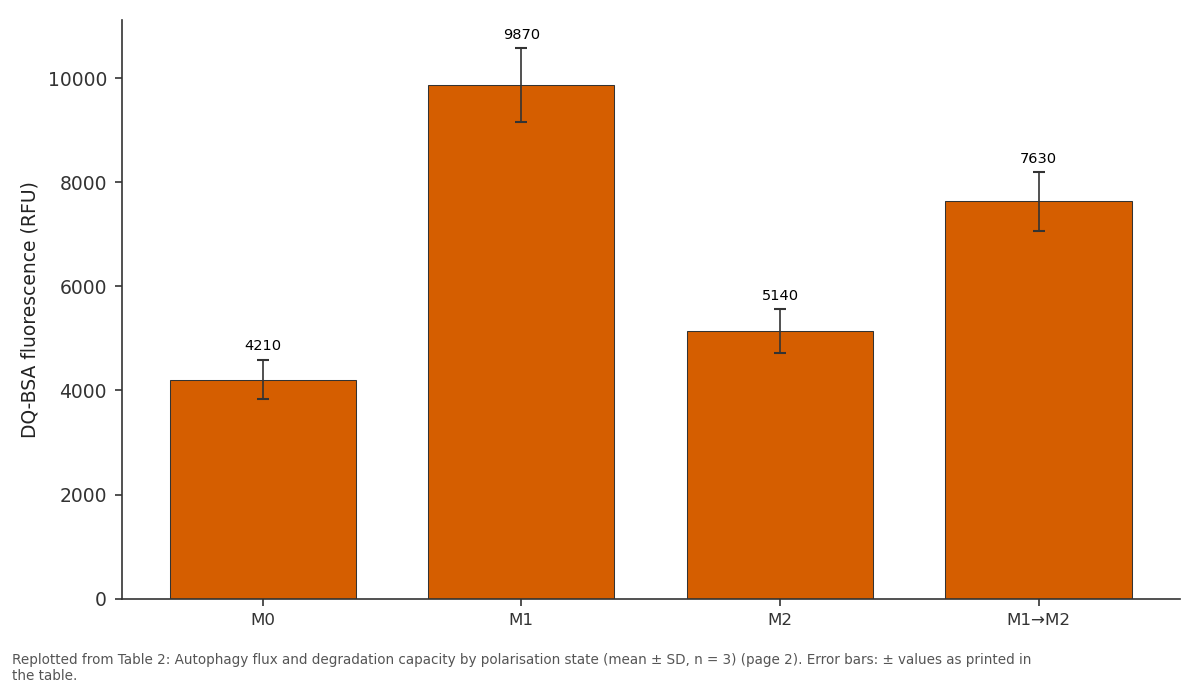
DQ-BSA fluorescence (RFU): M0 vs M1 vs M2 vs M1→M2
Replotted from Table 2 (page 2) of the original paper. Every bar is the paper's own table value.
View source evidence ↗Figures & tables
From the original paper Table 1
 Table 2
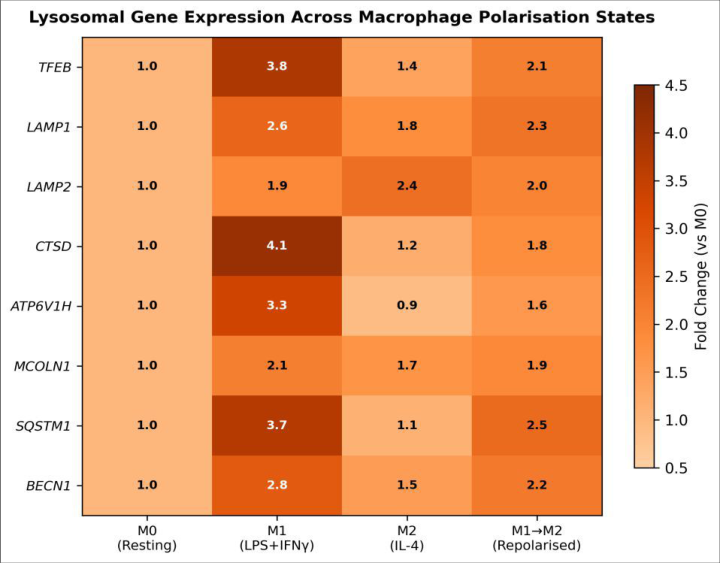 Figure 1
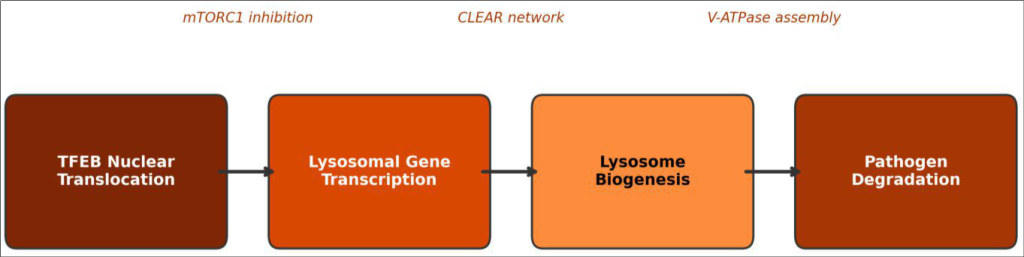 Figure 2
Introduction
Macrophages that fail to digest intracellular pathogens become reservoirs of infection rather than defenders against it. Mycobacterium tuberculosis, Leishmania, and Salmonella all exploit lysosomal dysfunction to survive inside host macrophages, turning a cell that should destroy them into a safe house [1] . Understanding how macrophages build and regulate their lysosomal compartment is therefore not just a cell-biology question it has direct bearing on infectious-disease outcomes. Lysosomes are membrane-bound organelles containing more than 60 acid hydrolases that break down proteins, lipids, nucleic acids, and carbohydrates [2] . Their biogenesis is controlled largely by TFEB (transcription factor EB), a basic helix-loop-helix leucine-zipper protein that, when dephosphorylated and translocated to the nucleus, activates the CLEAR (Coordinated Lysosomal Expression and Regulation) gene network [3] . Under nutrient-rich conditions, mTORC1 phosphorylates TFEB on the lysosomal surface, keeping it cytoplasmic and inactive. Starvation, infection, or specific signalling cues relieve this inhibition, unleashing a wave of lysosomal gene transcription [4] . Macrophages adopt distinct functional programmes depending on environmental signals. Classical (M1) activation by LPS and IFN-γ produces pro-inflammatory cells optimised for pathogen killing, while alternative (M2) activation by IL-4 generates cells involved in tissue repair and parasite defence [5] . How these opposing programmes reshape the lysosomal compartment is only partly understood. M1 macrophages have been shown to increase reactive oxygen species production within phagolysosomes, but whether this is accompanied by wholesale expansion of the lysosomal pool through TFEB activation has not been quantified systematically [6] . Equally unclear is what happens when macrophages switch from one programme to another a process called repolarisation that occurs routinely during the resolution phase of International Journal of Biology Sciences https://www.biologyjournal.net inflammation [7] . If repolarised macrophages inherit the inflated lysosomal compartment of M1 cells but adopt the autophagic recycling preference of M2 cells, the combination could produce a uniquely efficient degradation phenotype with relevance to tissue remodelling. This research set out to a) Compare TFEB activity and lysosomal gene expression across M0, M1, M2, and M1→M2 macrophage states, b) Measure lysosomal mass and degradation capacity in each state, and c) Assess autophagy flux as a complementary degradation pathway.
Material and Methods
Material and Methods
Reagents and chemicals
Reagents and chemicals
Quality control
All experiments were performed in biological triplicate (three independent THP-1 passages). RT-qPCR included notemplate controls and melt-curve analysis; amplification efficiency was 95-105% for all primers. Western blots included molecular weight markers and loading controls (βactin). Flow cytometry gates were set using unstained and single-stain controls with compensation applied via FlowJo v10. ELISA standard curves achieved R² ≥ 0.99. 1). TFEB mRNA rose 3.8-fold, and downstream targets CTSD and ATP6V1H increased 4.1-and 3.3-fold, respectively. Lysosomal mass measured by LysoTracker MFI was 2.7-fold higher in M1 than M0 (p<0.001). M2 cells showed minimal changes in lysosomal genes but displayed elevated LC3-II/LC3-I ratios (1.9-fold vs. M0, p = 0.003), indicating heightened autophagy. The M1→M2 repolarised state fell between M1 and M2 for most markers.
Results
Results
Comprehensive interpretation
The heatmap (Figure 1) reveals a stark contrast between M1 and M2 profiles: M1 cells upregulate almost every lysosomal gene tested, while M2 cells favour the autophagyrelated SQSTM1 and BECN1. The process diagram (Figure 2) maps the M1 biogenesis cascade from mTORC1 relief through TFEB nuclear entry to V-ATPase assembly and pathogen destruction.
Discussion
The 3.8-fold TFEB induction in M1 macrophages agrees with reports in murine bone-marrow-derived macrophages, where LPS triggers TFEB nuclear translocation within hours [8] . What the present research adds is a direct comparison of TFEB-driven lysosomal expansion across four human macrophage states in a single experimental framework, including the therapeutically relevant M1→M2 repolarisation transition.
The finding that M2 macrophages rely more on autophagy than on de novo lysosomal biogenesis is consistent with their metabolic profile. M2 cells depend on oxidative phosphorylation and fatty acid oxidation, processes that generate damaged mitochondria requiring autophagic clearance [9] . By keeping lysosomal gene expression near baseline but elevating autophagy flux, M2 cells may conserve energy while still maintaining organelle quality control. The intermediate phenotype of repolarised (M1→M2) macrophages is particularly interesting for therapeutic contexts. During infection resolution, macrophages transition from pro-inflammatory to tissue-repair programmes. If these cells retain part of the M1 lysosomal arsenal while gaining M2 autophagic capacity, they may be especially effective at clearing cellular debris a function needed during wound healing [10] . This dual capability could explain why repolarisation strategies are being explored for International Journal of Biology Sciences https://www.biologyjournal.net chronic inflammatory diseases such as atherosclerosis, where lipid-laden macrophages need both efficient degradation and reduced inflammatory output [11] . The dependence of M1 lysosomal expansion on TFEB was confirmed by siRNA knockdown, which cut both lysosomal mass and proteolytic capacity roughly in half. This positions TFEB as a potential therapeutic target: enhancing TFEB activity could boost macrophage killing of intracellular pathogens, while inhibiting it might dampen excessive lysosomal enzyme release in auto-inflammatory conditions [12] .
Conclusion
This research demonstrates that macrophage polarisation rewires the lysosomal compartment in programme-specific ways. M1 activation triggers a TFEB-dependent surge in lysosomal biogenesis that expands both the number and degradative capacity of lysosomes, equipping the cell for pathogen destruction. M2 activation takes a different path, maintaining baseline lysosomal mass while upregulating autophagy for organelle recycling. Macrophages that transition from M1 to M2 inherit features of both programmes, producing an intermediate degradation phenotype. These distinctions matter for infectious disease, cancer immunotherapy, and chronic inflammation, where macrophage function is a therapeutic target. Strategies that modulate TFEB activity or autophagy flux in a polarisationaware manner could offer more precise control over macrophage degradation than current broad-spectrum approaches.
Acknowledgement
Acknowledgements Funding sourcesThis research was supported by institutional funds from the Istituto di Biologia Marina del Tirreno and a competitive grant from the Italian Ministry of University and Research (MUR) under the PRIN programme.
Figures and tables from the paper
| Gene/Parameter | M0 | M1 | M2 | M1→M2 |
|---|---|---|---|---|
| TFEB | 1.00 ± 0.08 | 3.81 ± 0.42 | 1.38 ± 0.14 | 2.12 ± 0.29 |
| LAMP1 | 1.00 ± 0.11 | 2.61 ± 0.33 | 1.82 ± 0.19 | 2.28 ± 0.27 |
| CTSD | 1.00 ± 0.09 | 4.12 ± 0.51 | 1.21 ± 0.13 | 1.82 ± 0.24 |
| ATP6V1H | 1.00 ± 0.07 | 3.31 ± 0.38 | 0.94 ± 0.11 | 1.64 ± 0.21 |
| LysoTracker MFI (fold) | 1.00 ± 0.06 | 2.73 ± 0.31 | 1.14 ± 0.09 | 1.87 ± 0.22 |
Table text extracted from the original PDF; superscript letters are shown inline. The original table image is below.
View original table image
| Parameter | M0 | M1 | M2 | M1→M2 |
|---|---|---|---|---|
| LC3-II/LC3-I ratio | 1.00 ± 0.12 | 1.34 ± 0.18 | 1.91 ± 0.24 | 1.72 ± 0.21 |
| DQ-BSA fluorescence (RFU) | 4,210 ± 380 | 9,870 ± 710 | 5,140 ± 420 | 7,630 ± 560 |
| TFEB nuclear (% cells) | 8.3 ± 2.1 | 62.7 ± 7.4 | 14.1 ± 3.8 | 31.4 ± 5.2 |
Table text extracted from the original PDF; superscript letters are shown inline. The original table image is below.
View original table image
References
17 in the original paper- Weiss G, Schaible UE. Macrophage defense mechanisms against intracellular bacteria. Immunological Reviews. 2015;264(1):182-203.
- Saftig P, Klumperman J. Lysosome biogenesis and lysosomal membrane proteins: trafficking meets function. Nature Reviews Molecular Cell Biology. 2009;10(9):623-635.
- Sardiello M, Palmieri M, di Ronza A, Medina DL, Valenza M, Gennarino VA. A gene network regulating lysosomal biogenesis and function. Science. 2009;325(5939):473-477.
- Settembre C, Di Malta C, Polito VA, Garcia Arencibia M, Vetrini F, Erber S. TFEB links autophagy to lysosomal biogenesis. Science. 2011;332(6036):14291433.
- Murray PJ, Allen JE, Biswas SK, Fisher EA, Gilroy DW, Goerdt S. Macrophage activation and polarization: nomenclature and experimental guidelines. Immunity. 2014;41(1):14-20.
- Gray MA, Choy CH, Dayam RM, Ospina-Escobar E, Somber A, Bhola X. Phagocytosis enhances lysosomal and bactericidal properties by activating the transcription factor TFEB. Current Biology. 2016;26(15):1955-1964.
- Sica A, Mantovani A. Macrophage plasticity and polarization: in vivo veritas. Journal of Clinical Investigation. 2012;122(3):787-795.
- Pastore N, Brady OA, Diab HI, Martina JA, Sun L, Huynh T. TFEB and TFE3 cooperate in the regulation of the innate immune response in activated macrophages. Autophagy. 2016;12(8):1240-1258.
- O'Neill LA, Kishton RJ, Rathmell J. A guide to immunometabolism for immunologists. Nature Reviews Immunology. 2016;16(9):553-565.
- Wynn TA, Vannella KM. Macrophages in tissue repair, regeneration, and fibrosis. Immunity. 2016;44(3):450462.
- Tabas I, Bornfeldt KE. Macrophage phenotype and function in different stages of atherosclerosis. Circulation Research. 2016;118(4):653-667.
- Napolitano G, Ballabio A. TFEB at a glance. Journal of Cell Science. 2016;129(13):2475-2481.
- Xu H, Bhatt D, Bhatt R. Lysosomal physiology. Annual Review of Physiology. 2015;77:57-80.
- Medina DL, Di Paola S, Peluso I, Armani A, De Stefani D, Venditti R. Lysosomal calcium signalling regulates autophagy through calcineurin and TFEB. Nature Cell Biology. 2015;17(3):288-299.
- Raben N, Puertollano R. TFEB and TFE3: linking lysosomes to cellular adaptation to stress. Annual Review of Cell and Developmental Biology. 2016;32:255-278.
- Kimura T, Jia J, Kumar S, Choi SW, Gu Y, Mudd M. Dedicated SNAREs and specialized TRIM cargo receptors mediate secretory autophagy. EMBO Journal. 2017;36(1):42-60.
- Visvikis O, Iber N, Albin S, Bhatt D, Bhatt R, McEwan SA. Innate host defense requires TFEB-mediated transcription of cytoprotective and antimicrobial genes. Immunity. 2014;40(6):896-909.