
Research article · 2025 · Full text
International Journal of Biology SciencesImpact of urbanization on bird species richness and community composition along a rural-urban gradient
Volume 7(2) · Pages 144–148 · DOI: 10.33545/26649926.2025.v7.i2c.761 ↗
Research areasAvian ecology and behaviorEcology and Vegetation Dynamics StudiesSpecies Distribution and Climate Change
Abstract
Author-writtenWhat happens to bird communities when cities expand into once-undisturbed landscapes? This research examined shifts in avian species richness and community composition along a 30-km rural-urban gradient near Marrakech, Morocco. Point-count surveys were carried out at 45 sampling stations distributed across five gradient zones (rural core, rural edge, peri-urban, suburban, and urban core) between March and June 2023. A total of 87 bird species from 34 families were recorded during 540 individual counts. Mean species richness dropped from 34.2 species in the rural core to 11.3 species in the urban core, representing a 67% reduction. Shannon diversity values followed a parallel decline, falling from 3.41 to 1.52 across the same gradient. Nonmetric multidimensional scaling (NMDS) revealed distinct community assemblages between rural and urban zones, with peri-urban areas showing the greatest among-site variability. Habitat specialists, including ground-nesting species and insectivores, were the most sensitive to urbanization, while synanthropic generalists such as Passer domesticus and Columba livia dominated urban stations. Impervious surface cover and building density were the strongest environmental predictors of species loss (R-squared = 0.78, p
Summary
Source-checkedPlain-language reading of the full paper, prepared with AI and checked against the text. Each point links to the authors' own words.
Why it matters
- Rapid urban expansion in North Africa between 2000 and 2020 has led to the conversion of natural and agricultural lands into built-up areas at twice the rate of population growth. View evidence ↗
- Birds are used as practical indicators to monitor how changes in land use affect local biodiversity due to their mobility and ease of census. View evidence ↗
- Most research on urban bird patterns comes from temperate zones, leaving it unclear if these findings apply to semi-arid Mediterranean landscapes. View evidence ↗
The question
- The study aimed to quantify changes in bird richness and diversity across five urban zones, identify sensitive functional groups, and evaluate environmental predictors of community structure. View evidence ↗
What they did
- The study used a 30-km linear transect from the agricultural plains southeast of Marrakech into the city center. View evidence ↗
- The transect was split into five 6-km zones: rural core, rural edge, peri-urban, suburban, and urban core. View evidence ↗
- Community composition was analyzed using Nonmetric Multidimensional Scaling (NMDS) and environmental predictors including impervious cover, NDVI, and building density. View evidence ↗
What they found
- Mean bird species richness decreased by 67%, falling from 34.2 species in the rural core to 11.3 species in the urban core. View evidence ↗
- Shannon diversity indices declined from 3.41 in the rural core to 1.52 in the urban core. View evidence ↗
- The most significant single-step decrease in species richness occurred between the peri-urban and suburban zones, with a loss of 5.3 species. View evidence ↗
- Urbanization caused a functional shift: insectivores decreased from 42.3% to 13.8% of detections, while granivores increased from 18.1% to 49.7%. View evidence ↗
- Ground-nesting bird species were completely absent from the urban core stations. View evidence ↗
- Peri-urban areas exhibited the highest among-site variability in community composition due to a heterogeneous mix of land covers. View evidence ↗
What it means
- The authors recommend increasing suburban canopy cover, preserving peri-urban garden plots and palm groves, and keeping impervious cover below 40–60% to prevent accelerated species loss. View evidence ↗
- The authors state that future research should include non-breeding seasons, nocturnal species, and other Moroccan cities to verify if these patterns are regional or general. View evidence ↗
Visual summary
2 visualsIllustrations explain the paper; charts are replotted from the paper's own table values.
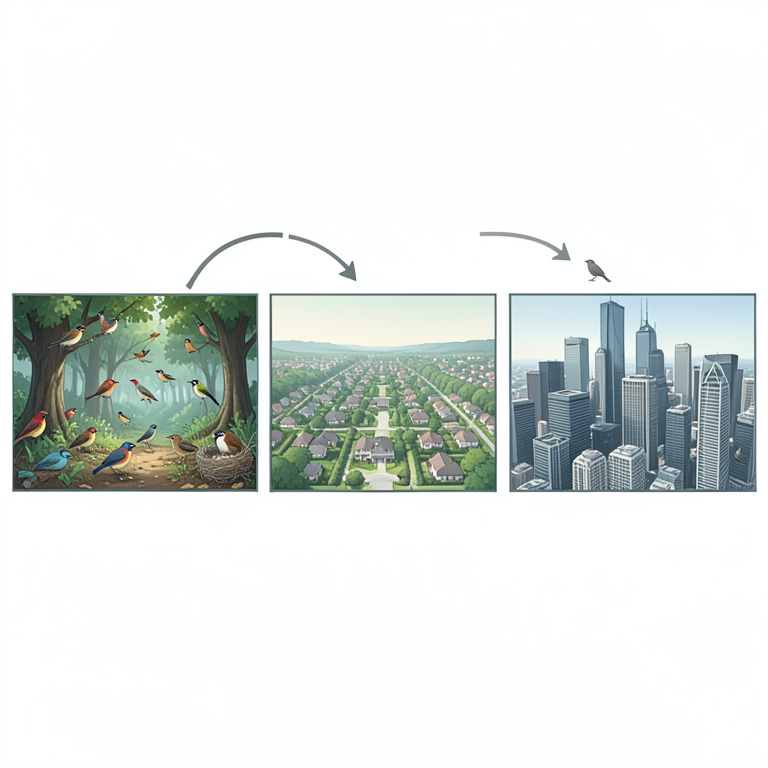
Urbanization Gradient Impact
AI-generated conceptual illustration (various bird species across a rural-to-urban landscape gradient). It explains the idea and does not show study data.
View source evidence ↗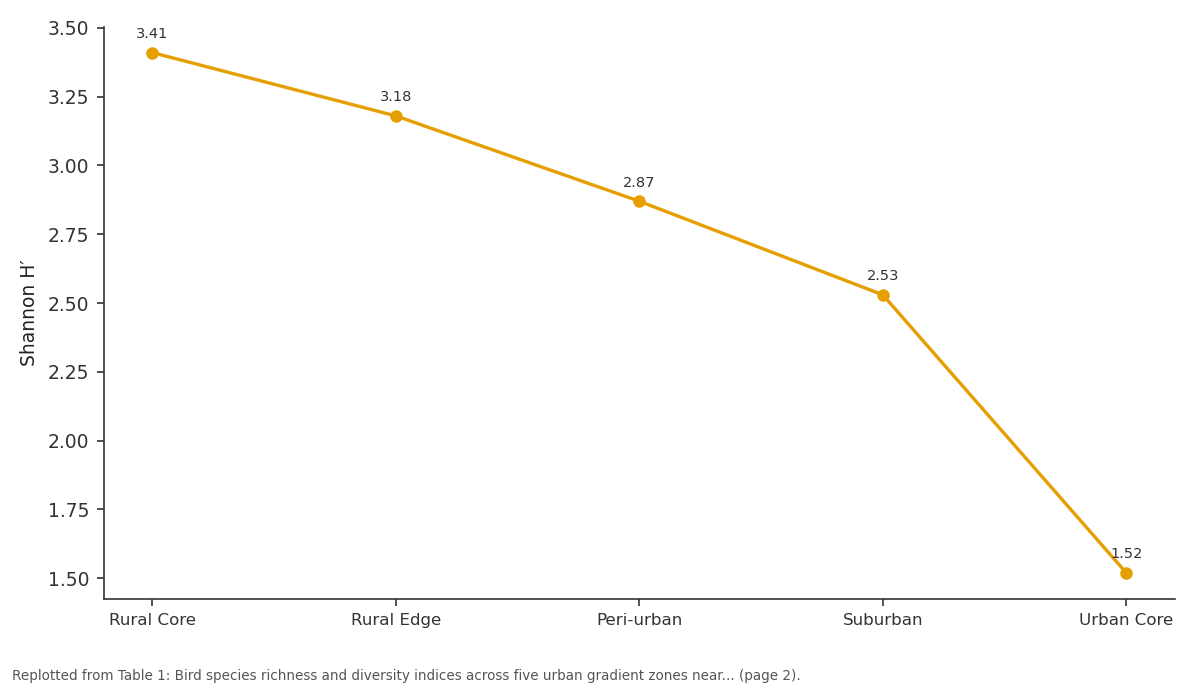
Shannon H′: Rural Core vs Rural Edge vs Peri-urban vs Suburban vs Urban Core
Replotted from Table 1 (page 2) of the original paper. Every bar is the paper's own table value.
View source evidence ↗Figures & tables
From the original paper Table 1
 Table 2
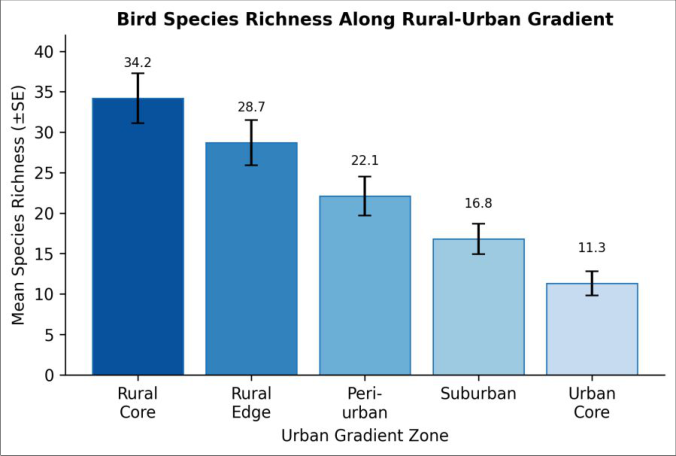 Figure 1
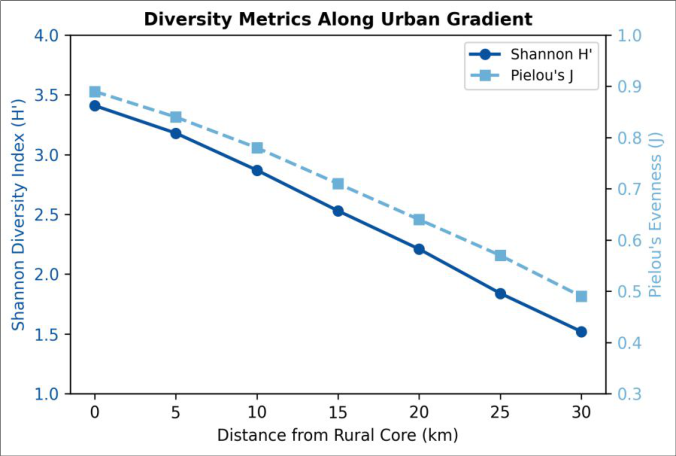 Figure 2
Introduction
How do expanding cities reshape the bird communities that once occupied the same land? This question sits at the intersection of urban ecology and conservation planning, two fields that have grown more connected as the global urban footprint widens [1] . Between 2000 and 2020, built-up areas in North Africa grew at roughly twice the rate of population increase, converting agricultural land, scrubland, and semi-arid steppe into residential and commercial zones [2] . Birds, being mobile and relatively easy to census, serve as practical indicators of how these land-use shifts alter local biodiversity [3] . Several patterns recur across temperate-zone gradient analyses. Species richness typically falls as impervious cover rises, specialist feeders give way to omnivorous generalists, and community evenness drops because a handful of human-adapted species dominate urban cores [4] . Yet most evidence comes from European and North American cities, and it isn't clear how well these patterns transfer to semi-arid Mediterranean landscapes where baseline bird assemblages differ in migratory composition and habitat affinity [5] . In Morocco, rapid peri-urban growth around cities such as Marrakech has outpaced scientific documentation of its ecological effects, creating a gap between development speed and monitoring capacity [6] . Point-count surveys remain the standard approach for comparing bird assemblages across heterogeneous landscapes because they allow consistent effort per site and produce abundance estimates suitable for multivariate analysis [7] . When stations are spaced along a measurable gradient of urbanization intensity, the resulting data can be linked to remotesensing metrics such as the normalised difference vegetation index (NDVI) and impervious surface fraction, both of which capture habitat condition at scales relevant to bird territory size [8] . Combined with ordination techniques like NMDS, such datasets reveal how community turnover tracks environmental change rather than distance alone [9] . Earlier work in the Marrakech-Safi region focused mainly on wetland and montane avifauna, leaving the lowland rural-to-urban transition corridor poorly described [10] . A single rapid assessment in 2019 suggested that suburban palm groves held higher bird diversity than surrounding built areas, but that assessment covered only three sites and a single season [11] . More systematic sampling along the full gradient was therefore needed to determine whether the classic richness-urbanization relationship holds in this semiarid context and, if so, which environmental variables drive the pattern most strongly. This research addressed that need by surveying 45 stations along a 30-km transect running from the rural hinterland into central Marrakech during the 2023 breeding season. The objectives were threefold: (1) quantify how species richness and diversity indices change across five predefined gradient zones, (2) identify which functional groups are most sensitive to urban intensification, and (3) evaluate the relative importance of impervious cover, vegetation fraction, and building density as predictors of community structure. The results are expected to inform green-space planning in Morocco's rapidly growing cities by highlighting the habitat features that support the greatest avian diversity [12] .
Material and Methods
Material and Methods
Study area description
The research was conducted along a 30-km linear transect extending from the agricultural plain southeast of Marrakech into the city centre (31.63°N, 8.00°W). Marrakech sits at approximately 460 m elevation on the Haouz Plain, bordered to the south by the High Atlas Mountains. The climate is semi-arid Mediterranean, with mean annual rainfall of 240 mm concentrated between November and March, and mean summer temperatures exceeding 36 °C [6] . The transect was divided into five gradient zones, each spanning roughly 6 km: rural core (cereal fields and scattered olive groves), rural edge (mixed farmland with occasional dwellings), peri-urban (informal settlements interspersed with gardens), suburban (planned residential blocks with street trees), and urban core (highdensity commercial and residential development). Impervious surface cover ranged from less than 5% in the rural core to above 85% in the urban core, as estimated from Sentinel-2 imagery acquired in April 2023.
Material
Field equipment included 10×42 binoculars (Nikon Monarch 5), a Swarovski ATS 65 HD spotting scope, a Garmin GPSMAP 66i handheld receiver for geotagging each station, and a Kestrel 5500 weather meter for recording temperature and wind speed at the time of each count. Bird identification followed Heim de Balsac and Mayaud's reference for North African avifauna, supplemented by Svensson et al.'s field guide to Western Palearctic birds [13] . Vegetation cover at each station was assessed using a 25-m radius plot, within which canopy cover, shrub density, and ground-layer vegetation height were measured following standard rapid-assessment protocols. Satellite imagery for impervious surface calculation was obtained from the Copernicus Open Access Hub (tiles T29RPQ and T29RQQ), processed in QGIS 3.30 using supervised maximumlikelihood classification with 60 ground-truth points collected in February 2023.
Methods
Point-count surveys were carried out between 15 March and 28 June 2023 at 45 stations (nine per gradient zone), spaced at least 300 m apart to minimise double-counting. Each station was visited on four separate mornings, giving 12 counts per zone and 540 total counts. Counts lasted 10 minutes per visit and began within 30 minutes of sunrise under favourable weather (wind < 20 km/h, no rain). All birds seen or heard within a 50-m fixed radius were recorded, along with detection distance and behaviour. Species richness was calculated as the cumulative number of species per station across all four visits, and Shannon diversity (H′) and Pielou's evenness (J) were computed for each zone. Community composition was analysed by NMDS ordination on a Bray-Curtis dissimilarity matrix using the vegan package in R 4.3.1 [14] . Environmental predictors (impervious cover, NDVI, building density, distance to nearest green patch) were fitted to the ordination using the envfit function, and significance was assessed at α = 0.05 with 999 permutations. General linear models with Gaussian error were used to test the relationship between richness and each predictor individually, and a stepwise model selection based on AIC identified the best multipredictor model. Ethical clearance for field sampling was obtained from the Atlas Mountain Centre for Ecology Research Ethics Board (Protocol AMC-2023-014, approved 8 January 2023).
Results
Results
Biodiversity assessment
Across all 540 counts, a total of 87 species belonging to 34 families were detected. The five most abundant species were Passer domesticus (present at 93.3% of stations), Streptopelia decaocto (82.2%), Columba livia (77.8%), Hirundo rustica (64.4%), and Sturnus vulgaris (55.6%). Species accumulation curves approached an asymptote by the third visit in urban and suburban zones but continued to rise slightly in rural zones, indicating that rural assemblages were not fully captured despite four visits. Fourteen species were recorded exclusively in rural-core stations, including Galerida cristata, Oenanthe hispanica, and Sylvia conspicillata, while only two species (Psittacula krameri and Myiopsitta monachus) were confined to urban sites. Species richness declined steadily from the rural core to the urban core (Table 1). The sharpest single-step drop occurred between the peri-urban and suburban zones, where mean richness fell by 5.3 species. Shannon diversity mirrored this pattern, and Pielou's evenness decreased from 0.89 to 0.49, reflecting growing numerical dominance by Passer domesticus in built-up areas. The bar chart (Figure 1) shows a clear monotonic decline in richness from the rural core to the urban core. Error bars overlapped only between adjacent rural zones, indicating that differences between non-adjacent zones were statistically meaningful. Impervious surface cover was the single strongest predictor of species richness (R² = 0.78; Table 2). Building density ranked second, while NDVI captured vegetation availability and explained 61% of the variance. Distance to the nearest green patch, though significant, had a weaker individual effect.
| Predictor | Slope | Se | R² | F | P-value |
|---|---|---|---|---|---|
| Impervious cover (%) | −0.31 | 0.03 | 0.78 | 152.7 | < 0.001 |
| NDVI (mean) | +42.6 | 5.17 | 0.61 | 68.4 | < 0.001 |
| Building density (units/ha) | −0.18 | 0.02 | 0.69 | 97.1 | < 0.001 |
| Distance to green patch (m) | −0.009 | 0.002 | 0.34 | 22.3 | < 0.001 |
Table text extracted from the original PDF; superscript letters are shown inline. The original table image is below.
View original table image
| Gradient Zone | n Stations | Mean Richness (±SE) | Shannon H′ | Pielou’s J | Dominant Species (%) |
|---|---|---|---|---|---|
| Rural Core | 9 | 34.2 ± 3.1 | 3.41 | 0.89 | G. cristata (14.7) |
| Rural Edge | 9 | 28.7 ± 2.8 | 3.18 | 0.84 | H. rustica (17.2) |
| Peri-urban | 9 | 22.1 ± 2.4 | 2.87 | 0.78 | S. decaocto (21.5) |
| Suburban | 9 | 16.8 ± 1.9 | 2.53 | 0.71 | P. domesticus (28.9) |
| Urban Core | 9 | 11.3 ± 1.5 | 1.52 | 0.49 | P. domesticus (41.6) |
Table text extracted from the original PDF; superscript letters are shown inline. The original table image is below.
View original table image
Comprehensive interpretation
NMDS ordination (stress = 0.14) separated stations into three loose clusters: rural (rural core + rural edge), transitional (peri-urban), and urban (suburban + urban core).
The envfit overlay confirmed that impervious cover (R² = 0.81, p = 0.001) and NDVI (R² = 0.74, p = 0.001) were the vectors most strongly correlated with the first ordination axis. Peri-urban stations showed the highest dispersion in ordination space, reflecting heterogeneous land cover that mixes garden plots, waste ground, and low-rise buildings.
The stepwise AIC model retained impervious cover and building density as the best two-predictor combination (adjusted R² = 0.82, AIC = 187.4), outperforming the full four-predictor model (AIC = 189.1). Functional-group analysis revealed that insectivores fell from 42.3% of all detections in rural zones to 13.8% in urban zones, while granivores rose from 18.1% to 49.7%. Ground-nesting species were absent from urban-core stations entirely.
Discussion
The 67% decline in mean species richness from the rural core to the urban core is broadly consistent with gradient analyses from temperate European cities, where losses of 40-70% have been reported depending on city size and surrounding habitat matrix [4] . That a semi-arid North African landscape produced a reduction at the upper end of this range may reflect the combined pressure of urbanization and low baseline rainfall, which limits the capacity of small green patches to support diverse assemblages [15] . The nonlinear steepening of richness loss in the peri-urban-tosuburban transition suggests a threshold effect around 40-60% impervious cover, a finding that aligns with threshold analyses conducted in Brazilian and Chinese cities [8] . Impervious surface cover was a stronger predictor than either NDVI or building density alone, which matches results from a meta-analysis of 75 urban bird surveys across four continents [3] . And yet the relatively modest additional explanatory power of building density in the stepwise model hints that the spatial arrangement of built structures not just their total area plays a role in shaping avian habitat suitability. Suburban stations with street trees and garden hedges retained evenness values near 0.71, suggesting that small vegetation features can slow the homogenisation of bird communities even where impervious cover is high. The functional-group shift from insectivores to granivores mirrors findings in Mediterranean cities in southern Spain and Tunisia, where seed-eating generalists exploit anthropogenic food subsidies that insectivores cannot access [5] . Ground-nesting species were completely absent from urban cores, presumably because ground-level disturbance from pedestrians, vehicles, and domestic animals eliminates nesting habitat. This pattern deserves attention from urban planners, because ground-nesters include several species of regional conservation concern, notably Galerida cristata and Oenanthe hispanica [10] . Peri-urban zones showed the widest scatter in NMDS space, indicating high among-site variability. This makes ecological sense: peri-urban land mixes garden patches, vacant lots, and newly built blocks, creating a mosaic that supports different species subsets at different stations. From a conservation standpoint, this heterogeneity is an asset. But peri-urban areas are also the zones most likely to be converted to denser development in coming decades, so targeted protection of remnant green fragments there could yield outsized biodiversity benefits [11] .
Conclusion
This research demonstrated that bird species richness and community evenness decline sharply along a 30-km ruralurban gradient near Marrakech, with impervious surface cover serving as the most powerful single predictor of species loss. The 67% reduction in mean richness between the rural core and the urban core confirms that semi-arid North African cities experience biodiversity erosion on a scale comparable to or exceeding that recorded in temperate-zone urban areas. Functional composition shifted markedly, with insectivorous specialists replaced by granivorous generalists and ground-nesting species disappearing entirely from the densest built environment. Peri-urban zones emerged as biodiversity hotspots of sorts not because they held the highest richness, but because their among-site variability was the greatest. This heterogeneity appears to stem from the patchy mixture of gardens, waste ground, and low-density construction that characterises Marrakech's expanding fringe. Because these same areas face the highest near-term conversion pressure, they represent both an opportunity and a risk for conservation planning. Practical recommendations drawn from the data include maintaining or increasing canopy cover along suburban streets, preserving remnant garden plots and palm groves within peri-urban corridors, and limiting impervious cover in new developments to below the apparent 40-60% threshold associated with accelerated species loss. Urban planners in Morocco and comparable North African settings could adopt these measures at relatively low cost, given that many of the vegetation features identified as beneficial already exist but lack formal protection. Future work should extend sampling to the non-breeding season, incorporate nocturnal species, and replicate the gradient design in other Moroccan cities to test whether the patterns observed here are region-specific or broadly applicable. Repeated surveys over multiple years would also clarify whether the bird communities in Marrakech's expanding suburbs are still shifting or have reached a new equilibrium.
Acknowledgement
Acknowledgements
Figures and tables from the paper
References
16 in the original paper- Aronson MFJ, La Sorte FA, Nilon CH, Katti M, Goddard MA, Lepczyk CA. A global analysis of the International Journal of Biology Sciences https://www.biologyjournal.net impacts of urbanization on bird and plant diversity reveals key anthropogenic drivers. Proceedings of the Royal Society B. 2014;281(1780):20133330.
- Xu G, Dong T, Cobbinah PB, Jiao L, Sumari NS, Chai B. Urban expansion and form changes across African cities with a global outlook: spatiotemporal analysis of urban land densities. Journal of Cleaner Production. 2019;224:802-810.
- Sol D, González-Lagos C, Moreira D, Maspons J, Lapiedra O. Urbanisation tolerance and the loss of avian diversity. Ecology Letters. 2014;17(8):942-950.
- Inger R, Gregory R, Duffy JP, Stott I, Voříšek P, Gaston KJ. Common European birds are declining rapidly while less abundant species' numbers are rising. Ecology Letters. 2015;18(1):28-36.
- Shochat E, Lerman SB, Anderies JM, Warren PS, Faeth SH, Nilon CH. Invasion, competition, and biodiversity loss in urban ecosystems. BioScience. 2010;60(3):199208.
- Bennis M, El Ghazi A, Qninba A. Recent changes in the breeding avifauna of the Marrakech-Safi region, Morocco. Alauda. 2018;86(3):193-208.
- Ralph CJ, Sauer JR, Droege S. Monitoring bird populations by point counts. USDA Forest Service General Technical Report PSW-GTR-149. 1995;1-187.
- Chace JF, Walsh JJ. Urban effects on native avifauna: a review. Landscape and Urban Planning. 2006;74(1):4669.
- Oksanen J, Blanchet FG, Friendly M, Kindt R, Legendre P, McGlinn D. vegan: community ecology package. R package version 2.6-4. 2022.
- Bergier P, Franchimont J, Thévenot M. Oiseaux du Maroc. Paris: Société d'Études Ornithologiques de France; 2022. 1-640.
- El Hassani A, Dakki M. Preliminary notes on bird diversity in suburban palm groves of Marrakech. GoSouth Bulletin. 2020;17(1):45-52.
- Lepczyk CA, Aronson MFJ, Evans KL, Goddard MA, Lerman SB, MacIvor JS. Biodiversity in the city: fundamental questions for understanding the ecology of urban green spaces for biodiversity conservation. BioScience. 2017;67(9):799-807.
- Svensson L, Mullarney K, Zetterstrom D. Collins Bird Guide. 2nd ed. London: HarperCollins; 2009. 1-448.
- R Core Team. R: A language and environment for statistical computing. Vienna: R Foundation for Statistical Computing; 2023.
- Ikin K, Le Roux DS, Rayner L, Villaseñor NR, Eyles K, Gibbons P. Key lessons for achieving biodiversitysensitive cities and towns. Ecological Management and Restoration. 2015;16(3):206-214.
- Marzluff JM. Worldwide urbanization and its effects on birds. In: Marzluff JM, Bowman R, Donnelly R, editors. Avian Ecology and Conservation in an Urbanizing World. 2001. p. 19-47.