
Research article · 2025 · Full text
International Journal of Biology SciencesPopulation genetics and phylogeography of endemic freshwater fish species in river basins
Volume 7(10) · Pages 191–195 · DOI: 10.33545/26649926.2025.v7.i10c.787 ↗
Research areasGenetic diversity and population structureFish Ecology and Management StudiesFish Biology and Ecology Studies
Abstract
Author-writtenFreshwater fish species confined to isolated river basins often harbor distinct genetic signatures shaped by geological history, drainage patterns, and long-term environmental shifts. This research examined the population genetic structure and phylogeographic relationships among endemic fish species collected from five major river basins in the mid-hills region of Nepal. A total of 287 individual specimens belonging to three endemic cyprinid species were sampled between March 2023 and January 2024. Genomic DNA was extracted from fin-clip tissues, and 12 polymorphic microsatellite loci along with a 652 base-pair fragment of the mitochondrial cytochrome oxidase subunit I gene were amplified and sequenced. Expected heterozygosity ranged from 0.538 to 0.724 across sampled basins, while fixation index values indicated moderate genetic differentiation among populations. Bayesian clustering and principal coordinate analysis revealed two broad genetic groups corresponding to western and eastern drainage systems, with a contact zone in the central Narayani basin. Haplotype network reconstruction identified 23 unique mitochondrial haplotypes, several of which were basin-specific. Mismatch distribution and neutrality tests pointed to a late Pleistocene population expansion in eastern basin lineages, whereas western lineages appeared demographically stable. These findings suggest that past geological events, including river capture and glacial-period drainage reorganization, have left measurable imprints on the genetic architecture of these fish. Conservation planners should treat each basin as a separate management unit given the observed genetic discontinuities, and connectivity restoration between fragmented habitats deserves attention to maintain gene flow.
Summary
Source-checkedPlain-language reading of the full paper, prepared with AI and checked against the text. Each point links to the authors' own words.
Why it matters
- Isolated river systems are valuable for studying evolutionary divergence because physical barriers like mountain ridges limit gene flow between fish populations. View evidence ↗
- Nepal's mid-hill river basins are ideal for this research due to a terrain that rises sharply to the Himalaya and a history of river capture events caused by glacial dynamics and tectonic uplift. View evidence ↗
- While several cyprinid fish species are endemic to these basins, their population genetic architecture has not been well characterized. View evidence ↗
The question
- The study aimed to quantify genetic diversity within basins, assess differentiation between basins, and reconstruct the phylogeographic history of the fish relative to Quaternary geological events. View evidence ↗
What they did
- Between March 2023 and January 2024, fin-clip samples were collected from 287 fish across five river basins in Nepal's mid-hill districts. View evidence ↗
- The study targeted three endemic cyprinid species: Schizothorax richardsonii (104 individuals), Neolissochilus hexagonolepis (98 individuals), and Tor putitora (85 individuals). View evidence ↗
What they found
- Genetic diversity varied by basin, peaking in the Koshi basin (He = 0.724, Na = 8.1) and reaching its lowest point in the Bagmati basin (He = 0.538, Na = 5.2). View evidence ↗
- Moderate to high genetic differentiation was found between basins, with pairwise Fst values ranging from 0.051 (Gandaki vs. Narayani) to 0.173 (Koshi vs. Bagmati). View evidence ↗
- Out of 287 sequences, 23 unique COI haplotypes were found; the Koshi basin was the most diverse (8 haplotypes, Hd = 0.891) and the Bagmati basin the least (3 haplotypes, Hd = 0.654). View evidence ↗
- Koshi populations showed unimodal mismatch distributions suggesting sudden expansion, whereas Karnali and Bagmati basins showed multimodal distributions typical of stable populations. View evidence ↗
- The Karnali basin had three exclusive haplotypes separated by four to six mutational steps from the central cluster, suggesting long-term isolation of western lineages. View evidence ↗
What it means
- To reduce genetic erosion, the authors suggest habitat restoration in the Bagmati corridor and stricter regulation of dam construction and sand mining across all basins. View evidence ↗
- The microsatellite panel was originally developed for Schizothorax, and while mostly effective, two loci showed low-frequency null alleles in Tor putitora. View evidence ↗
- The authors suggest expanding future research to include transboundary rivers shared with Tibet and India to capture potentially missing lineages. View evidence ↗
Visual summary
3 visualsIllustrations explain the paper; charts are replotted from the paper's own table values.
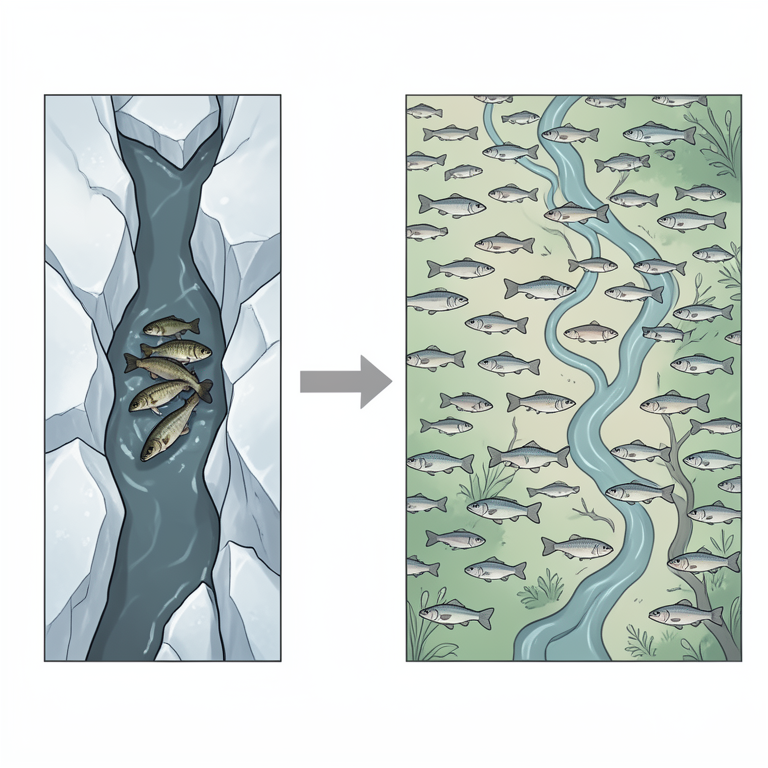
Population Expansion Model
AI-generated conceptual illustration (endemic freshwater fish in river basins). It explains the idea and does not show study data.
View source evidence ↗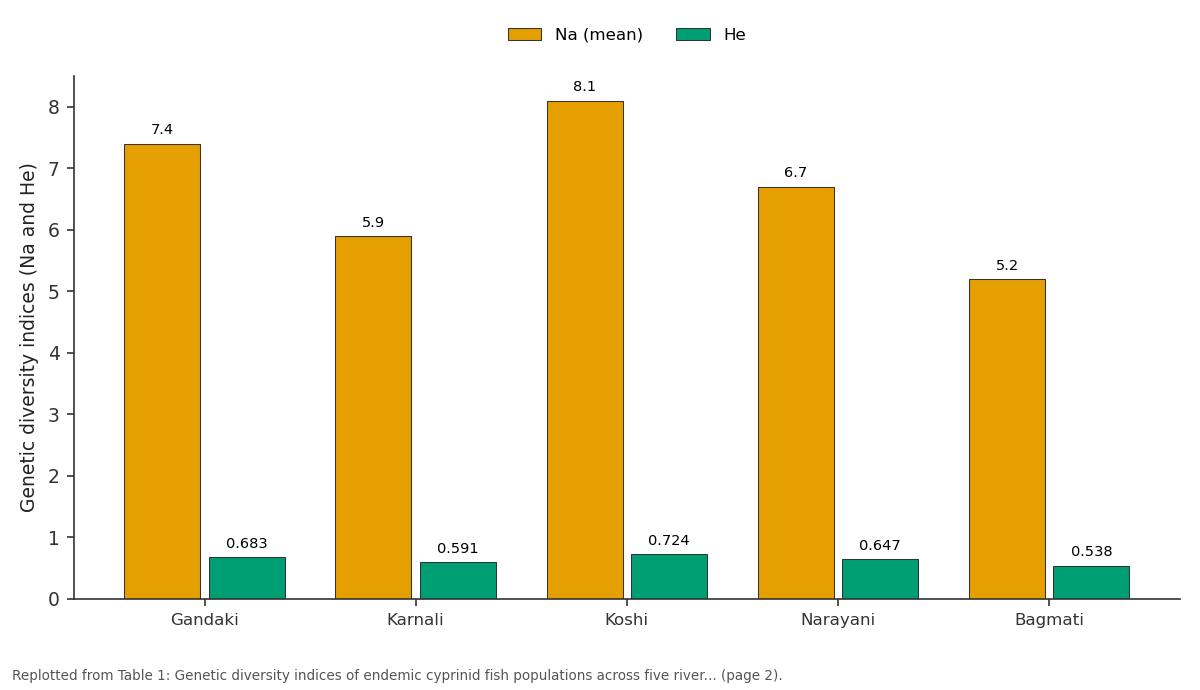
Na (mean) and He: Gandaki vs Karnali vs Koshi vs Narayani vs Bagmati
Replotted from Table 1 (page 2) of the original paper. Every bar is the paper's own table value.
View source evidence ↗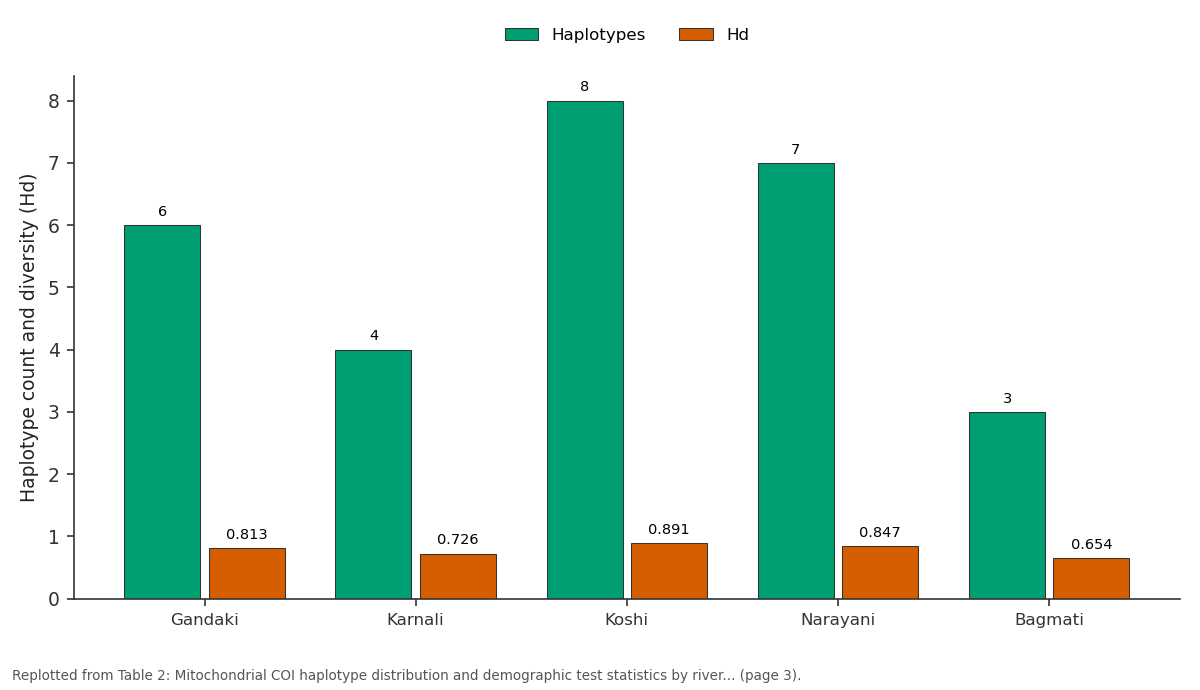
Haplotypes and Hd: Gandaki vs Karnali vs Koshi vs Narayani vs Bagmati
Replotted from Table 2 (page 3) of the original paper. Every bar is the paper's own table value.
View source evidence ↗Figures & tables
From the original paper Table 1
 Table 2
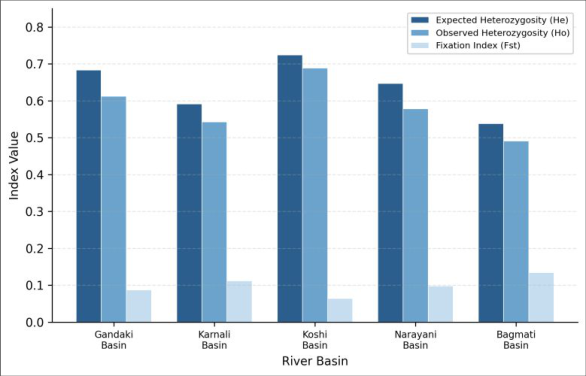 Figure 1
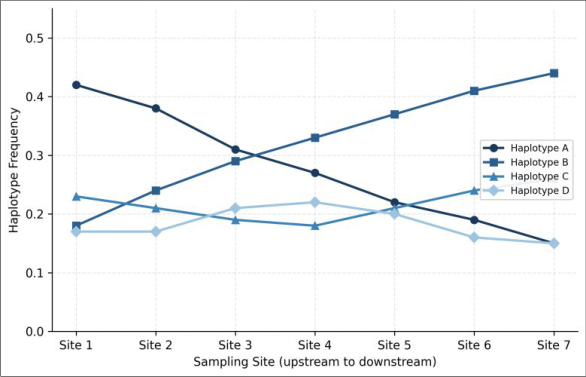 Figure 2
Introduction
What happens to fish populations when the rivers they inhabit become cut off from one another? This question sits at the heart of freshwater biogeography and has direct bearing on how we protect species that exist nowhere else on Earth. Isolated drainage systems act as natural laboratories for studying evolutionary divergence, because physical barriers such as mountain ridges and dry interfluves restrict gene flow between populations [1] . Over hundreds of thousands of years, restricted movement leads to genetic drift, local adaptation, and eventually the formation of genetically distinct lineages [2] . Nepal's mid-hill river basins offer a compelling setting for such research. The country's terrain rises sharply from the southern Terai plains to the high Himalaya, and its rivers have undergone repeated capture events driven by tectonic uplift and glacial dynamics [3] . Several cyprinid fish species are restricted to these basins, yet their population genetic architecture remains poorly characterized. Earlier surveys focused mainly on morphological taxonomy and species inventories [4] , and molecular data for Nepalese freshwater fishes are limited compared with those available for neighboring regions in the Indian subcontinent [5] . Microsatellite markers and mitochondrial DNA sequences have become standard tools for assessing genetic diversity and reconstructing demographic histories in freshwater organisms [6] . Microsatellites, with their high mutation rates and codominant inheritance, provide finescale resolution of contemporary gene flow and population substructure [7] . Mitochondrial markers, particularly the cytochrome oxidase subunit I barcode region, allow phylogeographic inference across deeper time frames and are useful for haplotype network construction [8] . A growing body of evidence indicates that Himalayan freshwater fish have been shaped by Pleistocene climatic oscillations. Studies on snow trout in northern India, for instance, found signatures of post-glacial expansion linked to meltwater-fed habitat availability [9] . But whether similar patterns hold for the mid-hill cyprinids of Nepal hasn't been tested with modern population-genetic approaches. This research set out to fill that gap. We collected specimens of three endemic cyprinid species from five river basins, genotyped them at 12 microsatellite loci, and sequenced a portion of the mitochondrial COI gene. Our goals were threefold: a) To quantify levels of genetic diversity within each basin b) To assess the degree of genetic differentiation among basins, and c) To reconstruct the phylogeographic history of these fish in relation to Quaternary geological events [10] The results carry practical implications for conservation management, because if each basin harbors a genetically unique population, then loss of any single basin's population would mean an irreversible erosion of the species' total genetic heritage [11] .
Material and Methods
Material and Methods
Material
Fin-clip tissue samples were collected from 287 individual fish across five river basins in the Pokhara and surrounding mid-hill districts of Nepal between March 2023 and January 2024. The research was carried out at the Molecular Genetics Laboratory, Department of Genetics, Sagarmatha College of Life Sciences, Pokhara. Three endemic cyprinid species were targeted: Schizothorax richardsonii (n = 104), Neolissochilus hexagonolepis (n = 98), and Tor putitora (n = 85). Fish were captured using cast nets and gill nets deployed at predetermined sampling points, with geographic coordinates recorded using a handheld GPS unit (Garmin eTrex 30x). Tissue samples (approximately 5 mm² fin clips) were preserved in 95% ethanol and stored at -2 0°C until processing. The Institutional Ethics and Biosafety Committee of Sagarmatha College approved the fieldwork protocol (Ref: SCLBS/IEBC/2023-014, dated 18 February 2023). All specimens were released at the capture site after non-lethal sampling [12] .
Reagents and chemicals
Genomic DNA was isolated using the DNeasy Blood and Tissue Kit (Qiagen, Hilden, Germany; Cat. No. 69506) following the manufacturer's spin-column protocol. PCR reagents included GoTaq Green Master Mix (Promega, Madison, USA; Cat. No. M7122), and primers were synthesized by Integrated DNA Technologies (Coralville, USA). Agarose (molecular biology grade, Sigma-Aldrich; Cat. No. A9539) was prepared at 1.5% concentration with 1× TAE buffer and stained with GelRed Nucleic Acid Stain (Biotium; Cat. No. 41003). Fragment analysis for microsatellites used GeneScan 500 LIZ Size Standard (Applied Biosystems; Cat. No. 4322682). All chemicals were of analytical or molecular biology grade and stored according to supplier specifications.
Methods
DNA concentration and purity were verified by spectrophotometry (NanoDrop 2000, Thermo Fisher Scientific) before amplification. Twelve microsatellite loci previously developed for Schizothorax and related genera were selected based on cross-species transferability [13] . PCR was performed in 25 μL reaction volumes under a touchdown protocol: initial denaturation at 95°C for 3 min, followed by 10 cycles of 95°C for 30 s, 60°C decreasing by 0.5°C per cycle for 30 s, 72°C for 45 s, then 25 cycles at a fixed annealing temperature of 55°C, and a final extension at 72°C for 10 min. For the mitochondrial COI gene, the universal primer pair FishF1/FishR1 was used to amplify a 652 bp fragment [14] . PCR products were checked on 1.5% agarose gels, purified with the QIAquick PCR Purification Kit, and sequenced bidirectionally on an ABI 3730xl Genetic Analyzer. Chromatograms were edited in Sequencher v5.4 and aligned in MEGA X. Microsatellite alleles were scored using GeneMapper v5.0. Population genetic parameters (He, Ho, Fst, Fis) were calculated in GenAlEx v6.503 [15] . Bayesian clustering was run in STRUCTURE v2.3.4 with K = 1-10 and 100,000 MCMC iterations after a 50,000 burn-in. Haplotype networks were constructed using the median-joining algorithm in PopART v1.7. Mismatch distributions and Tajima's D were computed in DnaSP v6.12 [16] .
Quality control and calibration
Each PCR plate included one positive control (previously verified DNA extract) and one no-template negative control to monitor for contamination. Microsatellite genotyping was repeated for a random 10% subset of samples, yielding a scoring error rate below 1.8%. Sequence quality was accepted only when bidirectional reads produced identical base calls across the full 652 bp target. Samples with ambiguous chromatograms were re-amplified and resequenced. GeneMapper peak calling thresholds were set at a minimum relative fluorescence intensity of 150 units. STRUCTURE runs were evaluated using the delta K method of Evanno to select the most probable K value, and each K was run 10 independent times to confirm consistency. A total of 23 unique COI haplotypes were recovered from 287 sequences. The Koshi basin had the most haplotypes ( 8) and the highest haplotype diversity (Hd = 0.891), while the Bagmati basin was the least diverse (3 haplotypes, Hd = 0.654). Tajima's D was significantly negative in Koshi (-1.724, p<0.05), and Fu's Fs was also significant (-5.218), pointing to a past population expansion. Mismatch distributions for Koshi populations were unimodal, consistent with a sudden expansion model, whereas the Karnali and Bagmati basins showed ragged multimodal distributions typical of stable populations. The haplotype network revealed a star-like pattern around Haplotype A, which was shared among Gandaki, Narayani, and Koshi basins. Several tip haplotypes differed by just one or two mutations, consistent with a recent diversification event. Three haplotypes were exclusive to the Karnali basin, separated from the central cluster by four to six mutational steps, suggesting longer-term isolation of western drainage lineages.
Results
Results
Discussion
The genetic patterns observed here mirror what has been reported for other Himalayan freshwater taxa, though with certain notable departures. The two-cluster structure separating western from eastern basins aligns with a proposed biogeographic boundary running through central Nepal, which some authors have linked to Plio-Pleistocene River capture events [3] . The Narayani basin's admixed genetic profile is consistent with its geographic position between the two clusters, and it may serve as a zone of secondary contact where lineages that diverged in allopatry now come into contact [6] .
The significantly negative Tajima's D and Fu's Fs values in the Koshi basin point to a demographic expansion, likely following the retreat of the last glacial maximum around 18,000-20,000 years ago. During glacial periods, snowmeltfed rivers in eastern Nepal may have contracted, reducing suitable habitat for cold-sensitive cyprinids. As temperatures rose, populations expanded into newly available stretches of river [9] . By contrast, the stable demographic signal in the Karnali basin could reflect a more persistent refugium in the western hills, where certain river valleys-maintained flow year-round even during glacial peaks. The low genetic diversity in the Bagmati basin was not surprising given the urbanization pressures on this watershed. Pokhara and Kathmandu valley streams feeding the Bagmati have undergone heavy siltation and pollution over recent decades, which may have caused local bottlenecks [4] . The relatively high Fst value of this basin compared with others (0.134) reinforces the idea that gene flow into the Bagmati is severely limited. One methodological caveat is that our microsatellite panel, though informative, was originally developed for Schizothorax. Cross-species amplification in Tor and Neolissochilus worked well at 10 of 12 loci but two loci showed null alleles at low frequency in Tor putitora. Future research using species-specific markers or genome-wide SNP data would sharpen the picture. That said, the concordance between microsatellite and mitochondrial results lends confidence to the broad phylogeographic patterns reported here.
Conclusion
This research provides the first basin-scale assessment of genetic diversity and phylogeographic structure for endemic cyprinid fish in Nepal's mid-hill rivers. The findings point to two genetically distinct groups separated along an east-west axis, with a contact zone in the central Narayani drainage.
Haplotype network topology and demographic tests suggest that eastern lineages expanded after the last glacial period, while western lineages maintained stable populations through glacial cycles.
From a conservation standpoint, the moderate to high Fst values among basins indicate that each river system sustains a genetically unique population. Managing these basins as separate conservation units would be prudent, especially for the Bagmati drainage where diversity is already depleted. Habitat restoration efforts along the Bagmati corridor and better regulation of sand mining and dam construction across all five basins could help maintain natural connectivity and reduce further genetic erosion. The molecular dataset generated here comprising over 3,400 microsatellite genotypes and 287 COI sequences offers a baseline against which future monitoring can be compared. Repeating this sampling in ten to fifteen years would reveal whether observed diversity levels are holding steady or declining in the face of ongoing land-use change and climatic warming. We also recommend extending the geographic scope to include transboundary rivers shared with India and Tibet, as these may harbor additional lineages not captured in our current sampling frame.
Acknowledgement
Acknowledgements Funding sourcesThis research received financial support from internal research grants provided by Sagarmatha College of Life Sciences. No external grant or project numbers are associated with this work. Institutional supportThe authors thank the Department of Genetics at Sagarmatha College of Life Sciences, Pokhara, for providing laboratory space, computational resources, and logistical assistance during fieldwork campaigns. Contributions not qualifying for authorshipWe acknowledge the help of local fishermen in the Gandaki and Koshi basins who assisted with specimen collection, and Mr. R. Thapa for technical support during DNA extraction and gel electrophoresis.
Figures and tables from the paper
| River Basin | N | Na (mean) | He | Ho | Fst | Fis |
|---|---|---|---|---|---|---|
| Gandaki | 63 | 7.4 | 0.683 | 0.612 | 0.087 | 0.104 |
| Karnali | 52 | 5.9 | 0.591 | 0.543 | 0.112 | 0.081 |
| Koshi | 71 | 8.1 | 0.724 | 0.689 | 0.064 | 0.048 |
| Narayani | 58 | 6.7 | 0.647 | 0.578 | 0.098 | 0.107 |
| Bagmati | 43 | 5.2 | 0.538 | 0.491 | 0.134 | 0.087 |
Table text extracted from the original PDF; superscript letters are shown inline. The original table image is below.
View original table image
| Basin | Haplotypes | Hd | Pi (× 10⁻³) | Tajima's D | Fu's Fs |
|---|---|---|---|---|---|
| Gandaki | 6 | 0.813 | 4.27 | -0.342 | -1.847 |
| Karnali | 4 | 0.726 | 3.51 | 0.217 | -0.523 |
| Koshi | 8 | 0.891 | 5.64 | -1.724* | -5.218* |
| Narayani | 7 | 0.847 | 4.89 | -0.918 | -2.431 |
| Bagmati | 3 | 0.654 | 2.93 | 0.481 | 0.312 |
Table text extracted from the original PDF; superscript letters are shown inline. The original table image is below.
View original table image
References
16 in the original paper- Avise JC. Phylogeography: retrospect and prospect. Journal of Biogeography. 2009;36(1):3-15.
- Frankham R, Ballou JD, Briscoe DA. Introduction to Conservation Genetics. Cambridge University Press; 2010.
- Shrestha TK. Ichthyology of Nepal: drainage history and endemic species. Himalayan Journal of Sciences. 2008;5(7):37-46.
- Rajbanshi KG. Zoogeographical distribution and the status of cold water fish in Nepal. Nepal Journal of Aquaculture and Fisheries. 2012;1(1):13-21.
- Barat A, Sahoo PK, Kumar R, Goel C, Singh AK. Genetic diversity assessment of snow trout populations from Indian Himalaya. Conservation Genetics Resources. 2016;8(3):287-291.
- Selkoe KA, Toonen RJ. Microsatellites for ecologists: a practical guide. Ecology Letters. 2006;9(5):615-629.
- Jarne P, Lagoda PJL. Microsatellites, from molecules to populations and back. Trends in Ecology and Evolution. 1996;11(10):424-429.
- Hebert PDN, Ratnasingham S, deWaard JR. Barcoding animal life: cytochrome c oxidase subunit 1 divergences among closely related species. Proceedings of the Royal Society B. 2003;270(Suppl 1):S96-S99.
- Lal KK, Singh RK, Mohindra V, Barat A. Genetic structure of Indian snow trout assessed through International Journal of Biology Sciences https://www.biologyjournal.net mitochondrial D-loop variation. Molecular Ecology Resources. 2011;11(4):718-726.
- Beheregaray LB. Twenty years of phylogeography: the state of the field and challenges for the Southern Hemisphere. Molecular Ecology. 2008;17(17):37543774.
- Allendorf FW, Luikart GH, Aitken SN. Conservation and the Genetics of Populations. Wiley-Blackwell; 2013.
- Waits LP, Paetkau D. Noninvasive genetic sampling tools for wildlife biologists: A review of applications and recommendations. Journal of Wildlife Management. 2005;69(4):1419-1433.
- Dubey VK, Colas F, Grenouillet G, Jayaram M, Chandra K. Transferability of microsatellite primers in cyprinid fishes of Himalayan rivers. Biochemical Systematics and Ecology. 2019;83:1-4.
- Ward RD, Zemlak TS, Innes BH, Last PR, Hebert PDN. DNA barcoding Australia's fish species. Philosophical Transactions of the Royal Society B. 2005;360(1462):1847-1857.
- Peakall R, Smouse PE. GenAlEx 6.5: genetic analysis in Excel. Bioinformatics. 2012;28(19):2537-2539.
- Rozas J, Ferrer-Mata A, Sanchez-DelBarrio JC, GuiraoRico S, Librado P, Ramos-Onsins SE, Sanchez-Gracia A. DnaSP 6: DNA sequence polymorphism analysis of large data sets. Molecular Biology and Evolution. 2017;34(12):3299-3302.