
Research article · 2025 · Full text
International Journal of Biology SciencesCytoskeletal reorganization during epithelial-mesenchymal transition in breast cancer cells
Volume 7(10) · Pages 196–199 · DOI: 10.33545/26649926.2025.v7.i10c.788 ↗
Research areasCancer Cells and MetastasisTGF-β signaling in diseasesCellular Mechanics and Interactions
Abstract
Author-writtenRoughly 90% of cancer-related deaths are attributed to metastasis, and the Epithelial-Mesenchymal Transition (EMT) represents a central mechanism through which carcinoma cells gain migratory and invasive capabilities. During EMT, the internal scaffolding of the cell its cytoskeleton undergoes dramatic rearrangement, shifting from a rigid, cortical actin architecture to a more dynamic, stress-fiber-dominated organization that enables cell motility. This research investigated the temporal sequence of cytoskeletal changes during TGF-β-induced EMT in MCF-7 and MDA-MB-231 human breast cancer cell lines. Cells were treated with 10 ng/mL recombinant human TGF-β1 and harvested at 24, 48, and 72 hours post-treatment. Immunofluorescence staining for F-actin, vimentin, E-cadherin, and α-smooth muscle actin was performed alongside western blot quantification and real-time PCR for key EMT markers. Results showed that actin stress fibers appeared as early as 24 hours in MCF-7 cells, with vimentin expression rising 3.1-fold by 48 hours. E-cadherin protein levels dropped by 81% at 72 hours compared with untreated controls, while the transcriptional repressors SNAI1 and ZEB1 peaked at 48 and 72 hours, respectively. MDA-MB-231 cells, which already display mesenchymal traits, showed smaller fold changes but exhibited enhanced lamellipodia formation and focal adhesion turnover. Wound healing assays confirmed that TGF-β-treated MCF-7 cells migrated 2.7 times faster than controls by 72 hours. Rho-kinase inhibition with Y-27632 partially reversed stress fiber formation and slowed migration by 43%, indicating that the RhoA/ROCK pathway is a key driver of cytoskeletal remodeling during this process. These data map the time course of cytoskeletal reorganization during breast cancer EMT and highlight specific molecular targets that could be explored for anti-metastatic intervention.
Summary
Source-checkedPlain-language reading of the full paper, prepared with AI and checked against the text. Each point links to the authors' own words.
Why it matters
- Metastasis is responsible for approximately 90% of cancer deaths, and the Epithelial-Mesenchymal Transition (EMT) is a key process that allows cancer cells to become invasive and migratory. View evidence ↗
- EMT involves a major reorganization of the cell's cytoskeleton, moving from a rigid cortical actin structure to a dynamic organization dominated by stress fibers to enable movement. View evidence ↗
- While transcriptional regulators of EMT are well-studied, the exact timing and sequence of the accompanying cytoskeletal changes are not fully understood. View evidence ↗
The question
- The study aimed to investigate the temporal sequence of cytoskeletal changes during EMT induced by TGF-β in two human breast cancer cell lines: MCF-7 and MDA-MB-231. View evidence ↗
What they did
- Breast cancer cells were treated with 10 ng/mL of recombinant human TGF-β1 and analyzed at 24, 48, and 72 hours. View evidence ↗
- The researchers used immunofluorescence staining for F-actin, vimentin, E-cadherin, and α-SMA, as well as western blotting and real-time PCR to quantify EMT markers. View evidence ↗
- To test the role of the Rho-kinase pathway, the inhibitor Y-27632 was added at a concentration of 10 μM at the same time as the TGF-β treatment. View evidence ↗
- Cell migration was measured using wound healing assays, where gap closure was tracked at 0, 24, 48, and 72 hours. View evidence ↗
What they found
- In MCF-7 cells, actin stress fiber intensity increased 1.8-fold at 24 hours and reached 4.1-fold by 72 hours. View evidence ↗
- Vimentin expression in MCF-7 cells increased significantly at 48 hours, showing a 3.1-fold increase. View evidence ↗
- E-cadherin protein levels in MCF-7 cells decreased steadily, falling to 19% of the baseline by 72 hours. View evidence ↗
- The transcriptional repressor SNAI1 peaked at 48 hours (3.4-fold), while ZEB1 continued to increase up to 72 hours (3.9-fold). View evidence ↗
- TGF-β treatment increased the migration of MCF-7 cells 2.7-fold, with 83.6% wound closure at 72 hours compared to 41.2% in the control group. View evidence ↗
- The ROCK inhibitor Y-27632 reduced TGF-β-induced wound closure to 47.9%, representing a 43% inhibition of migration. View evidence ↗
- MDA-MB-231 cells had high baseline vimentin (6.8-fold relative to MCF-7 control) and showed only a modest 1.4-fold increase after 72 hours of TGF-β treatment. View evidence ↗
What it means
- The authors conclude that cytoskeletal reorganization during EMT is a staggered cascade, starting with actin stress fibers (24h), followed by vimentin (48h), and steady E-cadherin loss (72h). View evidence ↗
- The authors suggest that targeting ROCK-dependent actin remodeling within the first 24-48 hours of EMT could potentially prevent cancer cells from becoming fully migratory. View evidence ↗
Visual summary
2 visualsIllustrations explain the paper; charts are replotted from the paper's own table values.
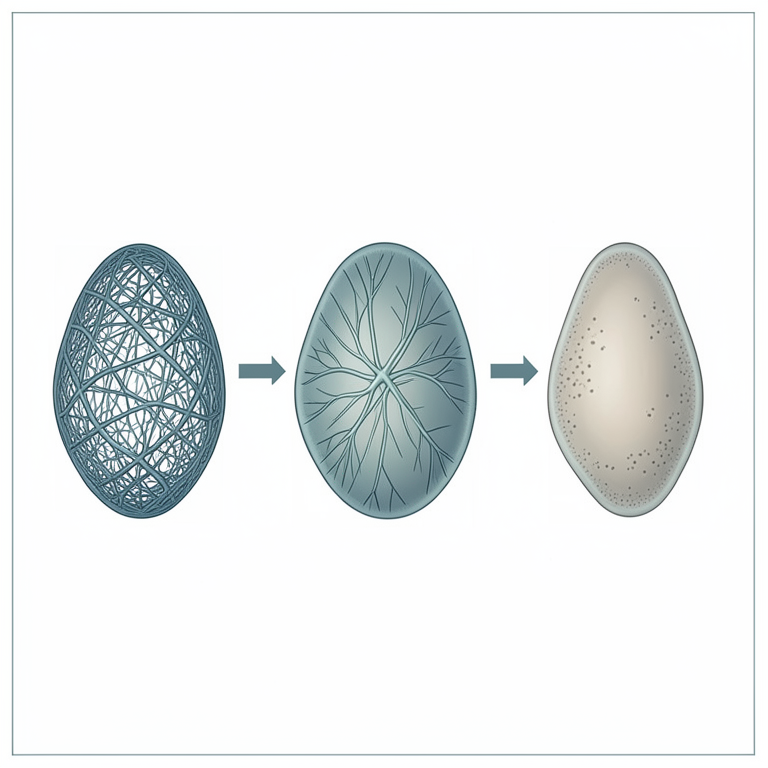
Temporal Cascade of EMT
AI-generated conceptual illustration (breast cancer cells). It explains the idea and does not show study data.
View source evidence ↗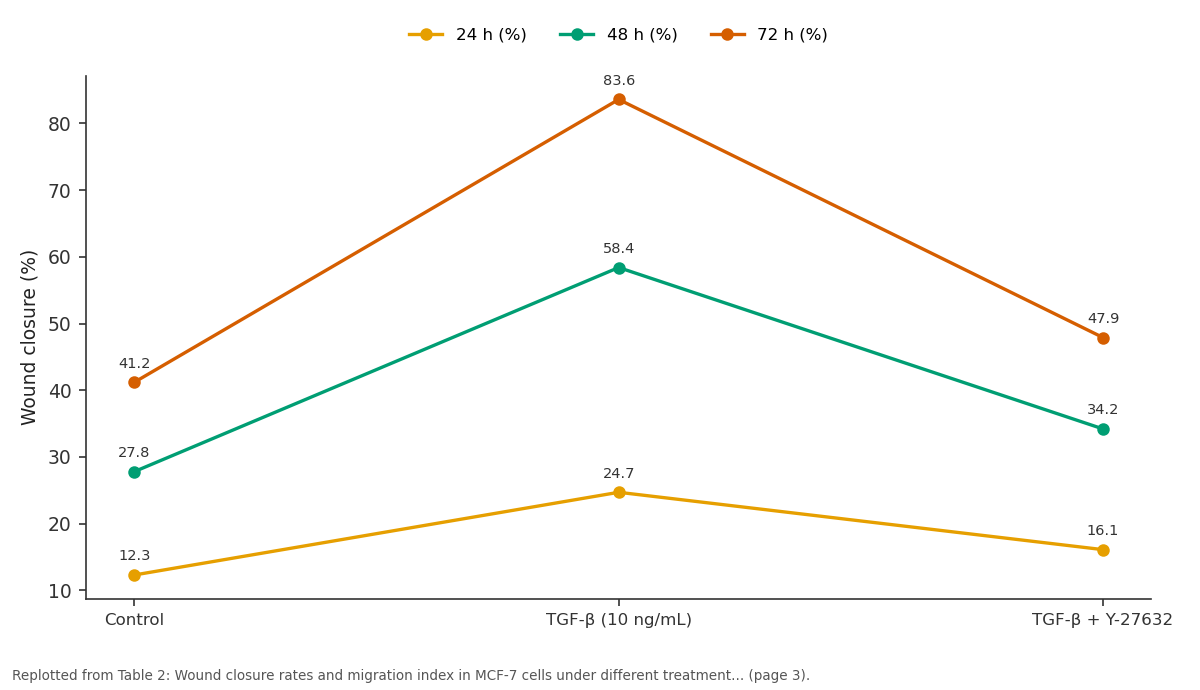
24 h (%) and 48 h (%) and more: Control vs TGF-β (10 ng/mL) vs TGF-β + Y-27632
Replotted from Table 2 (page 3) of the original paper. Every bar is the paper's own table value.
View source evidence ↗Figures & tables
From the original paper Table 1
 Table 2
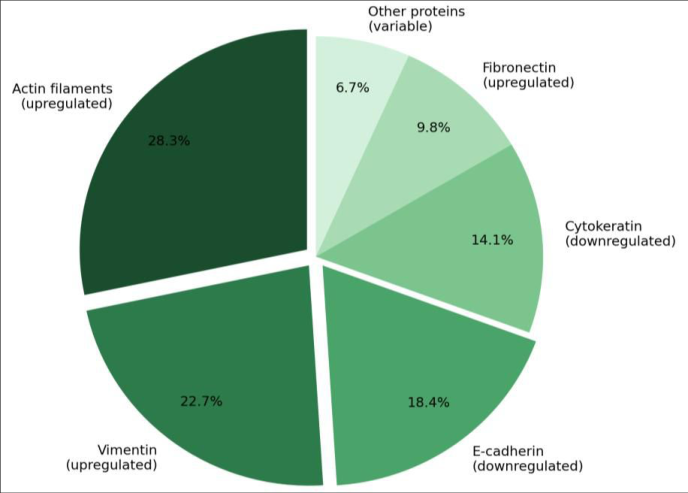 Figure 1
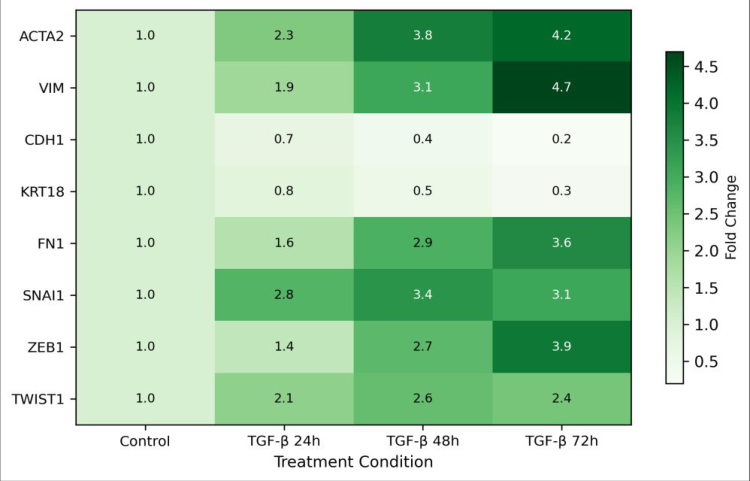 Figure 2
Introduction
Breast cancer accounts for about 2.3 million new diagnoses each year worldwide, making it the most frequently detected malignancy in women [1] . While primary tumors can often be managed surgically, it is the spread of cancer cells to distant organs that drives patient mortality. The epithelial-mesenchymal transition a reversible program through which polarized epithelial cells adopt a mesenchymal phenotype has been identified as a core mechanism enabling invasion and dissemination [2] . At a cellular level, EMT involves the dissolution of intercellular junctions, loss of apicobasal polarity, and wholesale reorganization of the cytoskeleton [3] . The actin network, in particular, shifts from a cortical distribution that supports cell-cell contacts to a stress-fiber configuration that generates traction forces for migration. Intermediate filaments swap from cytokeratins to vimentin, and the microtubule network reorients toward the leading edge of the moving cell [4] . These structural changes are orchestrated by signaling cascades, with TGF-β acting as a master inducer through Smad-dependent and Smad-independent pathways, including RhoA/ROCK and PI3K/Akt [5] . Despite extensive work on transcriptional regulators of EMT such as SNAIL, SLUG, ZEB1, and TWIST, the precise timing and sequence of cytoskeletal changes remain less clear [6] . Most existing reports capture a single time point or focus on just one cytoskeletal component. A time-resolved view of how the whole cytoskeletal network reshapes itself during EMT would help clarify which changes are early drivers and which are late consequences.
This research addressed that gap by tracking multiple cytoskeletal and EMT markers in two breast cancer cell lines over a 72-hour TGF-β treatment course. MCF-7 was chosen because it retains strong epithelial characteristics, while MDA-MB-231 already sits closer to the mesenchymal end of the spectrum, allowing comparison of how EMT remodeling differs by baseline phenotype [7] . We also tested whether ROCK inhibition could block or reverse specific cytoskeletal changes, to assess the pathway's contribution to the mechanical aspects of EMT [8] .
Material and Methods
Material and Methods
Material
Material
Reagents and chemicals
Recombinant human TGF-β1 was purchased from PeproTech (Cat. No. 100-21, Rocky Hill, USA). ROCK inhibitor Y-27632 was obtained from Selleckchem (Cat. No. S1049). Primary antibodies included anti-E-cadherin (Cell Signaling Technology; Cat. No. 3195S), anti-vimentin (Abcam; Cat. No. ab92547), anti-α-SMA (Sigma-Aldrich; Cat. No. A2547), and anti-GAPDH (Santa Cruz; Cat. No. sc-47724). Alexa Fluor 488-phalloidin (Invitrogen; Cat. No. A12379) was used for F-actin staining. RIPA lysis buffer, protease inhibitor cocktail, and PVDF membranes were sourced from Thermo Fisher Scientific. All reagents were of cell-culture or molecular-biology grade.
Methods
Cells were seeded at 2 × 10⁵ per well in six-well plates and allowed to attach for 24 hours before treatment with 10 ng/mL TGF-β1. For ROCK inhibition experiments, Y-27632 was added at 10 μM simultaneously with TGF-β. At 24, 48, and 72 hours, cells were harvested for analysis. For immunofluorescence, cells grown on glass coverslips were fixed in 4% paraformaldehyde, permeabilized with 0.1% Triton X-100, blocked with 3% BSA, and incubated with primary antibodies overnight at 4°C followed by Alexa Fluor-conjugated secondary antibodies. F-actin was visualized using Alexa Fluor 488-phalloidin. Images were captured on a Nikon Eclipse Ti-2 fluorescence microscope. Western blotting followed standard protocols: 30 μg total protein per lane, 10% SDS-PAGE, transfer to PVDF, and chemiluminescent detection with SuperSignal West Pico (Thermo Fisher). Band intensities were quantified using ImageJ v1.54. Gene expression was assessed by quantitative RT-PCR using SYBR Green chemistry on a Bio-Rad CFX96 system, with GAPDH as the reference gene. Wound healing assays were performed by scratching confluent monolayers with a 200 μL pipette tip, and gap closure was measured at 0, 24, 48, and 72 hours using ImageJ [9] . All experiments were performed in triplicate, and data were analyzed with one-way ANOVA followed by Tukey's posthoc test in GraphPad Prism v9.5. Significance was set at P < 0.05.
Cell preparation protocol
Cells from frozen stocks were thawed rapidly in a 37°C water bath and seeded in T-75 flasks. Passage numbers between 15 and 25 were used for all experiments to minimize phenotypic drift. Before each experiment, mycoplasma testing was conducted using the MycoAlert Detection Kit (Lonza; Cat. No. LT07-318), and only mycoplasma-negative cultures were used. Cell viability was confirmed to exceed 95% by trypan blue exclusion prior to plating. 3.9 <0.001 Values represent mean fold change relative to untreated control (n = 3). P-values from one-way ANOVA TGF-β triggered a clear temporal cascade of changes in MCF-7 cells. Actin stress fiber intensity rose 1.8-fold within 24 hours and reached 4.1-fold by 72 hours, whereas vimentin upregulation lagged slightly, becoming prominent at 48 hours (3.1-fold). E-cadherin declined steadily, dropping to 19% of baseline by 72 hours. The transcription factor SNAI1 peaked at 48 hours (3.4-fold) and then plateaued, while ZEB1 continued to rise through 72 hours (3.9-fold), suggesting sequential activation of these repressors. In MDA-MB-231 cells, baseline vimentin was already high (6.8-fold relative to MCF-7 control), and TGF-β treatment produced more modest additional increases (1.4-fold by 72 hours). However, these cells showed pronounced lamellipodia extension and increased focal adhesion kinase phosphorylation at 24 hours, suggesting that cytoskeletal remodeling in mesenchymal-type cells occurs through different downstream effectors.
Results
Results
Discussion
The temporal mapping presented here reveals that cytoskeletal reorganization during EMT isn't a single coordinated event but rather a staggered cascade. Actin stress fiber formation was the earliest detectable change, appearing within 24 hours of TGF-β exposure. Vimentin upregulation followed at 48 hours, and E-cadherin loss progressed steadily over the full 72-hour window. This sequence makes biological sense: stress fibers generate the contractile forces needed for initial cell spreading, while vimentin provides mechanical resilience to the newly elongated cell body [10] . The peak of SNAI1 at 48 hours followed by ZEB1's continued rise at 72 hours is consistent with a two-wave transcriptional program reported in pancreatic and lung carcinoma models [11] . SNAI1 appears to initiate junction disassembly and early cytoskeletal changes, whereas ZEB1 maintains and deepens the mesenchymal phenotype. Our data suggest this temporal handoff operates similarly in breast cancer EMT. ROCK inhibition with Y-27632 reduced TGF-β-induced migration by 43% but didn't fully abolish it, indicating that parallel pathways possibly Rac1-driven lamellipodia formation or Cdc42-mediated filopodia extension also contribute to the motility gain [12] . This partial reversal is clinically interesting because it implies that ROCK inhibitors alone may not be enough to prevent metastatic spread, and combination strategies targeting multiple cytoskeletal regulators may be needed. A limitation of this work is that two-dimensional culture conditions do not fully recapitulate the three-dimensional extracellular matrix environment encountered in vivo. Cells migrating through collagen or Matrigel face different mechanical constraints than those in a wound-healing assay on plastic [13] . Future experiments using three-dimensional spheroid invasion assays or organotypic culture systems would provide a more physiologically relevant picture of how cytoskeletal remodeling translates to actual tissue invasion.
Conclusion
This research mapped the temporal order of cytoskeletal reorganization during TGF-β-induced EMT in breast cancer cells and identified actin stress fiber formation as the earliest structural change, followed by vimentin upregulation and progressive E-cadherin loss. The transcriptional repressors SNAI1 and ZEB1 showed staggered activation consistent with a two-wave regulatory model. ROCK inhibition partially blocked stress fiber assembly and migration, confirming the RhoA/ROCK axis as an important but not sole mediator of EMT-associated motility. These findings provide a timeline against which future therapeutic interventions can be designed. Targeting early events such as ROCK-dependent actin remodeling within the first 24-48 hours of EMT initiation may offer a window to prevent cancer cells from acquiring full migratory capacity. Combining ROCK inhibitors with agents that block parallel pathways such as Rac1 could yield more complete suppression of cytoskeletal-driven invasion. Testing these combinations in three-dimensional culture models and eventually in preclinical animal models would be the logical next step.
Figures and tables from the paper
| Marker | Control | 24 h | 48 h | 72 h | P-value |
|---|---|---|---|---|---|
| F-actin (stress fibers) | 1.0 | 1.8 | 3.2 | 4.1 | <0.001 |
| Vimentin | 1.0 | 1.4 | 3.1 | 4.7 | <0.001 |
| E-cadherin | 1.0 | 0.72 | 0.38 | 0.19 | <0.001 |
| Cytokeratin-18 | 1.0 | 0.81 | 0.53 | 0.31 | <0.01 |
| α-SMA | 1.0 | 2.3 | 3.8 | 4.2 | <0.001 |
| SNAI1 mRNA | 1.0 | 2.8 | 3.4 | 3.1 | <0.01 |
| ZEB1 mRNA | 1.0 | 1.4 | 2.7 | 3.9 | <0.001 |
Table text extracted from the original PDF; superscript letters are shown inline. The original table image is below.
View original table image
| Condition | 24 h (%) | 48 h (%) | 72 h (%) | P-value |
|---|---|---|---|---|
| Control | 12.3 | 27.8 | 41.2 | - |
| TGF-β (10 ng/mL) | 24.7 | 58.4 | 83.6 | <0.001 |
| TGF-β + Y-27632 | 16.1 | 34.2 | 47.9 | <0.05 |
| Y-27632 alone | 10.8 | 24.1 | 38.7 | 0.42 |
Table text extracted from the original PDF; superscript letters are shown inline. The original table image is below.
View original table image
References
19 in the original paper- Sung H, Ferlay J, Siegel RL, Laversanne M, Soerjomataram I. Global cancer statistics 2020. CA: A Cancer Journal for Clinicians. 2021;71(3):209-249.
- Nieto MA, Huang RYJ, Jackson RA, Thiery JP. EMT: 2016. Cell. 2016;166(1):21-45.
- Yilmaz M, Christofori G. EMT, the cytoskeleton, and cancer cell invasion. Cancer and Metastasis Reviews. 2009;28(1-2):15-33.
- Brabletz T, Kalluri R, Nieto MA, Weinberg RA. EMT in cancer. Nature Reviews Cancer. 2018;18(2):128-134.
- Derynck R, Muthusamy BP, Saeteurn KY. Signaling pathway cooperation in TGF-beta-induced epithelialmesenchymal transition. Current Opinion in Cell Biology. 2014;31:56-66.
- De Craene B, Berx G. Regulatory networks defining EMT during cancer initiation and progression. Nature Reviews Cancer. 2013;13(2):97-110.
- Neve RM, Chin K, Fridlyand J, Yeh J, Baehner FL. A collection of breast cancer cell lines for the investigation of functionally distinct cancer subtypes. Cancer Cell. 2006;10(6):515-527.
- Rath N, Olson MF. Rho-associated kinases in tumorigenesis: reconsidering ROCK inhibition for cancer therapy. EMBO Reports. 2012;13(10):900-908.
- Liang CC, Park AY, Guan JL. In vitro scratch assay: a convenient and inexpensive method for analysis of cell migration in vitro. Nature Protocols. 2007;2(2):329333.
- Pollard TD, Cooper JA. Actin, a central player in cell shape and movement. Science. 2009;326(5956):12081212.
- Caramel J, Paber E, Plber T, Valsesia-Wittmann S, Puisieux A. A switch in the expression of embryonic EMT-inducers drives the development of malignant melanoma. Cancer Cell. 2013;24(4):466-480.
- Spiering D, Hodgson L. Dynamics of the Rho-family small GTPases in actin regulation and motility. Cell Adhesion and Migration. 2011;5(2):170-180.
- Weigelin B, Bakker GJ, Friedl P. Intravital third harmonic generation microscopy of collective melanoma cell invasion. IntraVital. 2012;1(1):32-43.
- Pei D, Shu X, Gassama-Diagne A, Thiery JP. Mesenchymal-epithelial transition in development and reprogramming. Nature Cell Biology. 2019;21(1):4453.
- Lamouille S, Xu J, Derynck R. Molecular mechanisms of epithelial-mesenchymal transition. Nature Reviews Molecular Cell Biology. 2014;15(3):178-196.
- Huang RYJ, Guilford P, Thiery JP. Early events in cell adhesion and polarity during epithelial-mesenchymal transition. Journal of Cell Science. 2012;125(19):44174422.
- Reymond N, d'Agua BB, Ridley AJ. Crossing the endothelial barrier during metastasis. Nature Reviews Cancer. 2013;13(12):858-870.
- Sasaki AT, Janetopoulos C, Lee S, Chernock PG, Firtel RA. G protein-independent Ras/PI3K/F-actin circuit regulates basic cell motility. Journal of Cell Biology. 2007;178(2):185-191.
- Guan X. Cancer metastases: challenges and opportunities. Acta Pharmaceutica Sinica B. 2015;5(5):402-418.